Revista Brasileira de
Engenharia Agrícola e Ambiental
Campina Grande, PB, UAEA/UFCG – http://www.agriambi.com.br
v.21, n.6, p.433-439, 2017
Soil resistance to penetration in cotton rows and interrows
Fábio H. R. Baio
1, Igor M. Scarpin
1, Cassiano G. Roque
1& Danilo C. Neves
1DOI: http://dx.doi.org/10.1590/1807-1929/agriambi.v21n6p433-439
A B S T R A C T
The soil physical quality is one of the most determinant factors for the development of any crop. This study aimed to assess the sample representativeness in soil resistance to penetration mappings taken in rows and interrows of the cotton crop, under two soil moisture conditions. Thirty control points were sampled in a cotton field of 91 ha. Soil resistance to penetration and soil moisture were measured at these georeferenced points. Regardless of soil moisture, the sampling position of soil resistance to penetration is indifferent (row, interrow, or in both positions) when the analysed depth is greater than 0.20 m in the cotton crop. The decrease of soil moisture causes the increment of soil resistance to penetration, regardless of the sampling position.
Resistência mecânica do solo à penetração
nas linhas e entrelinhas no cultivo do algodoeiro
R E S U M O
A qualidade física do solo é um dos fatores mais determinantes no desenvolvimento de qualquer cultura. Este trabalho teve, como objetivo, avaliar a representatividade amostral nos mapeamentos da resistência mecânica do solo à penetração nas linhas e entrelinhas no cultivo do algodoeiro, sob duas condições de umidade. Foram amostrados 30 pontos de controle em um talhão de 91 ha cultivado com algodoeiro. Foram realizadas leituras da resistência mecânica do solo à penetração (RP) e de umidade nesses pontos georreferenciados. Independentemente da umidade do solo é indiferente o posicionamento amostral da resistência mecânica do solo à penetração (linha, entrelinha ou em ambas as posições) quando a camada analisada é maior que 0,20 m no cultivo do algodoeiro. A diminuição da umidade do solo ocasiona o aumento dos valores da resistência mecânica do solo à penetração, independentemente do posicionamento amostral.
Key words: cone index penetrometer soil compaction
Palavras-chave: índice de cone penetrômetro compactação
1 Universidade Federal de Mato Grosso do Sul. Chapadão do Sul, MS. E-mail: [email protected] (Corresponding author); [email protected];
Introduction
Monitoring soil compaction is extremely important, because of the high level of traffic of machines and implements employed in the modern cultivation systems. Currently, there is an intensification of soil exploitation to obtain higher yields, which leads to different forms of soil degradation in the long run, despite being associated with conservation techniques (Cavalieri et al., 2011). Soil compaction negatively affects root growth and, consequently, decreases crop yield (Bastiani et al., 2012).
According to Cardoso et al. (2013), the increase in soil density, due to the traffic of machines, leads to the loss of stability of its aggregates and affects the development of the root system of the plants. In a study on the effect of the traffic on soil physical attributes, Roque et al. (2011) concluded that mechanization decreases macroporosity and increases soil density, especially along the crop interrows.
The soil mechanical resistance to penetration (RP) measures the resistance that the soil has against the penetration of a conic tip with standardized specifications. For a same soil, the higher its density, the higher the resistance to penetration as well, and the lower its macroporosity (Montanari et al., 2012). Molin et al. (2006) observed that RP was influenced especially by water content, density and porous space of the soil.
Tavares Filho & Ribon (2008) affirm that it is important to increase the number of samples in studies on compaction; however, sampling intensification is limited by the cost-benefit ratio, often leading to insufficient replicates. According to Demattê et al. (2014), higher sampling density increases the detailing of the spatial variability of the resulting map, but increases the operational cost of the mapping.
As the sampling intensity is important to characterize soil compaction, sampling position is also fundamental for its adequate representativeness. This study aimed to evaluate the sampling representativeness in the mappings of soil mechanical resistance to penetration in the rows and interrows of the cotton crop, under two moisture conditions.
Material and Methods
The studies were carried out at the Amambaí Farm, in the municipality of Chapadão do Céu-GO, Brazil, located at the geographic coordinates of 18º 21’ S and 52º 37’ W, at mean altitude of 815 m, on a predominantly gentle relief with slope of 2%, in an area of 91 ha cultivated with cotton (Gossypium hirsutum L.), which were mapped during the 2013/14 season. All cultivation practices in the cotton crop were performed according to the technical recommendations for the cultivation in the region (Freire, 2015).
The soil of the experimental area has, on average, 43% of clay and was classified as distroferric Red Latosol (EMBRAPA, 2009). The annual rainfall was 2,196 mm and mean temperature was 22.5 ºC. The maximum rainfalls concentrate between the months of December and March of every year. The climate of the region is characterized, according to Köppen’s classification, as tropical climate with dry season in the winter.
Cotton was sown on January 3, 2014 with a seeder-fertilizer CCS 2122 (John Deere, Horizontina, Brazil), with double-disc
furrower for fertilizers and seeds and weight of 13,100 kg when empty. Soil scarification was performed at 0.35 m in the total area in October 2008, followed by the cultivation with cotton (2008), soybean and maize (2009), soybean and maize (2010), cotton (2011), maize and pasture (2012), soybean and sorghum (2013) and bean and cotton (2014).
The experiment was set in a 3 x 4 factorial scheme, in randomized blocks (30 points), with three replicates, to evaluate the variation of soil mechanical resistance to penetration (RP) measured in the row, interrow and the mean value between row and interrow, in four layers (0-0.10, 0.10-0.20, 0.20-0.30 and 0.30-0.40 m).
Thirty georeferenced sampling points were geospatialized in a random grid with the data collected at 23 days after emergence (DAE) of the cotton crop. The georeferencing and navigation to the sampling points were performed using a GNSS Nomad receiver (Trimble, Westminster, USA) and the field sampling program Farm Works Mobile (Trimble, Hamilton, USA).
RP was mapped using a handheld penetrometer with electronic data acquisition, model Penetrolog PLG1020 (Falker, Porto Alegre, Brazil). Six RP measurements were taken in each sampling point, spaced by 0.20 m, collecting three samples in the row and three in the interrow of the crop. This collection was simultaneous to the measurement of soil volumetric moisture content using the electronic probe HidroFarm HMF2030 (Falker, Porto Alegre, Brazil) in the same georeferenced points, as well as the clay fraction. For comparison purposes and according to the methodology described by Gava et al. (2016), soil moisture was measured by the gravimetric method using undisturbed sample in ten sampling points and at four depths spaced by 0.10 m, allowing the field calibration of the probe.
The sampling values obtained in the georeferenced points were entered in the geographic information system (GIS) program SSToolbox 3.8.0 (SST Development Group Inc., Stillwater, USA), to elaborate the isoline maps of RP values, representing the spatial variability of the compaction in the rows and interrows. The occurrence of candidates to discrepant data and the need for data transformation for normalization were analysed (Isaaks & Srivastava, 1989). The semivariograms were modeled using the program ArcGis 10.4 (ESRI, Redlands, USA). The selected semivariograms were those modeled with higher correlation coefficient by the cross validation. The spatial dependence index of the modeled semivariograms was calculated. Trangmar et al. (1985) suggested the use of the percentage of the nugget effect variance to measure the spatial dependence.
The methodology employed in the interpolation of the sampling values was ordinary kriging in blocks for those variables in which it was possible to identify spatial dependence. For variables whose semivariogram showed pure nugget effect, the methodology was that of the inverse distance squared; however, the obtained maps allowed only a visual analysis of RP variability, because the statistical analysis were performed with the actual values measured in each sampling point and not by the values estimated in the interpolation.
of that, the data were subjected to analysis of variance and the effects of treatments were evaluated by Tukey test at 0.05 probability level.
Results and Discussion
The results of the statistical analysis presented in Table 1 for the samplings performed at 73 DAE of the cotton cycle and with mean volumetric moisture content of 27.7% reveal, as expected, that there was an increase of RP between the first and the other soil layers. Sampling location (row, interrow or both) only showed relevance in the difference between the means of the treatments when the mapping was made in the row of the most superficial layer. Sampling position did not cause difference in the means of the treatments for the other layers, i.e., it is indifferent if the RP mapping is made by samplings in the row, interrow or both. The surface layer is less compacted compared with the others, regardless of sampling position.
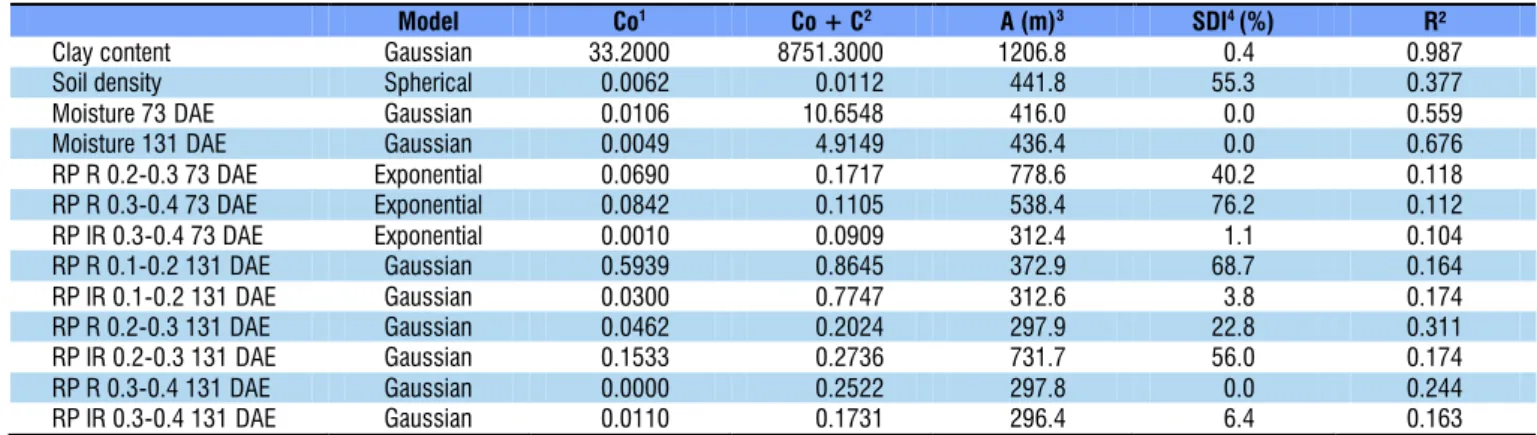
Table 2 presents the results of the geostatistical analysis for variables of the mapping of the studied attributes. The variable clay content showed a range of 1,207 m, the highest correlation coefficient through the cross validation and strong spatial dependence, illustrating that the modeled semivariogram and the interpolated map adequately explain the spatial continuity of this attribute. The great range for this attribute can be explained by the fact that the area has low slope and the same parent material. The theoretical model of the semivariograms fitted to most of the attributes was the Gaussian, followed by the exponential and spherical. The various semivariograms modeled for RP showed range varying between 296.4 to 778.6 m, being adequate according to the utilized sampling distances. The semivariograms modeled for RP in various
layers showed low correlation coefficients through the cross validation, although some showed moderate to strong spatial dependence index. This result shows that, possibly, the utilized sampling distances could be smaller, increasing the number of pairs of values in the short scale of the semivariogram and, possibly, improving the representativeness of the fitted model. All analysed variables of RP in the first layers did not show spatial continuity, illustrating the difficulty to measure RP in various layers by the same sampling grid.
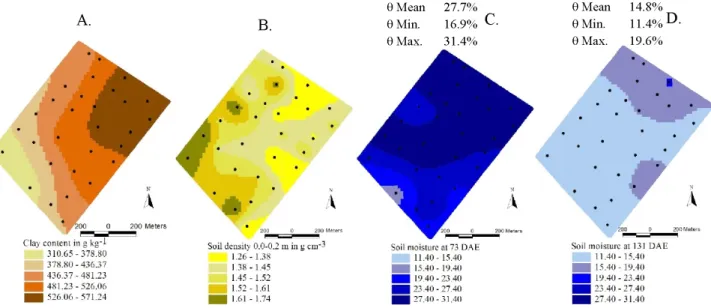
According to Figure 1, there was lower accumulation of moisture in the regions where there is a decrease in the soil clay fraction, influenced by the reduction of micropores, responsible for the highest water retention and by the increase in the adsorption surface of the soil particles. Thus, the soil moisture characterization in the sampling points is important in the compaction mapping because, by itself, it is already a factor that interferes with the measured RP values and, therefore, with their spatial variability. This finding was predicted by Grego et al. (2006), who reported that agricultural experiments usually consider soil moisture as uniform in space and, consequently, because of that, the results are frequently misinterpreted. This fact renders inadequate the simple comparison through a correlation analysis of the different RP maps in the same area; thus, comparative control points become essential in studies on this topic.
Figure 1 also allows to observe that there is a negative relationship between the maps of soil moisture and soil density. In the more compacted regions, there is a decrease in the porous spaces due to the soil densification. This relationship becomes more evident in soils with higher moisture contents. Silveira et al. (2010) observed that the relationship between moisture and soil resistance to penetration is an exponential function. According to Dexter & Watts (2000), soil compaction is more harmful in a dry soil and, under conditions of higher moisture contents, there might be root growth at RP values higher than 4.0 MPa. Torres et al. (2012) report that RP values are inversely correlated with the volumetric soil moisture contents.
The compaction along the row has lower values in the surface layers (0-0.10 and 0.10-0.20 m) and is regionalized in a smaller portion of the area, compared with the map relative to the interrow (Figure 2). Such occurrence can be explained by the decompaction regionalized in the furrow caused by the furrowing mechanisms used in the fertilizer machine, which promote a decompaction between depths of 0.08 and 0.12 m, since the fertilizer at sowing was regulated to be applied
1Nugget effect; 2Sill; 3Range; 4Spatial dependence index, given by Co/Co + C; RP - Soil resistance to penetration; R - Row; IR - Interrow; DAE - Days after emergence
Model Co1 Co + C2 A (m)3 SDI4(%) R²
Clay content Gaussian 33.2000 8751.3000 1206.8 00.4 0.987
Soil density Spherical 00.0062 0000.0112 0441.8 55.3 0.377
Moisture 73 DAE Gaussian 00.0106 0010.6548 0416.0 00.0 0.559
Moisture 131 DAE Gaussian 00.0049 0004.9149 0436.4 00.0 0.676
RP R 0.2-0.3 73 DAE Exponential 00.0690 0000.1717 0778.6 40.2 0.118
RP R 0.3-0.4 73 DAE Exponential 00.0842 0000.1105 0538.4 76.2 0.112
RP IR 0.3-0.4 73 DAE Exponential 00.0010 0000.0909 0312.4 01.1 0.104
RP R 0.1-0.2 131 DAE Gaussian 00.5939 0000.8645 0372.9 68.7 0.164
RP IR 0.1-0.2 131 DAE Gaussian 00.0300 0000.7747 0312.6 03.8 0.174
RP R 0.2-0.3 131 DAE Gaussian 00.0462 0000.2024 0297.9 22.8 0.311
RP IR 0.2-0.3 131 DAE Gaussian 00.1533 0000.2736 0731.7 56.0 0.174
RP R 0.3-0.4 131 DAE Gaussian 00.0000 0000.2522 0297.8 00.0 0.244
RP IR 0.3-0.4 131 DAE Gaussian 00.0110 0000.1731 0296.4 06.4 0.163
Table 2. Results of the geostatistical analysis for the mapped variables Coefficient of variation = 12.36%; FPosition = 0.1112ns; F
Layer = 0.000**; FP&L = 0.0439 ns;
Means followed by different lowercase letters in the column and different uppercase letters in the row differ by Tukey test at 0.05 probability level
Position Layer (m)
0-0.10 0.10-0.20 0.20-0.30 0.30-0.40 Mean
Row 0.5013 b B 2.4088 a A 2.6675 a A 2.5838 a A 2.0403 Interrow 1.1638 a B 2.5563 a A 2.6475 a A 2.5200 a A 2.2219 Row and interrow 0.8338 a B 2.5125 a A 2.6575 a A 2.5488 a A 2.1381 Mean 0.8329 BA 2.4925 AA 2.6575 AA 2.5508 AA
Obs.: The illustrated points represent the sampling positions
Figure 1. Maps of soil clay fraction (A) and soil density (B) and maps of volumetric moisture content (θ%) at 73 DAE (C) and at 131 DAE (D)
Obs.: The illustrated points represent the sampling positions
Figure 2. Maps of soil resistance to penetration (MPa) obtained at 73 DAE, in the surface layers of 0-0.10 m (A1 and A2)
and 0.10-0.20 m (B1 and B2), and subsurface layers of 0.20-0.30 m (C1 and C2) and 0.30-0.40 m (D1 and D2)
at 0.10 m. Usually, double-disc furrowers can not reach this operation depth; however, the utilized seeder machine probably had enough weight to make the furrowers reach this depth. Both maps obtained through the RP mappings in the layer of 0-0.10 m have differences both spatial, for the regionalization
showed maximum RP above 2 MPa, considered as a compacted soil for most crops.
The map obtained by the sampling in the layer of 0.10-0.20 m in the row also shows lower compaction compared with the sampling in the interrow; however, both maps show RP higher than 3 MPa. Silva et al. (2002) report that the RP value of 2.0 MPa has been associated with impeditive conditions for root growth and shoot development of the plants.
There is a trend of similarity between the RP maps obtained through both sampling methodologies in the row and interrow in the subsurface layers (Figure 2). In these layers, the furrowing mechanism of the seeder-fertilizer machines hardly acts as a soil decompaction agent. Silva et al. (2004) observed that the distribution of soil compaction occurs systematically, being higher on the sides of the area due to the traffic of machines, but decreasing towards the center. This trend can also be observed in the maps obtained through both methodologies. The predominant traffic of machines occurred in the East-North direction of the area.
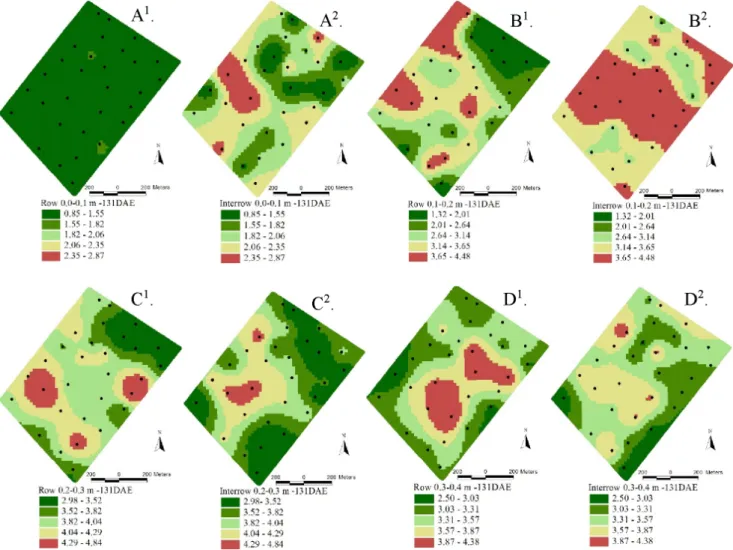
There was a difference between the sampling position in the row and interrow in both surface layers, 0-0.10 and 0.10-0.20 m, when the soil showed lower volumetric moisture at 131 DAE (Table 3). The surface layer of 0.10-0.20 m does not show statistical difference between the means through the mapping in the interrow or through the means of both sites (row and interrow); however, the mapping in the row showed lower values
Obs.: The illustrated points represent the sampling positions
Figure 3. Illustration of the maps of soil resistance to penetration (MPa) at 131 DAE, in the surface layers of 0-0.10 m (A1 and A2) and 0.10-0.20 m (B1 and B2), and subsurface layers of 0.20-0.30 m (C1 and C2) and 0.3-0.4 m (D1 and D2)
Coefficient of variation = 9.46%; FPosition = 0.0001**; FLayer = 0.0001**; FP&L = 0.0001**; Means followed by different lowercase letters in the column and different uppercase letters in the row differ by Tukey test at 0.05 probability level
Position Layer (m)
0-0.10 0.10-0.20 0.20-0.30 0.30-0.40 Mean
Row 0.6363 c C 2.8163 b BA4.0925 a A 3.4175 a AB 2.7406 b Interrow 1.9238 a B 3.7613 a AA3.7888 a A 3.4088 a AA3.2206 a Row and interrow 1.2725 b B 3.3000 ab A 3.9475 a A 3.4038 a AA2.9809 a Mean 1.2775 CA3.2925 BAA 3.4100 BA3.9429 AAA
Table 3. Soil resistance to penetration (MPa) at 131 DAE of the cotton crop for the different layers and sampling positions, and with mean volumetric moisture content of 14.8%
of RP. From the increase in the sampling depth in the subsurface layers, there was no difference between the position of the samples. Hence, since the compacted layers will usually be at depths greater than 0.20 m in the cotton crop, the sampling position in the row or interrow is indifferent for the mapping of soil resistance to penetration. Silva et al. (2009) also reported the same trend of higher values of soil compaction in the layer of 0-0.10 m, when the mapping was made in the interrow of the sugarcane crop.
of higher moisture, because the decrease in soil moisture is delayed in comparison to the sandy soils. The maps showed lower RP values in this region; thus, it is not possible to claim whether the spatial variability had greater influence through the lower compaction or through the greater local moisture. Thus, although there was no significant contribution to soil compaction due to the traffic of machines during the period between the samplings, there was a considerable increase in RP values, as expected, because of the decrease in moisture. The risk of compaction is high when the pressures applied on the soil are higher than its capacity to withstand them and are influenced by the moisture content (Alakuku et al., 2003). The intense traffic in cultivated areas becomes worrying, due to the possibility of spreading the compaction, especially when performed under inadequate moisture conditions (Silva et al., 2009). Even for the soil with lower moisture content, there was a similar trend at 131 DAE of difference between the maps obtained in the surface layer through the mappings in the row and interrow, and the latter showed higher values of soil resistance to penetration.
Conclusions
1. Regardless of soil moisture, the sampling position of the soil mechanical resistance to penetration (row, interrow or both positions) is indifferent when the analyzed layer is greater than 0.20 m in the cotton crop.
2. The decrease in soil moisture causes the increase in the values of soil mechanical resistance to penetration, regardless of the sampling position.
Acknowledgments
To the Foundation to Support the Development of the Teaching of Education, Science and Technology of Mato Grosso do Sul (Fundect) and to the National Council for Scientific and Technological Development (CNPq), for the financial support, and to the ‘Grupo Wink’, for providing the area.
Literature Cited
Alakuku, L.; Weisskopfb, P.; Chamenc, W. C. T.; Tijinkd, F. G. J.; Lindend, J. P.; Pirese, S.; Sommerf, C.; Spoorg, G. Prevention
strategies for field traffic-induced subsoil compaction: A review. Part 1. Machine/soil interactions. Soil and Tillage Research, v.73, p.45-160, 2003. https://doi.org/10.1016/S0167-1987(03)00107-7 Bastiani, F. de; Uribe-Opazo, M. A.; Dalposso, G. H. Comparison
of maps of spatial variability of soil resistance to penetration constructed with and without covariables using a spatial linear model. Engenharia Agrícola, v.32, p.393-404, 2012. https://doi. org/10.1590/S0100-69162012000200019
Beutler, A. N.; Centurion, J. F.; Centurion, M. A. P. C.; Silva, A.
P. Efeito da compactação na produtividade de cultivares de soja em Latossolo Vermelho. Revista Brasileira de Ciência do Solo, v.30, p.787-794, 2006. https://doi.org/10.1590/S0100-06832006000500004
Cardoso, E. J. B. N.; Vasconcellos, R. L. F.; Bini, D.; Miyauchi, M. Y.
H.; Santos, C. A. dos; Alves, P. R. L.; Paula, A. M. de; Nakatani,
A. S.; Pereira, J. de M.; Nogueira, M. A. Soil health: Looking
for suitable indicators. What should be considered to assess the effects of use and management on soil health? Scientia Agrícola, v.70, p.274-289, 2013. https://doi.org/10.1590/S0103-90162013000400009
Cavalieri, K. M. V.; Carvalho, L. A. de; Silva, A. P. da; Libardi, P. L.; Tormena, C. A. Qualidade física de três solos sob colheita mecanizada de cana-de-açúcar. Revista Brasileira de Ciência do Solo, v.35, p.1541-1549, 2011. https://doi.org/10.1590/S0100-06832011000500008
Demattê, J. A. M.; Demattê, J. L. I.; Alves, E. R.; Negrão, R.; Morelli, J. L. Precision agriculture for sugarcane management: A strategy
applied for Brazilian conditions. Acta Scientiarum, v.36, p.111-117, 2014. https://doi.org/10.4025/actasciagron.v36i1.17664 Dexter, A. R.; Watts, C. Tensile strength and friability. In: Smith,
K.; Mullins, C. (eds.) Soil and environmental analysis, physical methods.New York: Marcel Dekker, 2000. p.401-430. https:// doi.org/10.1201/9780203908600.ch11
EMBRAPA - Empresa Brasileira de Pesquisa Agropecuária. Sistema brasileiro de classificação de solos. Rio de Janeiro: Centro
Nacional de Pesquisa de Solos/Embrapa Solos, 2009. 412p. Ferreira, D. F. Sisvar: A computer statistical analysis system.
Ciência e Agrotecnologia, v.5, p.1039-1042, 2011. https://doi. org/10.1590/S1413-70542011000600001
Freire, E. C. Algodão no cerrado do Brasil. 3.ed. Brasília: ABRAPA, 2015. 942p.
Gava, R.; Silva, E. E. da; Baio, F. H. R. Calibração de sensor eletrônico de umidade em diferentes texturas de solo. Brazilian Journal of Biosystems Engineering, v.10, p.154-162, 2016.
Grego, C. R.; Vieira, S. D.; Antonio, A. M.; Della Rosa, S. C. Geostatistical analysis for soil moisture content under the no tillage cropping system. Scientia Agrícola, v.63, p.341-350, 2006. https://doi.org/10.1590/S0103-90162006000400005
Isaaks, E. H.; Srivastava, R. M. An introduction to applied geostatistics. New York: Oxford University Press, 1989. 561p.
Molin, J. P.; Magalhães, R. P. de; Faulin, G. de C. Análise espacial
da ocorrência do índice de cone em área sob semeadura direta. Engenharia Agrícola, v.26, p.442-452, 2006. https://doi. org/10.1590/S0100-69162006000200012
Montanari, R.; Zambianco, E. C.; Corrêa, A. R.; Pellin, D. M. P.; Carvalho, M. P.; Dalchiavon, F. C. Atributos físicos de um Latossolo Vermelho correlacionados linear e espacialmente com a consorciação de guandu com milheto. Revista Ceres, v.59, p.125-135, 2012. https://doi.org/10.1590/S0034-737X2012000100018 Roque, A. A. de O.; Souza, Z. M.; Araujo, F. S.; Silva, G. R. V. da.
Atributos físicos do solo e intervalo hídrico ótimo de um Latossolo Vermelho distrófico sob controle de tráfego agrícola. Ciência Rural, v.41, p.1536-1542, 2011. https://doi.org/10.1590/ S0103-84782011005000117
Silva, A. P.; Tormena, C. A.; Imhoff, S. Intervalo hídrico ótimo. In:
Moraes, M. H.; Müller, M. M. L.; Foloni, J. S. S. Qualidade física
Silva, R. B.; Lanças, K. P.; Miranda, E. E. V.; Silva, F. A. M.; Baio, F. H. R. Estimation and evaluation of dynamic properties as indicators of changes on soil structure in sugarcane fields of São Paulo state – Brazil. Soil and Tillage Research, v.103, p.265-270, 2009. https:// doi.org/10.1016/j.still.2008.10.018
Silva, V. R. da; Reichert, J. M.; Reinert, D. J. Variabilidade espacial
da resistência do solo à penetração em plantio direto. Ciência Rural, v.34, p.399-406, 2004. https://doi.org/10.1590/S0103-84782004000200010
Silveira, D. de C.; Melo Filho, J. F. de; Sacramento, J. A. A. S. do;
Silveira, E. C. P. Relação umidade versus resistência à penetração para um Argissolo amarelo distrocoeso no Recôncavo da Bahia. Revista Brasileira de Ciência do Solo, v.34, p.659-667, 2010. https://doi.org/10.1590/S0100-06832010000300007
Tavares Filho, J.; Ribon, A. A. Resistência do solo à penetração em
resposta ao número de amostras e tipo de amostragem. Revista Brasileira de Ciência do Solo, v.32, p.487-494, 2008. https://doi.
org/10.1590/S0100-06832008000200003
Torres, J. L. R.; Rodrigues Junior, D. J.; Sene, G. A.; Jaime, D. G.; Vieira,
D. M. da S. Resistência à penetração em área de pastagem de
capim tifton, influenciada pelo pisoteio e irrigação. Bioscience
Journal, v.28, sup.1, p.232-239, 2012.
Trangmar, B. B.; Yost, R. S.; Wade, M. K.; Uehara, G. Applications
of geostatistics to spatial studies of soil properties. Advances in