BIOMEDICAL SCIENCES
AND
CLINICAL INVESTIGATION
www.bjournal.com.br
www.bjournal.com.br
Braz J Med Biol Res, May 2012, Volume 45(6) 546-556
doi:
10.1590/S0100-879X2012007500056
Analysis of acylcarnitine profiles in umbilical cord blood and during
the early neonatal period by electrospray ionization tandem mass
spectrometry
E. Vieira Neto, A.A. Fonseca, R.F. Almeida, M.P. Figueiredo, M.A.S. Porto and M.G. Ribeiro
Institutional Sponsors
The Brazilian Journal of Medical and Biological Research is partially financed by
Faculdade de Medicina de Ribeirão Preto Campus
Ribeirão Preto
Explore High - Performance MS Orbitrap Technology In Proteomics & Metabolomics
Analysis of acylcarnitine profiles in umbilical
cord blood and during the early neonatal
period by electrospray ionization tandem
mass spectrometry
E. Vieira Neto
1,2, A.A. Fonseca
2, R.F. Almeida
2, M.P. Figueiredo
3,
M.A.S. Porto
3and M.G. Ribeiro
11Serviço de Genética Médica, Instituto de Puericultura e Pediatria Martagão Gesteira, Universidade Federal do Rio de Janeiro, Rio de Janeiro, RJ, Brasil 2Laboratório Diagnósticos Laboratoriais Especializados, Rio de Janeiro, RJ, Brasil 3Maternidade Escola, Universidade Federal do Rio de Janeiro, Rio de Janeiro, RJ, Brasil
Abstract
Acylcarnitine profiling by electrospray ionization tandem mass spectrometry (ESI-MS/MS) is a potent tool for the diagnosis and screening of fatty acid oxidation and organic acid disorders. Few studies have analyzed free carnitine and acylcarnitines in dried blood spots (DBS) of umbilical cord blood (CB) and the postnatal changes in the concentrations of these analytes. We have investigated these metabolites in healthy exclusively breastfed neonates and examined possible effects of birth weight and gestational age. DBS of CB were collected from 162 adequate for gestational age neonates. Paired DBS of heel-prick blood were collected 4-8 days after birth from 106 of these neonates, the majority exclusively breastfed. Methanol extracts of DBS with deuterium-labeled internal standards were derivatized before analysis by ESI-MS/MS. Most of the analytes were measured using a full-scan method. The levels of the major long-chain acylcarnitines, palmitoylcarnitine, stearoylcarnitine, and oleoylcarnitine, increased by 27, 12, and 109%, respectively, in the first week of life. Free carnitine and acetylcarnitine had a modest increase: 8 and 11%, respectively. Propionylcarnitine presented a different behavior, decreasing 9% during the period. The correlations between birth weight or gestational age and the concentrations of the analytes in DBS were weak (r≤ 0.20) or nonsignificant.
Adaptation to breast milk as the sole source of nutrients can explain the increase of these metabolites along the early neonatal period. Acylcarnitine profiling in CB should have a role in the early detection of metabolic disorders in high-risk neonates.
Key words: Acylcarnitine; Carnitine; Cord blood; Electrospray ionization mass spectrometry; Newborn infants; Reference values
Introduction
Correspondence: E. Vieira Neto, Serviço de Genética Médica, Instituto de Puericultura e Pediatria Martagão Gesteira, Rua Bruno Lobo, 50, 3º andar, 21941-912 Rio de Janeiro, RJ, Brasil. Fax: +55-21-2521-9928. E-mail: [email protected]
Received October 25, 2011. Accepted March 21, 2012. Available online April 13, 2012. Published June 4, 2012.
In plasma and in whole blood, total carnitine is present as free and acylcarnitine ester forms. Long-chain acylcarnitine
esters are generated intracellularly for the transport of fatty
acyl moieties through the mitochondrial inner membrane; in contrast, short- and medium-chain acylcarnitine esters are formed in peroxisomes intended for continuation of oxidation in mitochondria, whereas acylcarnitine esters of various chain lengths are generated in both organelles as a means of modulating the intracellular homeostasis of coenzyme A (1,2).
The determination of free carnitine and acylcarnitine
profiles by electrospray ionization tandem mass spectrom
-etry (ESI-MS/MS) in plasma and dried blood spots (DBS) is aided by the fact that both underivatized and butyl esters of acylcarnitines yield a common product ion with a mass of 85 Da (3). Acylcarnitine profiling is a potent tool for the
diagnosis and neonatal screening of fatty acid oxidation and
and an acceptable false-positive rate, and represent very
high percentiles (e.g., 99.5th or 99.98th), which do not
necessarily indicate reference intervals that can be applied for the diagnosis of symptomatic neonates. Few research investigations have reported more typical percentiles as reference limits (e.g., 5.0th-95.0th) for these metabolites in DBS (8).
Although acylcarnitine profiles for umbilical cord blood (CB) collected on filter paper have the potential to identify infants at risk of disorders with a relatively rapid progression after birth, few studies have established reference ranges
for this clinical specimen (8-11). Moreover, significant differ
-ences are expected to exist between acylcarnitine profiles for CB and those for blood collected from newborn infants after birth due to the adaptation from a continuous supply
of glucose in utero to a neonatal diet based on breast milk,
and consequently to fat as a substantial source of energy (12,13). These peculiarities could limit the value of CB acylcarnitine profiles in the detection of disorders of fatty acid oxidation and organic acid metabolism (11).
In the current study, we established reference intervals for free carnitine and acylcarnitine esters for CB and blood collected during the first few days of life (heel-prick blood, HPB) obtained from term neonates that were exclusively breastfed. The results obtained can be used to infer the effects of breastfeeding on the concentrations of these analytes in the first week of life.
Material and Methods
Study population and blood sample collection
CB was collected from 176 healthy neonates, 96 females and 80 males. The majority of the newborn infants (91%-155/171) were delivered by spontaneous vaginal delivery, while caesarean births and forceps-assisted vaginal births accounted for 8 (13/171) and 2% (3/171) of the deliveries, respectively. The mean (range) gestational age at birth was 39 weeks and 4 days (35 weeks and 5 days-42 weeks and 1 day); three post-term (≥42 weeks) and 6 preterm (<37 weeks) infants, at first incorrectly evaluated as term infants, were excluded from the study. The neonates were categorized as small for gestational age (SGA), average for
gestational age (AGA) or large for gestational age (LGA) if
their birth weight was equal to or below the 2nd percentile, between the 2nd and the 98th percentiles or equal to or above the 98th percentile, respectively, according to the birth weight percentiles provided in the supplemental data
of Oken et al. (14). A total of 163 term neonates were clas
-sified as AGA, 2 as SGA, and 2 as LGA. As the term SGA and LGA neonates were also excluded, our sample at the beginning of the study (CB collection) actually comprised
163 AGA term newborn infants. None of these had a diag
-nosis of birth asphyxia, defined as an Apgar score ≤6 at 5 min. CB samples were taken from vessels of the umbilical cord immediately after delivery and spotted on S&S Grade
903 filter paper (Whatman, UK), allowed to air dry for at least 4 h and stored in opaque envelopes at room temperature. As one CB sample was refused due to improper collection, it was possible to analyze 162 CB samples.
A second blood sample was prospectively collected by heel prick on day 4-8 from 106 neonates, and processed as CB samples. At this time, mothers were questioned about
feeding practices, which were categorized according to the
WHO definitions. Mothers reported exclusive breastfeeding for 99 newborn infants, while seven women stated partial breastfeeding, having introduced infant formula to their newborns.
Ethics approval and informed consent
The study was approved by the Research Ethics Review Committee of “Instituto de Puericultura e Pediatria Martagão
Gesteira, Universidade Federal do Rio de Janeiro - UFRJ”,
and was performed in accordance with Brazilian Guidelines and Regulating Norms on Research Involving Human Subjects and the Helsinki Declaration of 1975 as revised in 1996. Written informed consent was obtained from the mothers of all newborn infants.
Solvents, reagents and internal standards
The reagents used included HPLC grade methanol and analytical grade acetic acid from Vetec (Brazil). HPLC grade acetonitrile was purchased from Tedia (USA) and 3 N HCl in n-butanol was purchased from Regis Technologies (USA).
The deuterium-labeled free carnitine and L-acylcarnitines
used as internal standards were purchased from Cambridge Isotope Laboratories (USA).
Sample preparation
Sample preparation was based on previously reported methods (5-7,15). A single 3-mm diameter DBS (1/8 inch) was placed in a well of a 96-well microtiter polystyrene plate (Sarstedt, USA), followed by the addition of 90 µL of a methanol/water (3:1; v/v) extraction solution containing
the deuterium-labeled internal standards. The concentra
-tions of these standards were as follows: [2H9]-carnitine
(2H9-C0), 0.76 µM; [2H3]-acetylcarnitine (2H3-C2), 0.19
µM; [2H
3]-propionylcarnitine, (2H3-C3), 0.038 µM; [2H3
]-butyrylcarnitine (2H
3-C4), 0.038 µM; [2H9
]-isovalerylcarni-tine (2H9-C5), 0.038 µM; [2H3]-octanoylcarnitine (2H3-C8),
0.038 µM; [2H3]-myristoylcarnitine (2H3-C14), 0.038 µM;
[2H3]-palmitoylcarnitine (2H3-C16), 0.076 µM. The microtiter
plate was covered with sealing film and incubated for 30 min at 27°C with shaking at 750 rpm in an NCS incubator (Perkin Elmer, Finland). After seal removal, aliquots of the
sample extracts (60 µL) were transferred to a polypropyl
-ene microtiter plate (USA Scientific, USA) and evaporated to dryness under synthetic air in a Micro-DS 96 sample concentrator (Porvair Sciences, UK). HCl in n-butanol (50
µL of a 3 N solution) was added to each sample well. Sub
for 30 min at 60°C to achieve acylcarnitine derivatization. After the n-butanol derivatization, the solution was again evaporated to dryness in the sample concentrator. Finally, the samples were reconstituted with 75 µL acetonitrile-water (80:20, v/v) with 0.1% acetic acid, and the plate was covered with aluminum foil. The plate was then ready for ESI-MS/MS analysis after shaking at 750 rpm for 10 min at 27°C. Samples were generally prepared and analyzed within 2-3 days from collection.
Mass spectrometry
An API 2000 triple-quadrupole tandem mass spectrom
-eter (PE Sciex, Canada) operated in positive ion mode was used for acylcarnitine analysis. The system included also a Perkin Elmer series 200 autosampler and a Perkin Elmer series 200 liquid chromatography pump that were employed to transfer 10 µL of each sample directly into the ion spray probe at a solvent flow rate of 70 µL/min.
Acylcarnitines were analyzed by the precursor-ion scan of m/z 85 mode and scanning from m/z 200 to 550. Additionally, free carnitine (C0), acetylcarnitine (C2), and propionylcarnitine (C3) and their respective deuterium-labeled internal standards were analyzed in the multiple reaction monitoring (MRM) mode as recommended by Chace et al. (15) and by the directions for use of Perkin-Elmer’s NeoGram amino acid and acylcarnitine tandem mass spectrometry kit (Perkin Elmer). The MRM transitions used in the analyses were from the n-butanol derivatized molecular ions of m/z 218, 227, 260, 263, 274, and 277 for
C0, 2H9-C0, C2, 2H3-C2, C3, and 2H3-C3, respectively, to
the product ion of m/z 103 for C0 and 2H9-C0 and m/z 85
for the other analytes.
The concentrations of free carnitine and acylcarnitines were calculated with the NeoGram software (Perkin Elmer) by comparing the measured analyte intensities to those of
the internal standards. Data on linearity, functional sensitiv
-ity, reproducibil-ity, recovery, interference, carryover, and drift for the mass spectrometry method used in this study were
presented by the manufacturer to the Food and Drug Ad
-ministration (FDA), and are available at the agency website [http://www.fda.gov/ohrms/dockets/dockets/04n0482/04n-0482-bkg00001-vol1.pdf].
Statistical analysis
The Shapiro-Wilk test was used to assess whether the distributions of free carnitine and the acylcarnitine esters were normal. The Wilcoxon signed rank test was used to investigate significant differences in the distributions of the analytes in CB and HPB. Correlations between birth weight
or gestational age and free carnitine or the various
acyl-carnitine ester concentrations in CB and HPB were tested by the Spearman correlation test. The level of significance
was set at 0.05 in all statistical tests. Statistical analysis
was performed using the Stata 9.1 software package (StataCorp, USA).
Results
Distribution of analyte concentrations
The distributions of the concentrations of free carnitine and the various acylcarnitines in CB and in HPB were not normal, as indicated by the results of the Shapiro-Wilk W test for normality. The quantitatively major acylcarnitines in CB and HPB were the short-chain acylcarnitines C2 and C3, and the long-chain acylcarnitines palmitoylcarnitine (C16), stearoylcarnitine (C18), and oleoylcarnitine (C18:1). The acylcarnitine ester profile of CB differed slightly from that of HPB of 4- to 8-day-old infants in that the peak for C3 was relatively larger and those for the predominant long-chain acylcarnitines less significant. In addition, the order of concentration for the latter in CB, C16 > C18 > C18:1, differed from that found in HPB, C16 > C18:1 > C18 (see Figure 1).
Box-plots for free carnitine and the predominant acyl
-carnitines are shown in Figure 2.
Descriptive statistics and reference intervals
Descriptive statistics and reference intervals in CB and
HPB for free carnitine, short-chain, and medium-chain acyl
-carnitines are summarized in Table 1. Similar parameters are summarized in Table 2 for long-chain acylcarnitines and the acylcarnitine esters derived from dicarboxylic acids, and in
Table 3 for those derived from hydroxylated acids. Consider
-ing our sample size, we defined the limits of the reference intervals between the 2.5th and 97.5th percentiles, but the lower 2.5th percentile limit is devoid of clinical interest in most instances, with the exception of free carnitine and C2 for the diagnosis of primary systemic carnitine deficiency
(16), and C16 and C18 for the diagnosis of carnitine palmi
-toyltransferase I (CPT I) deficiency (17).
The levels of the quantitatively major long-chain acyl
-carnitines (C16, C18, C18:1) increased significantly in the first week of life - increase of the median: 27% (P < 0.0001), 12% (P = 0.0196), and 109% (P < 0.0001), respectively (Table 2). Free carnitine and C2 medians had a modest increase, which was nevertheless statistically significant: 8% (P = 0.0327) and 11% (P < 0.0001), respectively (Table 1). C3 presented a different behavior, decreasing 9% (P = 0.0022) in the period (Table 1).
The differences between the medians of the concen
-trations in CB and HPB of the majority of quantitatively minor short-chain acylcarnitines (Table 1), medium-chain
acylcarnitines (Table 1), quantitatively minor long-chain acyl
-carnitines (Table 2), and of acylcarnitine esters derived from dicarboxylic (Table 2) and hydroxylated acids (Table 3) were significant when evaluated by Wilcoxon’s signed rank test. Similar to the quantitatively major acylcarnitine esters (C2, C3, C16, C18, C18:1), they tended to increase during the first
week of life. The exceptions were 3-hydroxyisovalerylcarni
Figure 1. Acylcarnitine ester profiles obtained by a precursor of m/z 85 scan from dried blood spots
(DBS) of a newborn infant. A, DBS of a whole cord blood (CB) sample. B, DBS of a heel-prick blood
(HPB) sample collected on day 5 of life. Note that in HPB the peaks corresponding to long-chain acylcarnitines are more prominent than in CB. Stearoylcarnitine, C18 (m/z 484), appears as a larger peak than oleoylcarnitine, C18:1 (m/z 482), in CB. The reverse is true in HPB. The peak for
pro-pionylcarnitine, C3 (m/z 274), is usually larger in CB. Stable isotope-labeled acylcarnitine internal
standards are identified by the number of deuterium atoms (d3 or d9). *Artifactual peak.
A
(C14:2), 3-hydroxyhexadecenoylcarnitine (C16:1OH), and linoleylcarnitine (C18:2), whose median concentrations in CB and HPB did not show significant differences.
Correlations between birth weight or gestational age and the analyte concentrations
For our sample of AGA term newborn infants, the correlations between birth weight or gestational age and
the concentrations of free carnitine or the various
acyl-carnitine esters were very weak (r≤ 0.20) for all analytes
in CB, and in most instances the correlations were also nonsignificant, P > 0.05 (see supplemental data, Table 1).
The exceptions were the significant (P ≤ 0.05) albeit very
weak correlations found in CB between birth weight and
3-hydroxybutyrylcarnitine, C4OH (r = -0.1689; P = 0.0327),
3-hydroxytetradecanoylcarnitine, C14OH (r = 0.1684; P =
0.0333), and 3-hydroxyoctadecenoylcarnitine, C18:1OH
(r = -0.1625; P = 0.0333), and between gestational age
and C4OH (r = -0.1602; P = 0.0479), isovalerylcarnitine,
C5 (r = 0.1638; P = 0.0430), and hexanoylcarnitine, C6 (r
= -0.1912; P = 0.0179).
In HPB, although the correlations between birth weight or gestational age and the majority of the analytes were also very weak and non-significant (see supplemental data, Table
2), few acylcarnitine ester concentrations in HPB showed
weak (0.20 < r≤ 0.40) and significant correlations with birth
weight as follows: C3 (r = 0.2099; P = 0.0316), C4OH (r =
0.2464; P = 0.0113), 3-hydroxydodecanoylcarnitine, C12OH
(r = 0.2511; P = 0.0098), and hexadecenoylcarnitine, C16:1
(r = 0.2072; P = 0.0340). In turn, C14OH (r = 0.2202; P =
0.0277) and tetradecadienoylcarnitine, C14:2 (r = 0.2852;
P = 0.0040), in HPB showed a weak and significant cor
-relation with gestational age.
Discussion
Few studies have described reference limits for free carnitine and acylcarnitine esters in CB by ESI-MS/MS
(8,9,11,18-22). In these studies, however, different
speci-mens were used in the analyses. As done in the present study, three of them used DBS of whole CB in order to obtain a full carnitine and acylcarnitine profile (8,9,11). On the other hand, Talián et al. (18) employed dried cord plasma spotted on filter paper cards. Osorio and Pourfarzam (20) favored this specimen for the analysis of total and free carnitine but turned to DBS of whole CB in order to obtain the full acylcarnitine profile (19). Chace et al. (21) compared the results for total and free carnitine in whole cord blood and plasma, both spotted on filter paper. Table 4 compares the concentrations of free carnitine and major acylcarnitines reported by these various investigators to those obtained
in the present study.
There is no consensus concerning the clinical speci
-men (plasma, erythrocytes, or whole blood) that would best reflect the carnitine status of various body compartments of newborn infants, justifying its exclusive recommendation for the detection of eventual carnitine metabolism disorders
in this population (23).
Various methods have been reported for the analysis of free carnitine and acylcarnitines in clinical specimens,
including fast atom bombardment tandem mass spec
-trometry (FAB-MS/MS) (24), radioisotopic exchange-high-performance liquid chromatography (RIE-HPLC) (25), and gas chromatography-mass spectrometry (GC-MS) (26). In the case of acylcarnitine profiling by RIE-HPLC, the method exploits the selectivity of carnitine acetyltransferase (CAT) to label acylcarnitines with a radioactive marker. However,
Figure 2. Box-plots of the concentrations of free carnitine and the predominant acylcarnitines in dried blood spots of cord blood and heel-prick blood collected from 4- to 8-day-old newborns. A, Free carnitine (C0) and
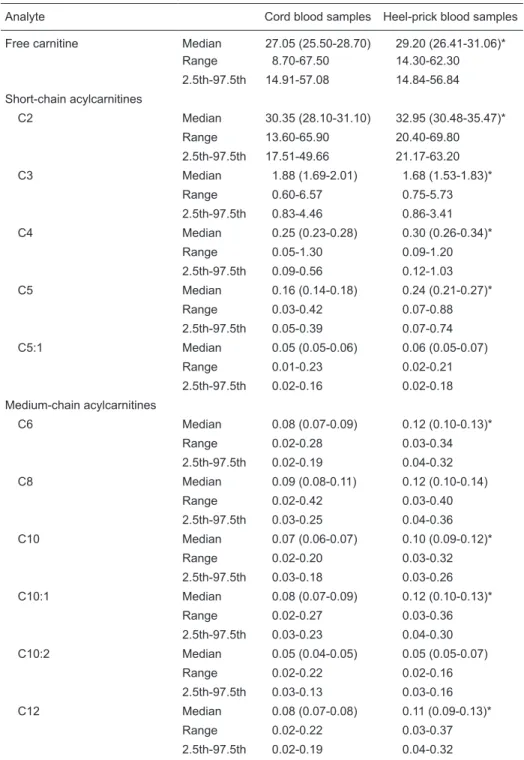
Table 1. Concentrations of free carnitine and short-chain and medium-chain acylcarnitines in 162 cord blood samples and 106 paired heel-prick blood samples obtained 4-8 days after birth from healthy adequate for gestational age term newborn infants.
Analyte Cord blood samples Heel-prick blood samples
Free carnitine Median 27.05 (25.50-28.70) 29.20 (26.41-31.06)*
Range 8.70-67.50 14.30-62.30
2.5th-97.5th 14.91-57.08 14.84-56.84
Short-chain acylcarnitines
C2 Median 30.35 (28.10-31.10) 32.95 (30.48-35.47)*
Range 13.60-65.90 20.40-69.80
2.5th-97.5th 17.51-49.66 21.17-63.20
C3 Median 1.88 (1.69-2.01) 1.68 (1.53-1.83)*
Range 0.60-6.57 0.75-5.73
2.5th-97.5th 0.83-4.46 0.86-3.41
C4 Median 0.25 (0.23-0.28) 0.30 (0.26-0.34)*
Range 0.05-1.30 0.09-1.20
2.5th-97.5th 0.09-0.56 0.12-1.03
C5 Median 0.16 (0.14-0.18) 0.24 (0.21-0.27)*
Range 0.03-0.42 0.07-0.88
2.5th-97.5th 0.05-0.39 0.07-0.74
C5:1 Median 0.05 (0.05-0.06) 0.06 (0.05-0.07)
Range 0.01-0.23 0.02-0.21
2.5th-97.5th 0.02-0.16 0.02-0.18 Medium-chain acylcarnitines
C6 Median 0.08 (0.07-0.09) 0.12 (0.10-0.13)*
Range 0.02-0.28 0.03-0.34
2.5th-97.5th 0.02-0.19 0.04-0.32
C8 Median 0.09 (0.08-0.11) 0.12 (0.10-0.14)
Range 0.02-0.42 0.03-0.40
2.5th-97.5th 0.03-0.25 0.04-0.36
C10 Median 0.07 (0.06-0.07) 0.10 (0.09-0.12)*
Range 0.02-0.20 0.03-0.32
2.5th-97.5th 0.03-0.18 0.03-0.26
C10:1 Median 0.08 (0.07-0.09) 0.12 (0.10-0.13)*
Range 0.02-0.27 0.03-0.36
2.5th-97.5th 0.03-0.23 0.04-0.30
C10:2 Median 0.05 (0.04-0.05) 0.05 (0.05-0.07)
Range 0.02-0.22 0.02-0.16
2.5th-97.5th 0.03-0.13 0.03-0.16
C12 Median 0.08 (0.07-0.08) 0.11 (0.09-0.13)*
Range 0.02-0.22 0.03-0.37
2.5th-97.5th 0.02-0.19 0.04-0.32
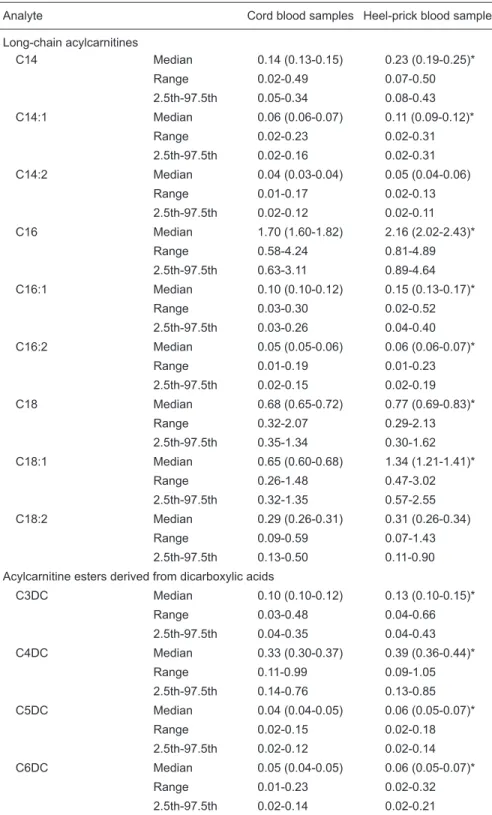
Table 2. Concentrations of long-chain acylcarnitines and acylcarnitine esters derived from dicar-boxylic acids in 162 cord blood samples and 106 paired heel-prick blood samples obtained 4-8 days after birth from healthy adequate for gestational age term newborn infants.
Analyte Cord blood samples Heel-prick blood samples
Long-chain acylcarnitines
C14 Median 0.14 (0.13-0.15) 0.23 (0.19-0.25)*
Range 0.02-0.49 0.07-0.50
2.5th-97.5th 0.05-0.34 0.08-0.43
C14:1 Median 0.06 (0.06-0.07) 0.11 (0.09-0.12)*
Range 0.02-0.23 0.02-0.31
2.5th-97.5th 0.02-0.16 0.02-0.31
C14:2 Median 0.04 (0.03-0.04) 0.05 (0.04-0.06)
Range 0.01-0.17 0.02-0.13
2.5th-97.5th 0.02-0.12 0.02-0.11
C16 Median 1.70 (1.60-1.82) 2.16 (2.02-2.43)*
Range 0.58-4.24 0.81-4.89
2.5th-97.5th 0.63-3.11 0.89-4.64
C16:1 Median 0.10 (0.10-0.12) 0.15 (0.13-0.17)*
Range 0.03-0.30 0.02-0.52
2.5th-97.5th 0.03-0.26 0.04-0.40
C16:2 Median 0.05 (0.05-0.06) 0.06 (0.06-0.07)*
Range 0.01-0.19 0.01-0.23
2.5th-97.5th 0.02-0.15 0.02-0.19
C18 Median 0.68 (0.65-0.72) 0.77 (0.69-0.83)*
Range 0.32-2.07 0.29-2.13
2.5th-97.5th 0.35-1.34 0.30-1.62
C18:1 Median 0.65 (0.60-0.68) 1.34 (1.21-1.41)*
Range 0.26-1.48 0.47-3.02
2.5th-97.5th 0.32-1.35 0.57-2.55
C18:2 Median 0.29 (0.26-0.31) 0.31 (0.26-0.34)
Range 0.09-0.59 0.07-1.43
2.5th-97.5th 0.13-0.50 0.11-0.90
Acylcarnitine esters derived from dicarboxylic acids
C3DC Median 0.10 (0.10-0.12) 0.13 (0.10-0.15)*
Range 0.03-0.48 0.04-0.66
2.5th-97.5th 0.04-0.35 0.04-0.43
C4DC Median 0.33 (0.30-0.37) 0.39 (0.36-0.44)*
Range 0.11-0.99 0.09-1.05
2.5th-97.5th 0.14-0.76 0.13-0.85
C5DC Median 0.04 (0.04-0.05) 0.06 (0.05-0.07)*
Range 0.02-0.15 0.02-0.18
2.5th-97.5th 0.02-0.12 0.02-0.14
C6DC Median 0.05 (0.04-0.05) 0.06 (0.05-0.07)*
Range 0.01-0.23 0.02-0.32
2.5th-97.5th 0.02-0.14 0.02-0.21
long-chain acylcarnitines and dicarboxylic acylcarnitines are not good substrates for CAT, limiting the application of this method
(25). Acylcarnitines are charged, polar, and
nonvolatile compounds, therefore they are not good candidates for GC-MS techniques, requiring complex derivatization reactions
under forced conditions (27).
FAB-MS/MS was introduced by Millington et al. (24) for acylcarnitine detection. This
method allowed the metabolic profiling of acyl
-carnitines from plasma and DBS, as a result of the significant improvement in sensitivity that
was achieved (27). Moreover, with the use of
continuous flow FAB (CF-FAB), analysis time was significantly reduced. ESI-MS/MS, the method employed in the present study, was initially proposed by Rashed et al. (27,28) as a more robust and sensitive alternative technique to FAB-MS/MS for acylcarnitine profiling in DBS. ESI-MS/MS does not require frequent instrument cleaning and permits higher flow rates than CF-FAB, rendering the method suitable for automation and high sample throughput.
Derivatized ESI-MS/MS assays are em
-ployed by the majority of newborn screening
laboratories around the world, but it is pos
-sible to detect acylcarnitines as their native free acids by underivatized methods. These latter methods have the disadvantage of not differentiating some isobaric acylcarnitines and of eliciting a less intense response from dicarboxylic acid acylcarnitines (29).
It is useful to compare our finding of a sig
-nificant although modest 8% increase in free carnitine concentration in the first week of life to the results of other investigators. Meyburg et al. (9) and Cavedon et al. (8) found that
free carnitine concentrations remained un
-changed in the first days of life by comparing CB samples to paired samples from 5-day-old
infants or to unpaired samples from 3- to-6-day-old infants, respectively. In turn, Chace et al. (21) found that free carnitine levels in CB samples from a small cohort of 50 full-term newborns were 48% lower than the levels in HPB from a large cohort (N = 24,644) of 2 ± 1-day-old infants. The huge difference in sample size between the two cohorts precludes any further interpretation. Wilcken et al. (16) found a small (3.4%) increase in median free carnitine levels in the neonatal population from 26.6 µM at day 2 (N = 13,311) to 27.5 µM at day 5-8 (N = 5.546). Therefore, our results agree with the finding from this large-scale study of a small
increase in free carnitine levels during the early neonatal
period. Table 5 summarizes the findings of the studies that
compared the concentrations of free carnitine for at least two time points during the early neonatal period.
Possibly the fraction of exclusively breastfed newborn infants has a great impact on free carnitine levels during this
period, since there is an increased carnitine concentration
in human milk during the first two weeks after delivery (30) and the bioavailability of human milk carnitine is superior to that of cow milk or cow milk protein-based infant formula
(12,31).
In contrast, similar to the studies of Meyburg et al. (9) and Cavedon et al. (8), we found lower concentrations of almost all acylcarnitines in CB when compared to HPB obtained from the same newborn infants when they were
Table 3. Concentrations of acylcarnitine esters derived from hydroxylated acids in 162 cord blood samples and 106 paired heel-prick blood samples obtained 4-8 days after birth from healthy adequate for gestational age term newborn infants.
Analyte Cord blood samples Heel-prick blood samples
C4OH Median 0.16 (0.14-0.18) 0.26 (0.21-0.29)*
Range 0.04-0.65 0.04-0.83
2.5th-97.5th 0.05-0.40 0.08-0.67
C5OH Median 0.18 (0.16-0.19) 0.19 (0.17-0.20)
Range 0.03-0.70 0.08-0.50
2.5th-97.5th 0.07-0.39 0.09-0.44
C12OH Median 0.03 (0.03-0.04) 0.05 (0.04-0.06)*
Range 0.01-0.11 0.01-0.18
2.5th-97.5th 0.02-0.09 0.02-0.15
C14OH Median 0.04 (0.03-0.04) 0.04 (0.04-0.05)*
Range 0.01-0.13 0.02-0.13
2.5th-97.5th 0.02-0.09 0.02-0.11
C16OH Median 0.04 (0.03-0.04) 0.05 (0.04-0.06)*
Range 0.01-0.12 0.01-0.15
2.5th-97.5th 0.02-0.09 0.02-0.13
C16:1OH Median 0.07 (0.06-0.07) 0.07 (0.06-0.08)
Range 0.02-0.18 0.02-0.20
2.5th-97.5th 0.02-0.16 0.02-0.19
C18OH Median 0.03 (0.02-0.03) 0.04 (0.03-0.04)*
Range 0.01-0.10 0.01-0.12
2.5th-97.5th 0.01-0.08 0.02-0.10
C18:1OH Median 0.03 (0.03-0.03) 0.04 (0.04-0.05)*
Range 0.01-0.15 0.01-0.19
2.5th-97.5th 0.01-0.10 0.02-0.11
C18:2OH Median 0.10 (0.09-0.11) 0.13 (0.11-0.14)*
Range 0.03-0.32 0.04-0.36
2.5th-97.5th 0.04-0.23 0.04-0.26
4 to 8 days old (paired samples, see Figures 1 and 2). This finding could be attributed to the low plasma lipid levels at birth due to a limited fatty acid transfer across the human
placenta (32). Moreover, the increase in the levels of several
acylcarnitines in the early neonatal period is a consequence of the process of adaptation to breast milk as the sole source
of nutrients and energy, with its large concentration of fatty
acids, primarily derived from triglycerides, which account for 35-50% of the total daily energy supply of the newborn infant (33). Further support of this assumption is the fact that the predominant long-chain acylcarnitines in the early neonatal period, C16 and especially C18:1 (see Figures 1 and 2), are the acylcarnitine esters of the quantitatively major fatty acids in breast milk, palmitic (16:0) and oleic
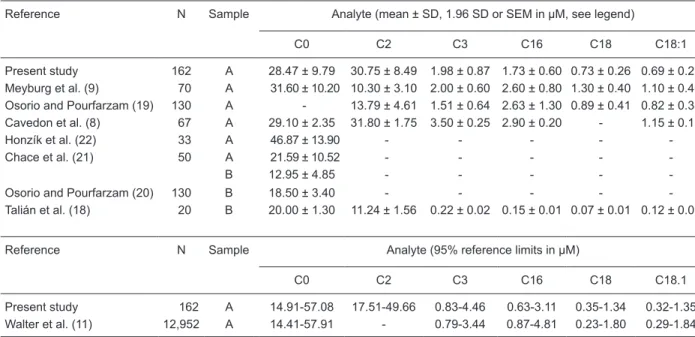
Table 4. Concentrations of free carnitine and major acylcarnitines in cord blood samples reported in the literature compared with those obtained in the present study.
Reference N Sample Analyte (mean ± SD, 1.96 SD or SEM in µM, see legend)
C0 C2 C3 C16 C18 C18:1
Present study 162 A 28.47 ± 9.79 30.75 ± 8.49 1.98 ± 0.87 1.73 ± 0.60 0.73 ± 0.26 0.69 ± 0.25 Meyburg et al. (9) 70 A 31.60 ± 10.20 10.30 ± 3.10 2.00 ± 0.60 2.60 ± 0.80 1.30 ± 0.40 1.10 ± 0.40 Osorio and Pourfarzam (19) 130 A - 13.79 ± 4.61 1.51 ± 0.64 2.63 ± 1.30 0.89 ± 0.41 0.82 ± 0.38
Cavedon et al. (8) 67 A 29.10 ± 2.35 31.80 ± 1.75 3.50 ± 0.25 2.90 ± 0.20 - 1.15 ± 0.13
Honzík et al. (22) 33 A 46.87 ± 13.90 - - - -
-Chace et al. (21) 50 A 21.59 ± 10.52 - - - -
-B 12.95 ± 4.85 - - - -
-Osorio and Pourfarzam (20) 130 B 18.50 ± 3.40 - - - -
-Talián et al. (18) 20 B 20.00 ± 1.30 11.24 ± 1.56 0.22 ± 0.02 0.15 ± 0.01 0.07 ± 0.01 0.12 ± 0.01
Reference N Sample Analyte (95% reference limits in µM)
C0 C2 C3 C16 C18 C18.1
Present study 162 A 14.91-57.08 17.51-49.66 0.83-4.46 0.63-3.11 0.35-1.34 0.32-1.35
Walter et al. (11) 12,952 A 14.41-57.91 - 0.79-3.44 0.87-4.81 0.23-1.80 0.29-1.84
The data for most studies, including the present one, are reported as means ± SD, while for Cavedon et al. (8) they are means ± 1.96 SD (95% confidence interval), and for Talián et al. (18), means ± SEM. N = total number of samples. A = whole cord blood spotted on
filter paper; B = cord blood plasma spotted on filter paper.
Table 5. Variations in the concentrations of free carnitine detected in studies that compared at least two time points during the early neonatal period.
Reference N Cord blood 2nd sample (age in days) N Heel-prick blood
Present study 162 27.05 (15.73-47.27)‡ 4-8 106 29.20 (15.91-53.72)‡†
Meyburg et al. (9) 70 31.60 ± 10.20§ 5 70 30.60 ± 10.60§
Wilcken et al. (16) 13,311 26.60 (14.00-52.00)a‡ 5-8 5,546 27.50 (14.30-49.60)‡††
Chace et al. (21) 50 21.59 ± 10.52§ 2 ± 1§ 24,644 46.85 ± 21.19§††
Cavedon et al. (8) 67 29.10 (26.80-31.50)¶ 3-6 117 29.40 (27.60-31.20)¶
(18:1ω9) acids, which comprise 35-70% of breast milk total fatty acids (34). Conversely, the quantitatively major acylcarnitines in CB, C16 and C18 (see Figures 1 and 2), correspond to the predominance of palmitic (16:0) and stearic (18:0) acids in the fraction of nonesterified fatty acids in maternal blood and CB (32).
Propionylcarnitine (C3) behaved differently as its median concentration in CB was significantly higher than that in HPB (see Figure 2). Cavedon et al. (8) obtained similar results, although comparing unpaired samples. Meyburg et al. (9), in contrast, showed an increase in mean C3 concentration in paired HPB samples from 5-day-old newborn infants when compared to CB samples. Walter et al. (11), in a large-scale cohort study, found many newborn infants with very high C3 levels in CB that decreased to normal levels when a second newborn screening sample was collected. We also observed the presence of extreme outliers of C3 concentration in CB samples (see Figure 2).
There are some case series reports indicating the clini
-cal utility of free carnitine and acylcarnitine ester profile in CB for the selective screening of high-risk newborn infants immediately after birth. Patterson et al. (35) reported a case of isovaleric acidemia and two cases of medium-chain acyl-coenzyme A dehydrogenase deficiency (MCADD) in newborn infants with a positive family history that were
diagnosed by abnormalities in relevant acylcarnitine spe
-cies in CB. They also ruled out the diagnosis of MCADD in four other high-risk newborn infants whose C8 levels in CB were found to be normal. Nassogne et al. (36) reported the diagnosis of CPT II deficiency in a newborn sibling of an affected proband by an acylcarnitine ester profile of CB. An increase of long-chain acylcarnitines from C12 to C18 was demonstrated in CB while the organic acid profile of the first urine samples did not show any alteration. Isackson et al. (37) described a newborn infant along with other four patients, whose prior sibling had died at birth, who presented significant elevations in long-chain CB acylcarnitines and a
clinical course consistent with the severe, lethal neonatal
form of CPT II deficiency, confirmed by CPT II assay in cul
-tured skin fibroblasts and genomic DNA analysis. Yokoi et al. (38) reported a Japanese neonate with holocarboxylase
synthetase deficiency and a positive family history who had received prenatal administration of biotin from 33 weeks’ gestation and whose serum cord blood sample showed elevated C3 and C5OH levels.
Since CB can reflect changes in maternal blood rather than the baby’s situation, acylcarnitine analysis in CB has
revealed maternal metabolic disease in completely asymp
-tomatic or vaguely symp-tomatic mothers (10,11). Vijay et al. (10) reported the identification of four unrelated women from consanguineous families of Asian origin discovered to have primary systemic carnitine deficiency as a consequence of finding low free carnitine concentrations in CB or HPB samples from their infants. Santos et al. (39) diagnosed MCADD in a woman who presented acute fatty liver at the 39th week of pregnancy and whose unaffected infant was identified with high C8 levels in CB. Interestingly, in both reports the abnormal results were initially attributed to metabolic disorders affecting the newborn infants, but the detection of normal profiles in follow-up samples made the authors turn their attention to the babies’ mothers.
These reports demonstrate that the collection of CB at the time of delivery for the analysis of free carnitine and acylcarnitines can be appropriate for the selective screening of high-risk newborn infants, including those with a family history of affected siblings, perinatal or neonatal death, or
who are offspring of consanguineous marriages or of moth
-ers affected by acute fatty liver. This is especially true in the Brazilian scenario where newborn screening, although currently established to be undertaken at 3-7 days, shows a poor timeliness in many Brazilian states (40), which is unacceptable for the purpose of selective screening of high-risk newborn infants.
Acknowledgments
The authors thank Mr. Victor R. De Jesus from the Centers for Disease Control and Prevention, Atlanta, for revising the English language of the manuscript, Ms. Cecilia Pessanha Lima for valuable guidance with the statistical analyses and Mr. Osman L. Perdigão for technical support in sample preparation and mass spectrometry analysis.
References
1. Ramsay RR, Gandour RD, van der Leij FR. Molecular enzymol -ogy of carnitine transfer and transport. Biochim Biophys Acta
2001; 1546: 21-43.
2. Steiber A, Kerner J, Hoppel CL. Carnitine: a nutritional, biosyn -thetic, and functional perspective. Mol Aspects Med 2004; 25: 455-473.
3. Chace DH, Kalas TA, Naylor EW. The application of tandem mass spectrometry to neonatal screening for inherited disorders of intermediary metabolism. Annu Rev Genomics Hum Genet
2002; 3: 17-45.
4. Carpenter KH, Wiley V. Application of tandem mass spectrom
-etry to biochemical genetics and newborn screening. Clin Chim Acta 2002; 322: 1-10.
5. Zytkovicz TH, Fitzgerald EF, Marsden D, Larson CA, Shih VE, Johnson DM, et al. Tandem mass spectrometric analysis for amino, organic, and fatty acid disorders in newborn dried blood spots: a two-year summary from the New England Newborn Screening Program. Clin Chem 2001; 47: 1945-1955. 6. Schulze A, Lindner M, Kohlmuller D, Olgemoller K, Mayatepek
2003; 111: 1399-1406.
7. Rashed MS, Bucknall MP, Little D, Awad A, Jacob M, Alamoudi M, et al. Screening blood spots for inborn errors of metabolism by electrospray tandem mass spectrometry with a microplate batch process and a computer algorithm for automated flagging of abnormal profiles. Clin Chem 1997; 43: 1129-1141. 8. Cavedon CT, Bourdoux P, Mertens K, Van Thi HV, Herremans
N, de Laet C, et al. Age-related variations in acylcarnitine and free carnitine concentrations measured by tandem mass spec-trometry. Clin Chem 2005; 51: 745-752.
9. Meyburg J, Schulze A, Kohlmueller D, Linderkamp O, Mayate-pek E. Postnatal changes in neonatal acylcarnitine profile.
Pediatr Res 2001; 49: 125-129.
10. Vijay S, Patterson A, Olpin S, Henderson MJ, Clark S, Day C, et al. Carnitine transporter defect: diagnosis in asymptomatic adult women following analysis of acylcarnitines in their newborn infants. J Inherit Metab Dis 2006; 29: 627-630.
11. Walter JH, Patterson A, Till J, Besley GT, Fleming G, Henderson MJ. Bloodspot acylcarnitine and amino acid analysis in cord blood samples: efficacy and reference data from a large cohort study. J Inherit Metab Dis 2009; 32: 95-101.
12. de Rooy L, Hawdon J. Nutritional factors that affect the postnatal metabolic adaptation of full-term small- and large-for-gestation-al-age infants. Pediatrics 2002; 109: E42.
13. Girard J. Metabolic adaptations to change of nutrition at birth.
Biol Neonate 1990; 58 (Suppl 1): 3-15.
14. Oken E, Kleinman KP, Rich-Edwards J, Gillman MW. A nearly continuous measure of birth weight for gestational age using a United States national reference. BMC Pediatr 2003; 3: 6. 15. Chace DH, DiPerna JC, Mitchell BL, Sgroi B, Hofman LF, Naylor
EW. Electrospray tandem mass spectrometry for analysis of acylcarnitines in dried postmortem blood specimens collected at autopsy from infants with unexplained cause of death. Clin Chem 2001; 47: 1166-1182.
16. Wilcken B, Wiley V, Sim KG, Carpenter K. Carnitine transporter defect diagnosed by newborn screening with electrospray tan-dem mass spectrometry. J Pediatr 2001; 138: 581-584. 17. Fingerhut R, Roschinger W, Muntau AC, Dame T, Kreischer J,
Arnecke R, et al. Hepatic carnitine palmitoyltransferase I defi-ciency: acylcarnitine profiles in blood spots are highly specific.
Clin Chem 2001; 47: 1763-1768.
18. Talián GC, Komlósi K, Decsi T, Koletzko B, Melegh B. Determi-nation of carnitine ester patterns during the second half of preg-nancy, at delivery, and in neonatal cord blood by tandem mass spectrometry: complex and dynamic involvement of carnitine in the intermediary metabolism. Pediatr Res 2007; 62: 88-92. 19. Osorio JH, Pourfarzam M. [Early diagnosis of neurometabolic
diseases by tandem mass spectrometry. Acylcarnitine profile from cord blood]. Rev Neurol 2004; 38: 11-16.
20. Osorio JH, Pourfarzam M. Carnitina libre y total en sangre de cordón umbilical. Rev Colomb Obstet Ginecol 2002; 53: 335-340.
21. Chace DH, Pons R, Chiriboga CA, McMahon DJ, Tein I, Naylor EW, et al. Neonatal blood carnitine concentrations: normative data by electrospray tandem mass spectometry. Pediatr Res
2003; 53: 823-829.
22. Honzík T, Chrastina R, Hansíková H, Böhm M, Martincová O, Plavka R, et al. Carnitine concentrations in term and preterm newborns at birth and during the first days of life. Prague Med Rep 2005; 106: 297-306.
23. Crill CM, Helms RA. The use of carnitine in pediatric nutrition.
Nutr Clin Pract 2007; 22: 204-213.
24. Millington DS, Norwood DL, Kodo N, Roe CR, Inoue F. Applica-tion of fast atom bombardment with tandem mass spectrometry and liquid chromatography/mass spectrometry to the analysis of acylcarnitines in human urine, blood, and tissue. Anal Biochem
1989; 180: 331-339.
25. Schmidt-Sommerfeld E, Zhang L, Bobrowski PJ, Penn D. Quan-titation of short- and medium-chain acylcarnitines in plasma by radioisotopic exchange/high-performance liquid chromatogra-phy. Anal Biochem 1995; 231: 27-33.
26. Lowes S, Rose ME, Mills GA, Pollitt RJ. Identification of urinary acylcarnitines using gas chromatography-mass spectrometry: preliminary clinical applications. J Chromatogr 1992; 577: 205-214.
27. Rashed MS, Ozand PT, Harrison ME, Evans S. Electrospray tandem mass spectrometry in the diagnosis of organic aci-demias. Rapid Commun Mass Spectrom 1994; 8: 129-133. 28. Rashed MS, Ozand PT, Bucknall MP, Little D. Diagnosis of
inborn errors of metabolism from blood spots by acylcarnitines and amino acids profiling using automated electrospray tandem mass spectrometry. Pediatr Res 1995; 38: 324-331.
29. De Jesus V, Chace DH, Lim TH, Mei JV, Hannon WH. Compari-son of amino acids and acylcarnitines assay methods used in newborn screening assays by tandem mass spectrometry. Clin Chim Acta 2010; 411: 684-689.
30. Giovannini M, Agostoni C, Salari PC. Is carnitine essential in children? J Int Med Res 1991; 19: 88-102.
31. Warshaw JB, Curry E. Comparison of serum carnitine and ke-tone body concentrations in breast- and in formula-fed newborn infants. J Pediatr 1980; 97: 122-125.
32. Berghaus TM, Demmelmair H, Koletzko B. Fatty acid composi-tion of lipid classes in maternal and cord plasma at birth. Eur J Pediatr 1998; 157: 763-768.
33. Akre J. Infant feeding. The physiological basis. Bull World Health Organ 1989; 67 (Suppl): 1-108.
34. Smit EN. Essential fatty acid deficiency in malnourished chil-dren: erythrocyte and breastmilk fatty acid compositions in different populations. [Doctoral thesis]. Groningen: University of Groningen, The Netherlands; 2002.
35. Patterson AL, Pourfarzam M, Henderson MJ. The utility of cord blood analysis in the diagnosis of organic acidaemias. J Inherit Metab Dis 2000; 23 (Suppl 1): 84 (Abstract).
36. Nassogne MC, Jakobs C, Brivet M, Sharrard M, Garcia A, Rabier D, et al. Evolution of plasma acylcarnitines pattern in a newborn with prenatal diagnosis of CPT II deficiency: evidence of improvement upon carnitine supplementation. J Inherit Metab Dis 2000; 23 (Suppl 1): 116 (Abstract).
37. Isackson PJ, Bennett MJ, Lichter-Konecki U, Willis M, Nyhan WL, Sutton VR, et al. CPT2 gene mutations resulting in lethal neonatal or severe infantile carnitine palmitoyltransferase II deficiency. Mol Genet Metab 2008; 94: 422-427.
38. Yokoi K, Ito T, Maeda Y, Nakajima Y, Kurono Y, Sugiyama N, et al. A case of holocarboxylase synthetase deficiency with insuf-ficient response to prenatal biotin therapy. Brain Dev 2009; 31: 775-778.
39. Santos L, Patterson A, Moreea SM, Lippiatt CM, Walter J, Henderson M. Acute liver failure in pregnancy associated with maternal MCAD deficiency. J Inherit Metab Dis 2007; 30: 103. 40. Botler J, Camacho LA, da Cruz MM, George P. [Neonatal