BMAA Toxicological Assessment
Using Marine Invertebrates as
Targets
RITA GOMES WALTER VASCONCELOS TESE DE MESTRADO APRESENTADA
AO INSTITUTO DE CIÊNCIAS BIOMÉDICAS ABEL SALAZAR DA UNIVERSIDADE DO PORTO EM
TOXICOLOGIA E CONTAMINAÇÃO AMBIENTAIS
Rita Gomes Walter Vasconcelos
BMAA Toxicological Assessment
Using Marine Invertebrates as
Targets
Dissertação de Candidatura ao grau de Mestre
em Toxicologia e Contaminação Ambientais
submetida ao Instituto de Ciências Biomédicas de
Abel Salazar da Universidade do Porto.
Orientador – Doutora Mafalda Baptista
Categoria – Pós-Doutoramento
Afiliação – Centro Interdisciplinar de Investigação
Marinha e Ambiental
Co-orientador – Doutor Vitor Vasconcelos
Categoria – Professor Catedrático
Afiliação – Centro Interdisciplinar de Investigação
Marinha e Ambiental/ Faculdade de Ciências da
Universidade do Porto
Acknowledgments
I want to thank my supervisors, Mafalda Baptista and Vitor Vasconcelos, for the opportunity to integrate this project and for their guidance and support through the development of this work. To my laboratory colleagues in CIIMAR and FCUP, Cristina Rocha, Pedro Carvalho, Paulo Morais, Marisa Almeida, Marisa Silva and Marta Monteiro for helping me in laboratory work.
I would also like to thank to my supervisors in Stockholm University, Sara Jonasson and Johan Eriksson, for accepting me, allowing me to have such a great experience and to broaden up my views as a student and person. To my laboratory colleagues in Sweden, especially to Sandra Lage, many thanks for their companionship and their solicitude to help me whenever I needed. I want also to thank Nuno Leal for helping me to integrate in a new city and for being there whenever I needed.
To all my friends, especially to Catarina Magalhães, Sara Maia, Inês Gonçalves, Raquel Chaves, Sara Freitas, Tiago Torres and Mafalda Castro many thanks for being always present in the hard moments and for always cheering me up. I would like to thank João Nuno Rodrigues and Pedro Silva for the everyday motivation and company in writing my dissertation.
Finally, I am very grateful to my family, for their constant support and for always pushing me to follow my dreams.
Abstract
BMAA is a potential neurotoxin, related to neurodegenerative diseases (ALS/PDC and Alzheimer). Hypothesis that BMAA can be accumulated by some marine invertebrates has been formulated. Since it was recently discovered that in Portuguese estuaries various strains of cyanobacteria produce BMAA, the aim of this study was to obtain data about the potential transfer of the neurotoxin from cyanobacteria to marine invertebrates, which are part of the human trophic chain.
For that Mytilus galloprovincialis (mussel) and Gibbula umbilicalis (sea snail) were used for a bioaccumulation experiment. They are common organisms in Portuguese coastal ecosystems and present different ways of feeding. The collection of these species was done in a beach at Matosinhos, Portugal. These mussels and sea snails were, then, placed in aerated 20 L aquariums for acclimation during one week. Mussels were exposed to different concentrations of BMAA standard for 24 and 48 h. The results showed that mussels were able to accumulate BMAA, and the uptake rate was higher in the first 24 h.
Afterwards, mussels and sea snails were fed with cyanobacteria strains and collected at different times of exposure, ranging from 4 to 15 days of feeding and 10 days of depuration. The samples were acid digested and enzymatically digested (pepsin, trypsin and chymotrypsin) and analyzed by LC-MS/MS, with or without derivatization. The maximum concentration of BMAA in mussels was observed after 10 days of feeding with 41,92 ± 15,13 µg/g measured after acid digestion, meaning that there was bioaccumulation. After 10 days of depuration, BMAA was still detected in a concentration of 15,29 ± 0,66 µg/g. Samples digested with enzymes showed lower BMAA concentrations, as expected, but followed the same pattern of accumulation during the feeding period, followed by a decrease in BMAA concentration during the depuration period. The fact that digestive enzymes allow the release of BMAA, propose a possible way of transfer of BMAA through food chain. Regarding the sea snails, no BMAA could be measured in this organism.
Metabolic effects of BMAA were studied in cells of gills and hepatopancreas isolated from mussels fed with cyanobacteria. Inhibition of metabolic activity was observed after 20 h of cell growth, where the cells presented a lower growth rate for longer periods of feeding. Part of this inhibition of metabolic activity was considered to be due to BMAA.
iv With this work it was possible to see that BMAA bioaccumulation can occur in some marine invertebrates and has the potential to be transferred through the trophic chain.
Resumo
A BMAA é uma potencial neurotoxina, relacionada com doenças neurodegenerativas (esclerose lateral amiotrófica/coocorrência com Parkinson e demência e Alzheimer). Tem sido sugerido que a BMAA pode ser acumulada por alguns invertebrados marinhos. Foi recentemente descoberto que várias estirpes de cianobactérias de estuários Portugueses são capazes de produzir BMAA.
O objetivo deste estudo foi obter dados relativos à potencial transferência da neurotoxina de cianobactérias para invertebrados marinhos, que fazem parte da cadeia trófica humana.
Para tal, Mytilus galloprovincialis (mexilhão) e Gibbula umbilicalis (caracóis do mar) foram utilizados para uma experiência de bioacumulação. Estes organismos são comuns nos ecossistemas costeiros portugueses e apresentam mecanismos de alimentação diferentes. A recolha destes organismos foi realizada na praia de Matosinhos, em Portugal. Depois, estes mexilhões e caracóis do mar foram colocados em aquários de 20 L com arejamento, para aclimatação, durante uma semana. Os mexilhões foram expostos a diferentes concentrações de padrão de BMAA durante 24 e 48 h. Os resultados mostraram que os mexilhões eram capazes de acumular BMAA e que a taxa de acumulação foi maior nas primeiras 24 h.
De seguida, mexilhões e caracóis do mar foram alimentados com estirpes de cianobactérias e recolhidos a diferentes tempos de exposição, sendo que variaram entre um máximo de 15 dias de alimentação e 10 dias de depuração. As amostras foram digeridas com ácido e digeridas com enzimas digestivas (pepsina, tripsina e quimotripsina) e analisadas por LC-MS/MS, com ou sem derivatização. A concentração máxima de BMAA em mexilhões foi observada ao fim de 10 dias de alimentação com 41,92 ± 15,13 µg/g, medidos após a digestão ácida, evidenciando a existência de bioacumulação. Após 10 dias de depuração, ainda foi possível detectar BMAA numa concentração de 15,29 ± 0,66 µg/g. As amostras digeridas com enzimas mostraram concentrações mais baixas de BMAA, como era esperado, mas seguindo o mesmo padrão de acumulação durante o período de alimentação, seguido pela diminuição da concentração de BMAA durante o período de depuração. O facto de as enzimas digestivas permitirem a libertação de BMAA, sugere que existe a possibilidade de transferência desta neurotoxina através da cadeia alimentar. Relativamente aos caracóis do mar, não foi possível detectar BMAA nestes organismos.
vi Os efeitos metabólicos da BMAA em células das brânquias e do hepatopâncreas isoladas dos mexilhões alimentados com cianobactérias, foram estudados. Foi observada inibição da atividade metabólica após 20 h de crescimento celular, sendo que as células apresentaram uma taxa de crescimento mais baixa nos períodos mais longos de alimentação. Parte desta inibição considerou-se devida à BMAA.
Com este trabalho, foi possível observar que a BMAA pode ser acumulada em alguns invertebrados marinhos e pode ser transferida através da cadeia trófica.
Contents
Acknowledgments ... i Abstract ... iii Resumo ... v Contents ... vii Figures Index ... ix Tables Index ... x List of abbreviation ... xi 1. Introduction ... 1 1.1. Cyanobacteria ... 1 1.2. Cyanotoxins ... 21.3. History and relevance of BMAA ... 3
1.4. Physical and chemical properties of BMAA ... 5
1.5. Mechanism of action of BMAA ... 6
1.6. Analysis of BMAA ... 7
1.7. Bioaccumulation of BMAA and ways of exposure ... 8
1.8. Objectives ...11
2. Material and Methods ...13
2.1. Species ecology ...13
2.2. Cyanobacteria culture growth ...14
2.3. Bioaccumulation experiment ...15
2.3.1. Mussels exposed to BMAA standard ...16
2.3.2. Mussels fed with cyanobacteria ...16
2.3.3. Sea snails fed with cyanobacteria ...16
2.4. Acid microwave-assisted extraction ...17
2.5. Enzymatic digestion ...18
2.6. SPE ...19
2.7. LC-MS/MS analysis ...19
2.7.1. Analysis without derivatization ...19
2.7.2. Analysis with derivatization ...20
2.8. Metabolic activity of cells of mussels fed with cyanobacteria ...21
2.9. Chemicals and reagents ...22
2.10. Statistical analysis ...22
viii
3.1. Microwave-assisted extraction optimization ...23
3.2. Bioaccumulation of BMAA ...26
3.2.1. Mussels exposed to BMAA standard ...26
3.2.2. Animals fed with cyanobacteria ...29
3.2.2.1. Cyanobacteria culture ...29
3.2.2.2. Mussels fed with cyanobacteria ...30
3.2.2.3. Sea snails fed with cyanobacteria ...34
3.3. Metabolic activity of cells of mussels fed with cyanobacteria ...34
4. Discussion...37
4.1. Bioaccumulation experiment ...37
4.2. Metabolic activity of cells of mussels fed with cyanobacteria ...39
5. Conclusion ...41
Figures Index
Figure 1. Structure of BMAA and selected isomeric compounds (DAB and AEG) (adapted
from Jiang et al., 2012). ... 6
Figure 2. BMAA transfer in an aquatic trophic chain (adapted from Jonasson et al., 2010). ...10
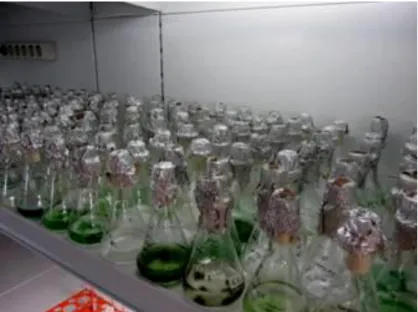
Figure 3. Cyanobacteria culture room ...15
Figure 4. Sampling site of M. galloprovincialis and G. umbilicalis at Matosinhos. ...15
Figure 5. Aquariums with M. galloprovincialis (A) and G. umbilicalis (B)...17
Figure 6. Calibration curve of BMAA standards hydrolyzed at 90 ºC during 20 min and non-hydrolyzed aqueous standards. The trend line colored with dark pink correspond to the hydrolyzed standards and the trend line colored with light pink corresponds to non-hydrolyzed standards. ...24
Figure 7. Calibration curves of hydrolyzed standards and hydrolyzed mussels. The trend line colored with dark pink correspond to the hydrolyzed standards and the trend line colored with light pink corresponds to hydrolyzed mussels. ...25
Figure 8. Calibration curves of hydrolyzed standards and hydrolyzed sea snails. The trend line colored with dark pink correspond to the hydrolyzed standards and the trend line colored with light pink corresponds to hydrolyzed sea snails. ...26
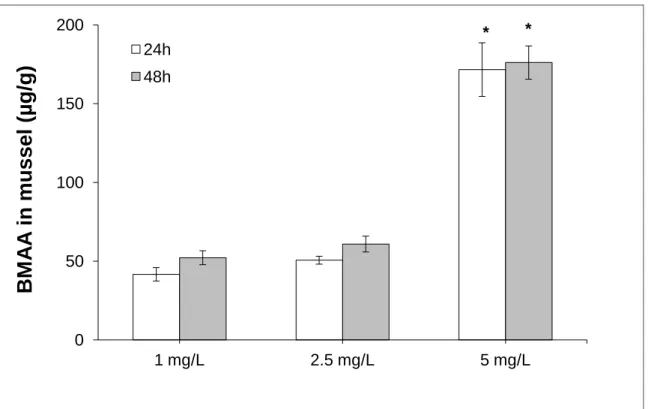
Figure 9. BMAA levels (µg/g) in mussels exposed for 24 h and 48 h to different concentrations of BMAA (1 mg/L; 2,5 mg/L and 5 mg/L). Bars are the standard error (SE) of 4 replicates. * significantly different (p ≤ 0,05). ...27
Figure 10. Concentration of BMAA (µg/g) in mussels exposed to 1 mg/L, 2,5 mg/L and 5 mg/L during 24 h and 48 h. ...28
Figure 11. BMAA quantification (µg/g) in mussel samples exposed to BMAA 4, 8 and 10 days of feeding and 10 days of depuration and acid-digested. The columns colored with dark blue corresponds to the feeding period and the column with light blue correspond to the depuration period. Bars are the standard error (SE) of 3 replicates. * significantly different (p ≤ 0,05). ...30
Figure 12. Uptake rate of BMAA (µg/g/h) by mussels (acid-digested) during the bioaccumulation experiment. ...31
Figure 13. BMAA quantification (µg/g) in mussel samples exposed to BMAA for 4, 8 and 10 days of feeding and 10 days of depuration and enzimatically digested with pepsin. The columns colored with dark pink correspond to the feeding period and the column with light pink corresponds to the depuration period. Bars are the standard error (SE) of 3 replicates. * significantly different (p ≤ 0,05). ...31
Figure 14. BMAA quantification (µg/g) in mussel samples exposed to BMAA during 4, 8 and 10 days of feeding and 10 days of depuration and enzymatically digested with trypsin/chymotrypsin. The columns colored with dark purple correspond to the feeding period. Bars are the standard error (SE) of 3 replicates. ...32
x
Tables Index
Table 1. Cyanotoxins, the producing cyanobacteria and mechanism of action. ... 2
Table 2. Chemical and physical properties of BMAA (adapted from NIEHS, 2008). ... 5
Table 3. Cultured cyanobacteria strains. ...14
Table 4. Programs used for the optimization of the microwave-assisted hydrolysis. ...18
Table 5. Comparison of the 1000 µg/L BMAA standard recoveries after different microwave-assisted hydrolysis, with different time, temperature and powers. ...23
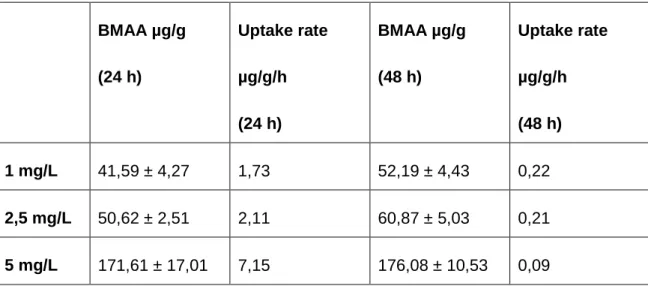
Table 6. Concentration of BMAA (µg/g) on mussels exposed to 1 mg/L; 2,5 mg/L and 5 mg/L for 24 h and 48 h and the respective uptake rate. Mean ± standard error (SE) for the concentration of BMAA. ...28
Table 7. BMAA quantification (µg/g) in cyanobacteria strains used to feed the marine invertebrates. The different growth medium and organisms are also shown. ...29
Table 8: BMAA quantification in mussels samples digested with HCl, pepsin and trypsin/chymotrypsin. Mean ± standard error (SE) (3 replicates). ...33
Table 9. Growth rate (h-1) of cells from M. galloprovincialis after exposure to the Alamar Blue for 2,5 h, 5 h and 20 h. Mean ± standard deviation (SD) (3 replicates). * significantly different (p ≤ 0,05). ...34
List of abbreviation
AEG - N-(2-aminoethyl) glycine ALS - Amyotrophic lateral sclerosis BMAA - β-N-methylamino-L-alanine DAB - 2,4-diaminobutyric acid
LC-MS/MS - Liquid chromatography with tandem mass spectrometry detection LOD – Limit of detection
MN – Motor neuron
m/z – Mass-to-charge ratio
PDC - Parkinsonism dementia complex PSP – Paralitic shellfish poisoning PTFE – Polytetraflouroethylene ROS – Reactive oxygen species SOD – Superoxide dismutase SPE – Solid-phase extraction TIC – Total ion current
1.
Introduction
1.1. Cyanobacteria
Cyanobacteria, also known as blue-green algae, can be distinguished from all other prokaryotes by their ability to carry out oxygen-producing photosynthesis (Paul, 2008). They can grow in any type of water (freshwater, brackish and marine) (Bláha et al., 2009). The cyanobacteria provide an extraordinarily wide-ranging contribution to human affairs in everyday life and are of economic importance (Bartram et al., 1999). They are important primary producers and their general nutritive value is high (Bartram et al., 1999). Due to the fact that they include nitrogen-fixing species, they contribute to soil and water fertility (Bartram et al., 1999). They are, also, used in alimentation and food production (Bartram et al., 1999). However, abundant growth of cyanobacteria in water reservoirs creates severe practical problems for water supplies (Bartram et al., 1999). There are two main factors that contribute for the increase of occurrence of these blooms: anthropogenic eutrophication, with nutrient overenrichment of waters by urban, agricultural, and industrial development; and climate change, a potent catalyst for the expansion of these blooms (elevation of temperature, increased atmospheric concentrations of carbon dioxide, elevated UV fluxes, and elevated pH values) (Paerl and Huisman, 2008; Bláha et al., 2009).
These blooms increase the turbidity of aquatic ecosystems, smothering aquatic plants and thereby suppressing important invertebrate and fish habitats (Paerl and Huisman, 2008). Die-off of blooms may deplete oxygen, killing fish (Paerl and Huisman, 2008). So the high nutrient loading, rising temperatures, enhanced stratification (reducing vertical mixing), increased residence time, and salination are all factors that promote cyanobacterial dominance in many aquatic ecosystems (Paerl and Huisman, 2008).
The occurrence of cyanobacterial mass populations can create a significant water quality problem, especially as many cyanobacterial species are capable of synthesizing a wide range of noxious compounds or potent toxins (cyanotoxins) (Sivonen and Jones, 1999).
2
1.2. Cyanotoxins
Cyanotoxins can be divided following two main criteria (Sivonen and Jones, 1999):
On the basis of their mechanism of action on terrestrial vertebrates, especially mammals (hepatotoxins, neurotoxins, dermatoxins, cytotoxins and irritant toxins);
According to their chemical structure (cyclic peptides, alkaloids or lipopolyssacharides);
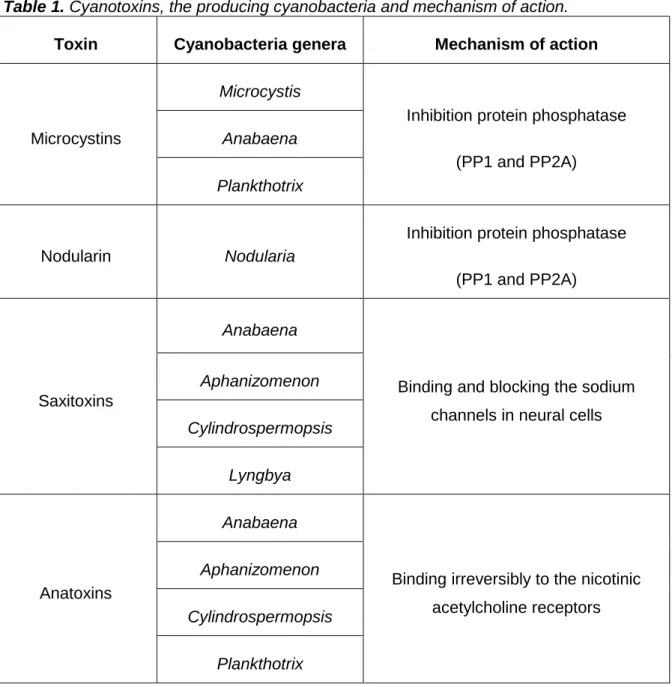
Table 1 shows the main cyanotoxins, the producing cyanobacteria and their mechanism of action.
Table 1. Cyanotoxins, the producing cyanobacteria and mechanism of action.
Toxin Cyanobacteria genera Mechanism of action
Microcystins
Microcystis
Inhibition protein phosphatase (PP1 and PP2A)
Anabaena Plankthotrix
Nodularin Nodularia
Inhibition protein phosphatase (PP1 and PP2A)
Saxitoxins
Anabaena
Binding and blocking the sodium channels in neural cells
Aphanizomenon Cylindrospermopsis
Lyngbya
Anatoxins
Anabaena
Binding irreversibly to the nicotinic acetylcholine receptors
Aphanizomenon Cylindrospermopsis
Oscillatoria Microcystis
Anatoxin-a (s) Anabaena Inhibition of acetylcholinesterase
activity
Cylindrospermopsin
Cylindrospermopsis
Inhibitor of protein biosynthesis cytogenetic damage on DNA
Aphanizomenon Umezakia Raphidiopsis
Anabaena
Lipopolysaccarides Cyanobacteria in general Irritant; causes inflammation in exposed tissues
BMAA Cyanobacteria in general Binding to the glutamate receptors, like NMDA, AMPA and mGluR
1.3. History and relevance of BMAA
β-N-methylamino-L-alanine (BMAA) is a neurotoxic non-protein amino acid produced naturally by cyanobacteria found in freshwater, marine and terrestrial ecosystems (NIEHS, 2008). This toxin was first isolated by Vega and Bell (1967) from cycad seeds, in Guam (Pacific Ocean) (Cohen, 2012). Among Chamorro people of Guam the incidence of neurodegenerative illness (mostly Amyotrophic Lateral Sclerosis/Parkinsonism Dementia Complex) was one of the highest in the world (Cohen, 2012). Amyotrophic Lateral Sclerosis (ALS) is a debilitating and fatal neuromuscular disease and approximately 8– 10% of all cases are familial, about half of which are characterized by superoxide dismutase mutation (SOD-1). The other 90–92% of ALS cases occurs sporadically, with no known familial history (Banack et al., 2010b). At present, there is no known cause for sporadic ALS, though a number of environmental compounds have been implicated as potential etiological agents (Banack et al., 2010b). BMAA has been linked to the high incidence of the neurodegenerative disease amyotrophic lateral
sclerosis/parkinsonism-4 dementia complex (ALS/PDC) among the indigenous Chamorro people on the islands of Guam (Cox et al., 2003). BMAA was present throughout cycad tissues, but was particularly abundant in cycad seeds and immature pollen (Banack and Cox, 2003). The cycad seeds are washed and used as flour by the indigenous Chamorro people, and they are also used as food by wild animals including flying foxes, pigs and deer (Cohen, 2012). The suggested link between BMAA and ALS/PDC in Guam is because of (Pablo, 2009):
BMAA is produced by cyanobacteria, including endosymbiotic species of Nostoc (a genus of cyanobacteria) found in cycad roots;
BMAA occurs in higher amounts in cycad flour than was previously suspected because of its occurrence in the protein fraction (i.e., BMAA binds to a protein);
BMAA can be biomagnified in animals which forage on cycad seeds and are subsequently consumed by the Chamorro people.
The biomagnification was reported by Murch et al. (2004b), where they observed the biomagnification at Guam ecosystem. In this study, BMAA was found as protein-bound in symbiont-cyanobacteria (namely Nostoc) of Cycas micronesica (between 2 and 738 µg/g), in cycad flour (between 49 and 168 µg/g) and in flying foxes (between 2 and 146 µg/g).
The same authors found that BMAA, both as a free amino acid and as a protein-bound amino acid, occurs in the brain tissues of Chamorro patients who died from ALS/PDC (Murch et al., 2004a). Thus, a trophic chain where BMAA was present from primary producers to the consumers was found.
BMAA was, also, detected in the brains of Canadian patients with Alzheimer’s disease but not in control patients without neurological disease (Murch et al., 2004a). Another interesting finding was made by Pablo et al. (2009), that showed the presence of BMAA in the brains of USA patients, but not in those of patients with Huntington’s disease (a genetic neurodegenerative disease) (Pablo et al., 2009). The negative screen for BMAA in Huntington’s disease, suggests that BMAA does not occur as a byproduct of neurodegenerative disease (Pablo et al., 2009; Banack et al., 2010b).
The fact that it was reported that all known groups of cyanobacteria can produce BMAA allowed more studies of bioaccumulation in aquatic environment (Cox et al., 2005), especially in marine ecosystems, where many organisms from different trophic levels presented BMAA (Brand et al., 2010; Jonasson et al., 2010).
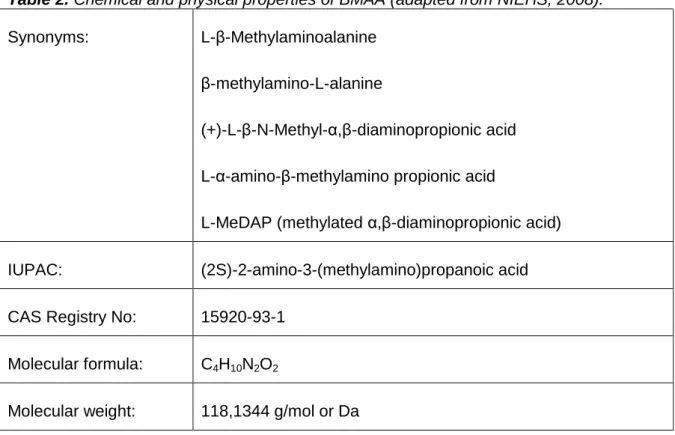
1.4. Physical and chemical properties of BMAA
BMAA is a polar, non-protein basic amino acid. Some chemical and physical properties are shown in table 2.
Table 2. Chemical and physical properties of BMAA (adapted from NIEHS, 2008). Synonyms: L-β-Methylaminoalanine
β-methylamino-L-alanine
(+)-L-β-N-Methyl-α,β-diaminopropionic acid L-α-amino-β-methylamino propionic acid
L-MeDAP (methylated α,β-diaminopropionic acid)
IUPAC: (2S)-2-amino-3-(methylamino)propanoic acid CAS Registry No: 15920-93-1
Molecular formula: C4H10N2O2
Molecular weight: 118,1344 g/mol or Da
BMAA is an amino acid and can be found as L- and D-α-amino-β-methylaminopropionic (Vega et al., 1968). Vega and colleagues (1968) reported that the
D- isomer was not toxic when injected in chicks and young rats in comparison with the L-
isomer that produced a toxic effect. The last isomer was the one isolated in seeds of
Cycas circinalis (Vega and Bell, 1967).
Many different isomers of BMAA have been reported and when the objective of the study is to detect and quantify this neurotoxin, these isomers have to be considered. From these isomers the most reported in literature are DAB (2,4-diaminobutyric acid) and AEG (N-(2-aminoethyl) glycine), that are molecular isomers. DAB is believed to be a hepatotoxic and neurotoxic non-protein amino acid that is found in many prokaryotic and eukaryotic organisms (Jiang et al., 2012). AEG is a backbone for peptide nucleic acids and its effects have not yet been discovered (Banack et al., 2012). In figure 1 it’s show the structure of BMAA, DAB and AEG.
6 Figure 1. Structure of BMAA and selected isomeric compounds (DAB and AEG) (adapted
from Jiang et al., 2012).
1.5. Mechanism of action of BMAA
The BMAA that is bound to proteins within the body can slowly be released into cerebral tissues in the free form when these proteins are metabolized over time, acting as an endogenous neurotoxic reservoir (Murch et al., 2004a; Cox et al., 2005). BMAA has been found to induce selective motor neuron (MN) loss in dissociated mixed spinal cord cultures at concentrations of approximately 30 μM, significantly lower than those previously found to induce widespread neuronal degeneration and supporting the hypothesis that BMAA may contribute to the selective MN loss in ALS/PDC (Rao et al., 2006; Lobner et al., 2007). One mechanism of action of this toxin is excitotoxicity. This type of toxicity is characterized by malfunctions in EAAs (excitatory amino acids – neurotransmitters within the nervous system) that can lead to neurons being damage and fatally compromised (Chiu et al., 2011). Excitotoxic cell death involves prolonged depolarization of neurons, changes in intracellular calcium concentrations, and the activation of enzymatic and nuclear mechanism of cell death (Doble, 1999). AMPA (quistalate/α-amino-3-hydroxy-5-methyl-4-isoxazolepropionic acid), NMDA (N-methyl-D-apartate) and mGluR (metabolic glutamate receptors) are the main EAA receptors, all of which are activated by glutamate and similar substances (Chiu et al., 2011). Many studies shown that excitotoxicity is a main player in neurodegenerative disease, because there is an increased level of glutamate found in the cerebrospinal fluid of ALS patients (Majoor-Krakauer et al., 2003; Shaw, 2005). So, when BMAA is orally consumed, 80% of ingested BMAA passes from the gut into the blood stream (Chiu et al., 2011). BMAA then crosses the blood-brain barrier via large neutral amino acid carriers (Chiu et al., 2011). It is known that physiological concentrations of bicarbonate ions react with BMAA to form β-carbamate, and in this form BMAA can compete in binding to various glutamate receptors, like NMDA receptors, AMPA receptors and mGluR (Banack et al., 2010b; Rao et al., 2006). The activation of this receptors leads to shifts in cellular ion concentrations
resulting in increases in Na+ and Ca2+, and a decrease in K+ concentrations, and also causes the cell to become depolarized leading to permeabilisation of the cell membrane, resulting in the release of noradrenalin (Chiu et al., 2011). BMAA also inhibits the cysteine/glutamate antiporter system Xc-, preventing the uptake of cysteine, resulting in glutathione depletion, which contributes to increases in oxidative stress (Liu et al., 2009). At the same time the system Xc- increases the release of glutamate from the cell (Liu et al., 2009). Glutamate can then bind to glutamate receptors increasing damage by excitotoxicity. Increases in intracellular Ca2+ concentrations disrupt normal mitochondrial function leading to the release of ROS (reactive oxygen species) into the cytoplasm, thereby contributing to the observed increases in oxidative stress (Lobner et al., 2007). In addition, cytochrome-c is released from mitochondria resulting in the induction of apoptosis (Chiu et al., 2011).
Beside this mechanism of action, it has also been suggested that BMAA can be incorporated into proteins and subsequently lead to protein misfolding (Banack et al., 2010b). The tRNA synthetase enzyme for the amino acid serine mistakenly picks up BMAA and incorporates it into proteins in vitro (Holtcamp, 2012). Because of this misincorporation and consequent occurrence of mistakes in translation, the hydrophobic parts of the protein end up exposed. These parts adhere to other misfolded proteins, forming “aggregates”, a characteristic of neurodegenerative diseases. The formation of small aggregates seeds the formation of larger, more toxic aggregates in a sort of chain reaction that prevents the cells from functioning effectively (Holtcamp, 2012).
These multiple mechanisms of BMAA toxicity may account for its ability to induce complex neurodegenerative diseases (Banack et al., 2010b).
1.6. Analysis of BMAA
Concerning the analysis of BMAA, different methods have been used. High performance liquid chromatography with fluorescence detection (HPLC-FLD) (Cox et al., 2005; Banack et al., 2007; Johnson et al., 2008; Metcalf et al., 2008; Eriksson et al., 2009; Cianca et al., 2012a), gas chromatography with mass spectrometry detection (GC-MS) (Esterhuizen and Downing, 2008), capillary electrophoresis (CE) (Baptista et al., 2011), amino acid analyzer (Banack et al., 2007), nuclear magnetic resonance spectroscopy (Moura et al., 2009), liquid chromatography with tandem mass spectrometry detection (LC-MS/MS) (Kubo et al., 2008; Rosén et al., 2008; Faassen et al., 2009; Banack et al., 2010a; Kruger et al., 2010; Li et al., 2010; Spácil et al, 2010; Jonasson et al., 2010), and
8 more recently commercial enzyme linked immunosorbent assay (ELISA) (Faassen et al., 2013), have been reported for the measurement of BMAA. It was hypothesized that different analytical methods for the determination of BMAA deviate in their results (Faassen et al., 2012). For example, high BMAA concentrations and high percentages of positives samples were found only in those studies that had used HPLC-FLD (Cox et al., 2005; Metcalf et al., 2008), GC-MS (Esterhuizen and Downing, 2008) or CE (Baptista et al., 2011). On the other hand, studies that had used LC-MS/MS for quantification either did not detect BMAA, or reported lower BMAA concentrations (Rosén and Hellenas, 2008; Faassen et al., 2009; Jonasson et al., 2010; Kruger et al., 2010). Faassen et al. (2012) concluded, in their study, that HPLC-FLD overestimated BMAA concentrations in some cyanobacterial samples due to its low selectivity. They also recommended to only use selective and sensitive analytical methods like LC-MS/MS (with derivatization or not) for BMAA analysis (Banack et al., 2010a; Faassen et al., 2012).
Another difference that occurs in these studies is the use (or not) of derivatization. Because BMAA has no chromophore, it needs to be derivatized in order to be detected by fluorescence (Cianca et al., 2012b). Derivatization is also used with LC-MS/MS, because the electrospray ion source (ESI) desorption of charged molecules occurs from the surface, meaning that sensitivity is higher for compounds with a greater concentration at the surface of the droplet, thus the more lipophilic ones (Banack et al., 2010a). The derivatized compounds are more lipophilic compared to underivatized ones and also have higher molecular weight, being easier to detect (Banack et al., 2010a).
However, some concerns are given to the use of derivatization. This step in the sample preparation can interfere in the results, since there is a theoretical risk that a compound similar to BMAA would react to give a BMAA-derivative during the derivatization procedure (Rosén and Hellenas, 2008). So, many investigators have used methods of analysis of BMAA without using derivatization (Kubo et al., 2008; Rosén and Hellenas, 2008; Faassen et al., 2009; Faassen et al., 2012).
1.7. Bioaccumulation of BMAA and ways of exposure
The bioaccumulation of cyanotoxins by aquatic organisms is widely described in literature. Several of these studies have shown that mollusks are the most frequent organisms that are able to accumulate cyanotoxins, like mycrocystin-LR (Vasconcelos, 1995; Pires et al., 2004), PSP (Pereira et al., 2004), nodularin (Karlsson et al., 2003), cylindrospermopsin (Saker et al., 2004) and anatoxin-a (Osswald et al., 2008).
Since BMAA was found to be synthesized from cyanobacteria and is not a byproduct of neurodegeneration (Pablo et al., 2009), the identification of BMAA, not only in the brains of ALS/PDC patients who died in Guam, but also of patients who had died of Alzheimer’s disease in Canada and USA, suggests that exposure to cyanobacterial neurotoxins exists outside Guam and that BMAA may be more widely distributed than previously supposed (Murch et al., 2004a; Bell, 2009).
This was further evidenced by the finding that BMAA can be produced by all known groups of cyanobacteria, including cyanobacterial symbionts and free-living cyanobacteria (terrestrial, as well as freshwater, brackish, and marine) (Cox et al., 2005). In British waterbodies, Metcalf et al. (2008) reported the presence of BMAA in samples of cyanobacteria from different blooms. They also showed that BMAA can co-occur with others cyanotoxins, including microcystins, anatoxin-a, nodularin and saxitoxin (Metcalf et al., 2008). In Portuguese estuaries, free and protein bound BMAA were found in cyanobacteria (Cianca et al., 2012b).
Esterhuizen et al. (2011) showed that free BMAA can be released during the collapse of cyanobacterial blooms. This process combined with cellular turnover creates a latent source of the non-protein amino acid for bioaccumulation and biomagnification in aquatic ecosystems. Following accumulation of free BMAA, protein association was observed which suggests a potential route for human exposure to BMAA (Murch et al., 2004b; Esterhuizen et al., 2011). As it was early recognized, BMAA can be biomagnified in animals on Guam ecosystem (Cox et al., 2003; Banack et al., 2006).The evidence of the widespread occurrence of BMAA, suggest that bioaccumulation of BMAA could occur within other organisms outside of Guam (Cox et al., 2005).
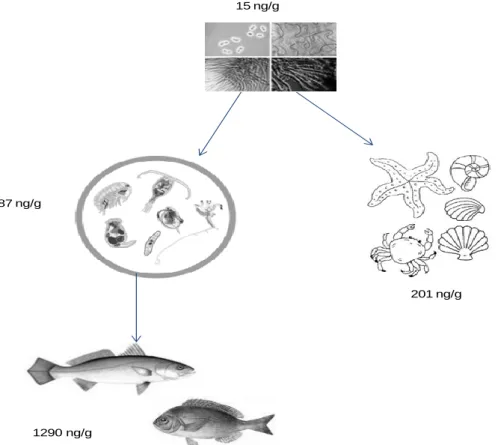
Several studies have reported the presence of BMAA in animals in marine environment, evidencing that some transfer exist through trophic chain. For example, Brand et al. (2010) found that many crustaceans appear to have high concentrations of BMAA (7000 µg/g) in South Florida, where it is usual to occur many blooms of cyanobacteria.
In the Baltic Sea was found that BMAA is biosynthesized by cyanobacteria (Jonasson et al., 2010). Like in South Florida, BMAA was also found in organisms of higher trophic levels that directly or indirectly feed on cyanobacteria, such as zooplankton (87 ng/g) and various vertebrates (fish) and invertebrates (mussels, oysters), where concentrations ranging from 10 ng/g to 1290 ng/g were found (Jonasson et al., 2010).
10 It was also reported levels of BMAA in feathers of Lesser Flamingo (77 ng/g), which consume cyanobacteria as a major part of their diet, in Kenyan lakes (Metcalf et al., 2013).
Figure 2. BMAA transfer in an aquatic trophic chain (adapted from Jonasson et al., 2010).
Therefore, human population may potentially be exposed to BMAA from water sources containing cyanobacteria blooms and consumption of fish or animals that have been exposed to BMAA (NIEHS, 2008).
Another postulated route of cyanotoxin exposure is inhalation of aerosolized toxins (Banack et al., 2010b). There are many examples of toxin aerosolization leading to human illness (Stommel et al., 2013). An example is the brevetoxin that can be aerosolize through wave action of marine waters, causing asthma like syndrome (Fleming et al., 2007). Other example is the generation of aerosolized microcystin, making inhalation a potential route of exposure (Backer et al., 2008). Consequently, Stommel et al. (2013) hypothesize that white caps on waterbodies containing cyanobacterial blooms and cyanobacteria present on cooling towers, could result in aerosolization of BMAA.
15 ng/g
87 ng/g
1290 ng/g
1.8. Objectives
The objective of this work was to obtain data about the potential transfer of BMAA from cyanobacteria to marine invertebrates, which are part of the human trophic chain.
For this, two different species of marine invertebrates, with different ways of feeding were chosen. Mytilus galloprovincialis (a filter feeder) and Gibbula umbilicalis (a grazer) were fed with cyanobacteria, growing in laboratory, that had been isolated from Portuguese northern estuaries, to determine BMAA uptake, in a bioaccumulation experiment in which different periods of feeding and depuration were tested.
2.
Material and Methods
2.1. Species ecology
M. galloprovincialis (blue mussel or Mediterranean mussel) is native to the
Mediterranean coast and the Black and Adriatic Seas. This mussel is dark blue or brown to almost black. The two shells are equal and nearly quadrangular. The outside is black-violet colored. On one side the rim of the shell ends with a pointed and slightly bent umbo while on the other side is rounded, although the shape of the shell can vary from region to region.
In its native range, M. galloprovincialis can be found from exposed rocky outer coasts to sandy bottoms (Ceccherelli and Rossi, 1984). It typically requires rocky coastlines with a high rate of water flow.
Regarding the nutrition, M. galloprovincialis is a filter-feeding bivalve that eats a wide range of planktonic organisms. This species prefers fast moving water that is free of sediment and thrives in regions where nutrient-rich upwelling occurs. This mussel is an important component of estuarine and marine food webs and because it is a sessile filter feeder, it may be exposed to high density of cyanobacteria and their toxins (Osswald et al., 2008).
G. umbilicalis is found on the European coasts of the Atlantic Ocean. This sea snail
belongs to the Trochidae family. It is found from the upper shore into the sublitoral on sheltered rocky shores and is tolerant of emersion and brackish waters. It is characterized by having a small top shell, broader, rounded and flatter. It also has a large round umbilicus (a deep hole on the underside of the shell). Concerning other features, it is greenish-grey in color and has broad diagonal stripes of reddish-purple. They live as algae grazers and detritus eaters. These species are not normally used in bioaccumulation studies. However, recently, it was shown that levels of tetrodotoxin were detected in G. umbilicalis (Silva et al., 2012; Silva et al., 2013).
These two species are used as food by other animals (including humans), providing a way of exposure to cyanotoxins, namely BMAA, through food chain.
14
2.2. Cyanobacteria culture growth
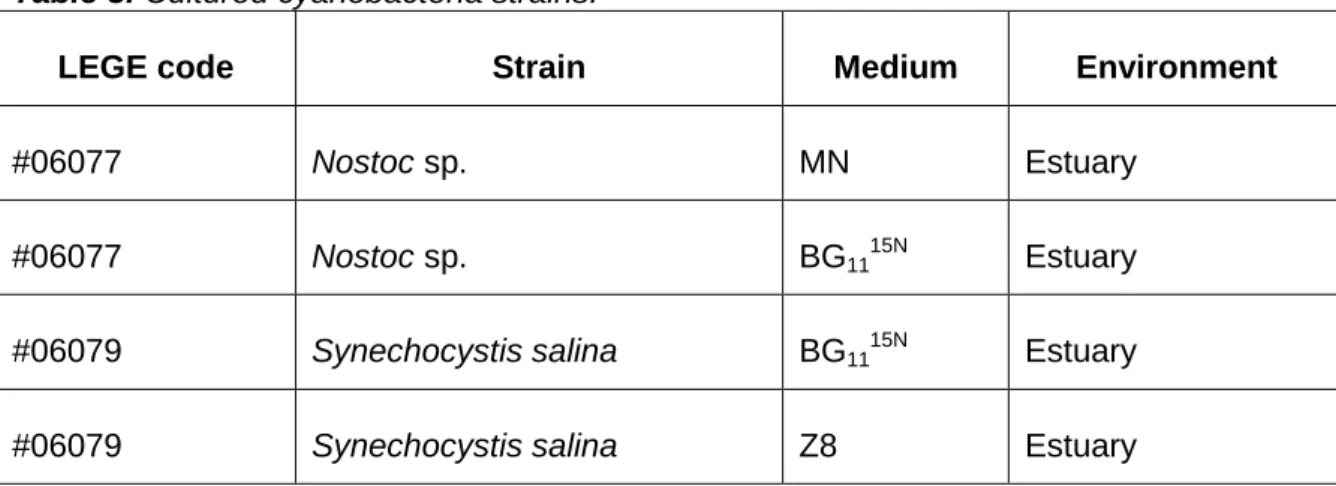
Previous studies regarding BMAA production and cyanobacteria characterization served as the basis for the choice of species (Cianca et al., 2012b; Brito et al., 2012). The cyanobacteria were isolated as described in Lopes et al. (2010) and kept growing at LEGE laboratory (CIIMAR) as part of the culture collection. The selected strains of cyanobacteria were grown in BG11 (Rippka et al., 1979) and MN (Waterbury and Stanier, 1978) and Z8 (Kotai, 1972) growth media for two weeks, at 25ºC of temperature and under light intensity of 20,8 – 27,4x10⁻⁶ E m-2 s-1 and a light/dark cycle of 14/10 h (figure 3). Some modifications were introduced in the culture media, namely in BG1115N (a variant of the BG11 medium), in which labeled 15N was delivered as 15NH4Cl (table 3).
Table 3. Cultured cyanobacteria strains.
LEGE code Strain Medium Environment
#06077 Nostoc sp. MN Estuary
#06077 Nostoc sp. BG1115N Estuary
#06079 Synechocystis salina BG1115N Estuary
#06079 Synechocystis salina Z8 Estuary
The cells were grown to obtain enough biomass to feed the animals (105 cells/mL). At the end of the experiment the cells were harvested by centrifugation. Afterwards, all samples were lyophilized and stored at -20ºC.
Figure 3. Cyanobacteria culture room.
2.3. Bioaccumulation experiment
The collection of M. galloprovincialis and G. umbilicalis was done in a beach at Matosinhos, Portugal (figure 4). These mussels and sea snails were, then, placed in aquariums in BOGA (Biotério de Organismos Aquáticos) at CIIMAR for acclimation during one week. The aquariums had capacity for 20 L and had aeration. These were filled with 3 L of marine water and every two days the water was changed. Some sea snails and mussels were also collected from the beach and frozen (without any treatment) for subsequent analysis.
16
2.3.1. Mussels exposed to BMAA standard
M. galloprovincialis were exposed to BMAA standard (Sigma – Aldrich) with
concentrations of 1, 2,5 and 5 mg/L for periods of 24 h and 48 h. The BMAA standards were dissolved in the seawater and four individuals were exposed to each concentration. The mussels were not fed. One death was observed during this experiment.
2.3.2. Mussels fed with cyanobacteria
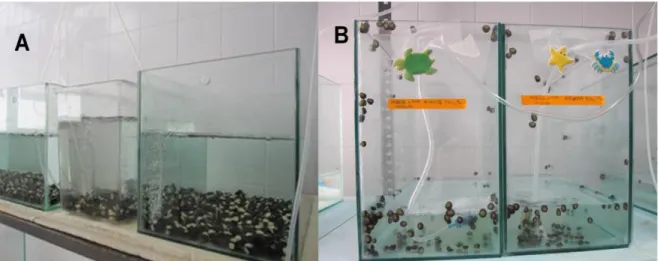
Approximately sixty individuals kept in 20 L aquariums and aerated, were fed with S.
salina, growing in Z8 medium, every two days (figure 5A). The water was changed every
two days. The mussels were collected after 4, 8 and 10 days of feeding and at the end of the experiment after allowing 10 days of depuration. No deaths were observed during this experiment.
Control mussels, kept in a separate aquarium, were fed with the green algae
Chlorella sp. grown as described in 2.2.
2.3.3. Sea snails fed with cyanobacteria
G. umbilicalis were placed in 20 L aquariums and aerated (120 organisms in each),
as described before, and fed with S. salina, growing in BG1115N culture media, and Nostoc sp., one growing in MN culture medium and the other one in BG1115N, every two days (figure 5B). The water was also changed every two days.
Chlorella sp. was used as control. After 5, 10 and 15 days of feeding, and 5 days of
depuration, the sea snails were collected. Five deaths were observed during this experiment.
Figure 5. Aquariums with M. galloprovincialis (A) and G. umbilicalis (B).
2.4. Acid microwave-assisted extraction
The soft parts of the body of the mollusks were removed from their shells, weighted and digested.
Usually, the hydrolysis step to extract BMAA uses 6 M HCl at 110ºC, with times of digestion varying from 12 to 24 h (Faassen et al., 2009; Jonasson et al., 2010). However, Baptista et al. (2011) suggested this step could be performed using a microwave system. The main advantages of the microwave-assisted digestion are the shorter time of the procedure, the possibility to control the temperature and/or the pressure inside the microwave vessels, and the possibility to process a larger number of samples at the same time (Baptista et al., 2011).
To optimize the microwave-assisted hydrolysis of BMAA three different programs were tested. Time, temperature and power of the hydrolysis were varied as shown in table 4. For that, 1 mg/L BMAA standard (1 replica) was transferred to closed PTFE vessels and digested using a high-pressure microwave system (Milestone-Ethos1).
18 Table 4. Programs used for the optimization of the
microwave-assisted hydrolysis.
Power (W) Temperature (ºC) Time (min)
300+400+500 >50 5+5+5
300 >50 10
<1000 90 20
Mussels exposed to BMAA standard and mussels and sea snails fed with cyanobacteria and cyanobacteria biomass were digested with 2 mL of 6 M HCl, for 20 min at 90ºC, 10 mg per sample. Three replicas per sample were digested. The complete dissolution of the biomass was achieved as verified by the clarity of the digest. Afterwards the samples were evaporated under a low flux of nitrogen.
2.5. Enzymatic digestion
Mussels and sea snails fed with cyanobacteria were also digested with digestive enzymes, namely proteases: pepsin, trypsin and chymotrypsin.
The enzymatic digestion was performed according to Bauer et al. (2003), with minor modifications. The reagents used for this method were prepared as follows:
Pepsin/HCl solution: 0,8 g of pepsin was dissolved in 500 mL of HCl solution (4,25 mL HCl and water);
Trypsin/Chymotrypsin solution: 0,9 g of each enzyme were dissolved in a pH 7,8 phosphate buffer (560 mL of Na2HPO4 0,165 mol/L and 440 mL of KH2PO4.12H2O 0,165 mol/L)
HCl/Acetic acid solution: HCl (1 mol/L) and acetic acid (1 mol/L) were combined in a ratio of 5:2.
Samples were digested with pepsin, or with trypsin/chymotrypsin. For the pepsin digestion the samples were incubated in 50 mL tubes with 8,5 mL of pepsin/HCl solution.
For the trypsin/chymotrypsin digestion the samples were incubated in 50 mL tubes with 10 mL of trypsin/chymotrypsin solution. At the end of the digestion the solution was neutralized by addition of 1,6 mL of HCl/acetic acid solution.
Three replicas of 100 mg samples were made for each digestion. The samples were incubated in a water bath, at 37ºC, for 2 h with constant stirring. After this, the samples were centrifuged and the supernatant was collected. All samples were then pre-concentrated using solid-phase extraction (SPE).
2.6. SPE
Mussels and sea snails digested with enzymes and sea snails digested with HCl were pre-concentrated by solid-phase extraction using a cartridge Isolute HCX-3, 100 mg (Biotage) and the cleanup procedure described by Spácil et al (2010). The solid phase column was pre-conditioned with 1 mL MeOH. After that, it was conditioned with 2 mL 0,1% formic acid/H2O.
HCl digested samples were reconstituted in 1 mL of 0,1% formic acid/H2O and applied to the column. The enzymatically digested samples were applied to the SPE column. The washing step was done using 1 mL 0,1% formic acid/H2O, followed by a two-step elution. The first elution two-step consisted of 1 mL 0,1% formic acid in 25% MeOH. The second elution step consisted of 1 mL 2% NH4+ in MeOH. Both eluates were evaporated using a freezdrier (-110ºC, vacuum).
2.7. LC-MS/MS analysis
2.7.1. Analysis without derivatization
Liquid Chromatography with mass detection (LC-MS/MS) without derivatization was used to measure BMAA in cyanobacteria and mussels samples. The samples were reconstituted with 20 mM HCl, before the analysis with LC-MS/MS.
Analyses were performed using a system that comprised a LC (Thermo Scientific) coupled to a MS (Thermo Scientific, LCQ Fleet) with an ESI interface. The electrospray interface was operated using the following settings: positive polarity and nebulizer, N2 (1,5
20 L/min; drying gas, N2 at 0,1 Mpa). Full-scan MS was performed from m/z 50 to 150 at 0,5 s–1 scan in the continuum mode. LC conditions were as follows: column, ZIC-HILIC (100 mm x 2,1 mm; with guard column); mobile phase of 90–60% aqueous linear gradient of acetonitrile (ACN) for 20 min, then 60% aqueous ACN maintained for 15 min; flow rate of 0,5 mL/min; column temperature, 40ºC; and CE 16,0 (collision energy) .
To obtain an analytical curve and to determine the detection limit for BMAA, standard BMAA solutions (10 µg/L to 1000 µg /L), which were prepared using 20 mM HCL as the solvent, were used (Kubo et al., 2008).
Selected specific product ions (m/z 102, 88, 73), all derived from the precursor ion
m/z 119 (BMAA molecular weight (M + H+)) and originated from different parts of the
molecule were selected. The ion used for quantification was m/z 119, whereas the other two ions were used as qualitative. These products were detected in previous LC-MS/MS analysis of BMAA (Rosén and Hellenas, 2008). Excalibur V2.1 software was used to explore acquired chromatographic data. The limit of detection was 1,7 pmol/injection.
2.7.2. Analysis with derivatization
Liquid Chromatography with mass detection (LC-MS/MS) with derivatization was used to measure BMAA in cyanobacteria, sea snails and mussels samples.
Standards and samples were derivatized with AQC - 6-aminoquinolyl-N-hydroxysuccinimidyl carbamate (Waters AccQ·tag ultra-kit, Milford, MA, USA). All chemicals used for the reaction were supplied with the kit and solutions were applied as follows: 20 µL of 20 mM HCl was added to redisolve the dried sample pellet, then 70 µL of borate buffer was added followed by 30 µL ACQ tag. The sample was then vortexed and analyzed within 48 h. ESI ionization was performed in positive ion detection mode. The mass analyzer used SRM scan type with recorded transitions: 459,1>119,1 (CE 30,0), DAB 459,1>188,0 (CE 38,0), AEG 459,1>214,1 (CE30,0), BMAA 459,1>258,0 (CE 30,0). Other parameters of the ESI source and the mass analyzer are listed below: capillary voltage (5500V), source temperature (450C), declustering potential (50), focusing potential (350), and entrance potential (6).
The LC system was an Acqutiy UPLC Xevo, TQ-MS with an Acquity UPLC, BEH C18, 1,7 µm, 2,1 x 100 mm column. Eluent A was 0,01% formic acid in 0,05% ammonia and water; eluent B was 0,01% formic acid in methanol. The elution program was applied as
follows: 0,0%A till 4,00 min; 99,9%A 0,1%B till 4,10 min; 45%A 45%B till 4,70 min; 100%B till 6,00 min; 99,9%A 0,1%B till end. To obtain an analytical curve and to determine the quantification limit for BMAA, standard BMAA solutions (1 µg/L to 1000 µg/L), which were prepared using 20 mM HCL as the solvent, were used. The ion used for quantification was
m/z 119, whereas the m/z 258 was used as qualitative. MassLynx V4.1 software was
used to explore acquired chromatographic data. The limit of detection was 0,4 pmol/injection.
2.8. Metabolic activity of cells of mussels fed with
cyanobacteria
The primary cells for this experience were obtained as previously described by Louzao et al. (2010). Mussel gills and hepatopancreas, from the mussels fed with cyanobacteria, were excised, separately washed in ice-cold sea water and sliced with a bistoury in small fragments. Then, gills and hepatopancreas portions were immersed in ice-cold sea water and gently agitated with a magnetic stirrer. After washing for 15 min the slices were rinsed twice with fresh ice-cold sea water and filtered through 200 µm nylon meshes three times. Finely chopped 5-10 g of gills and hepatopancreas tissues were enzymatically dispersed with 3500 IU/mL collagenase and 1 IU/mL dispase in 20 mL of artificial sea water for 45 min at 37ºC (Louzao et al., 2010). The treatment resulted in a suspension containing the cells, which were harvested by centrifugation at 800 rpm for 5 min. 200 μL of the cell-containing suspension were seeded on 96-well plates. Three replicates of each sample were made. 20 μL of Alamar Blue (Biosource; Invitrogen Corporation), diluted 1:5, was added and fluorescence was measured using a microplate reader (Biotek synergy HT). Cells were incubated in constant shaking at room temperature, and measurements were registered at 2,5; 5 and 20 h. Fluorescence was monitored at 530-560 nm excitation wavelength and 590 nm emission wavelength.
The Alamar Blue Assay incorporates a fluorometric/colorimetric growth indicator based on detection of metabolic activity. Specifically, the system incorporates an oxidation-reduction (REDOX) indicator that both fluoresces and changes color in response to chemical reduction of growth medium resulting from cell growth (Ahmed et al., 1994).
The REDOX indicator exhibits both fluorescence and colorimetric change in the appropriate oxidation-reduction, is demonstrated to be minimally toxic to living cells and produces a clear, stable distinct change which is easy to interpret. Metabolic activity of the
22 cells being tested results in a chemical reduction. Continued metabolic activity maintains a reduced environment while inhibition of metabolic activity results in an oxidized environment. Reduction causes the REDOX indicator to change from oxidized (non-fluorescent, blue) form to reduced ((non-fluorescent, red) form. Fluorescence is proportional to the number of metabolic active cells.
2.9. Chemicals and reagents
L- BMAA hydrochloride, its structural isomer DAB and AEG, formic acid, ammonia,
HCl p.a. 37% (hydrochloric acid) were purchased from Sigma-Aldrich. The enzymes used, were purchase, also, from Sigma-Aldrich. The AccQTagfluor (AQC) reagent Kit was purchased from Waters Corporation. Acetonitrile, methanol and chromatographic-grade water was obtained from VWR. The deionized water (dH2O) had a conductivity < 0,1 µS/cm. Alamar Blue was from BiosourceTM, Invitrogen Corporation.
2.10. Statistical analysis
BMAA content results are the mean values of four or three independent replicates. A
t-test or a one-way analysis of variance (ANOVA) was performed to test for significant
differences in mean concentration. Whenever significant differences were found (p ≤ 0,05) a Tukey test was performed, using SPSS 21 Software.
The uptake rate was calculated dividing the mean concentration by the hours of exposure.
For the metabolic activity assay, the growth rate was calculated using the follow formula: ln(Cf/Ci), where ln is natural logarithm, the Cf is final concentration and Ci is initial concentration.
3.
Results
3.1. Microwave-assisted extraction optimization
To optimize BMAA hydrolysis, using a microwave, three different programs were tried. The acid microwave-assisted digestion was used before for BMAA extraction from cyanobacteria (Baptista et al., 2011). As far as we know, this method was not yet used for BMAA extraction from animals, in these case marine invertebrates. So, we optimized this technique to obtain higher recovery efficiency of BMAA.
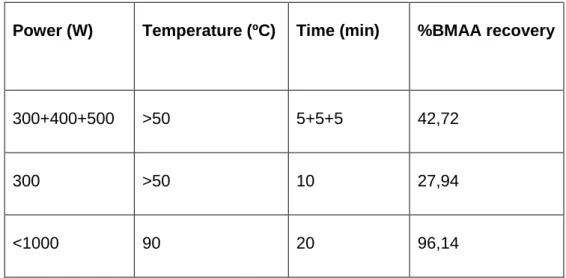
Table 5 shows the comparison of the 1000 µg/L BMAA standard recoveries, after different microwave-assisted hydrolysis.
Table 5. Comparison of the 1000 µg/L BMAA standard recoveries after
different microwave-assisted hydrolysis, with different time, temperature and powers.
Power (W) Temperature (ºC) Time (min) %BMAA recovery
300+400+500 >50 5+5+5 42,72
300 >50 10 27,94
<1000 90 20 96,14
By comparing the BMAA standard recoveries, it can be seen that the program with 90 ºC, 20 min and power limited to under 1000 W presents the best recovery, with 96,1%. The recovery percentages obtained with the BMAA standard shows that this extraction technique is suitable.
With these results, it was decided to compare the calibration curve of hydrolyzed standards of BMAA with the calibration curve of non-hydrolyzed aqueous standards and see if there was any difference between them. The figure 6 shows that comparison.
24 Figure 6. Calibration curve of BMAA standards hydrolyzed at 90 ºC during 20 min and
non-hydrolyzed aqueous standards. The trend line colored with dark pink correspond to the hydrolyzed standards and the trend line colored with light pink corresponds to non-hydrolyzed standards.
It can be seen that both exhibited the same calibration curve. The slopes were similar, meaning that there are practically no losses of BMAA during the hydrolysis. A t-test was made and no significant differences were observed.
Mussel samples spiked with BMAA standards were digested in the same way. The results obtained were compared with the BMAA hydrolyzed standards. The slopes obtained were statistically different (p ≤ 0,05) and for that reason the quantification of BMAA in mussel samples was made by using the calibration curve of mussels spiked with BMAA standard (figure 7).
y = 0,26x - 4,60 y = 0,27x - 14,75 0 100 200 300 0 200 400 600 800 1000 1200
A
reas
µg/L
Hydrolyzed standards Non-hydrolyzed standardsFigure 7. Calibration curves of hydrolyzed standards and hydrolyzed mussels. The trend
line colored with dark pink correspond to the hydrolyzed standards and the trend line colored with light pink corresponds to hydrolyzed mussels.
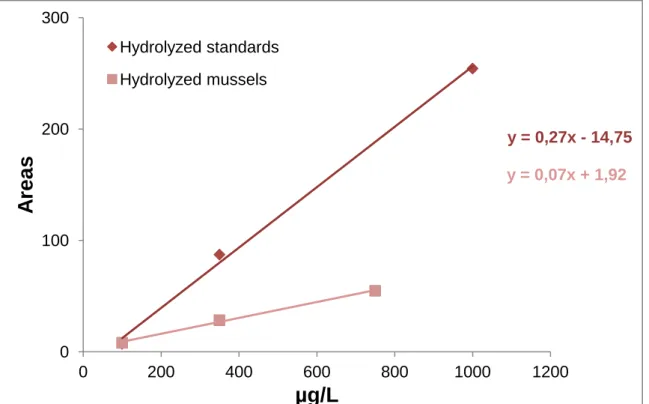
The same was made with G. umbilicalis, where it was compared the calibration curve of snails spiked with BMAA standard and the calibration curve of BMAA hydrolyzed standards (figure 8). y = 0,27x - 14,75 y = 0,07x + 1,92 0 100 200 300 0 200 400 600 800 1000 1200
A
reas
µg/L
Hydrolyzed standards Hydrolyzed mussels26 Figure 8. Calibration curves of hydrolyzed standards and hydrolyzed sea snails. The
trend line colored with dark pink correspond to the hydrolyzed standards and the trend line colored with light pink corresponds to hydrolyzed sea snails.
From the figure it is possible to see that the two curves are different. The slopes are significantly different (p ≤ 0,05), so, as it happened with mussels, the quantification of BMAA in sea snail samples was made by using sea snails spiked with BMAA standard.
3.2. Bioaccumulation of BMAA
3.2.1. Mussels exposed to BMAA standard
Mussels were able to bioaccumulate BMAA when they were exposed to three different concentrations of BMAA standard (1 mg/L; 2,5 mg/L and 5 mg/L) for 24 h and 48 h (figure 9). y = 25,63x + 672 y = 6,74x + 411 0 10000 20000 30000 0 200 400 600 800 1000 1200
A
reas
µg/L
Hydrolyzed standards Hydrolyzed sea snailsFigure 9. BMAA levels (µg/g) in mussels exposed for 24 h and 48 h to different
concentrations of BMAA (1 mg/L; 2,5 mg/L and 5 mg/L). Bars are the standard error (SE) of 4 replicates. * significantly different (p ≤ 0,05).
As expected, there was an increase of BMAA concentration over time and these levels were higher at 5 mg/L. There was a significant difference at 5 mg/L, in both 24 h and 48 h, in comparison with the other two concentrations. However, no significant differences were observed between 1 mg/L and 2,5 mg/L.
Table 6 presents the concentration of BMAA on mussels exposed to 1 mg/L; 2,5 mg/L and 5 mg/L for 24 h and 48 h, and also the uptake rate for each day. It is possible to see that the uptake rate is higher in the first 24 h for any concentration used, and that the uptake rate decreased during the second 24 h.
0 50 100 150 200 1 mg/L 2.5 mg/L 5 mg/L
B
M
A
A
i
n
mu
ssel (µ
g
/g
)
24h 48h * *28 Table 6. Concentration of BMAA (µg/g) on mussels exposed to 1 mg/L; 2,5 mg/L and 5
mg/L for 24 h and 48 h and the respective uptake rate. Mean ± standard error (SE) for the concentration of BMAA.
BMAA µg/g (24 h) Uptake rate µg/g/h (24 h) BMAA µg/g (48 h) Uptake rate µg/g/h (48 h) 1 mg/L 41,59 ± 4,27 1,73 52,19 ± 4,43 0,22 2,5 mg/L 50,62 ± 2,51 2,11 60,87 ± 5,03 0,21 5 mg/L 171,61 ± 17,01 7,15 176,08 ± 10,53 0,09
In figure 10 it is possible to see the deceleration of the uptake rates.
Figure 10. Concentration of BMAA (µg/g) in mussels exposed to 1 mg/L, 2,5 mg/L and 5
mg/L during 24 h and 48 h. 0 50 100 150 200 0 h 24 h 48 h
B
M
A
A
i
n
mu
ssel (µ
g
/g
)
Time (hours)
1 mg/L 2,5 mg/L 5 mg/L3.2.2. Animals fed with cyanobacteria
3.2.2.1. Cyanobacteria culture
Previous studies regarding BMAA production by cyanobacteria served as the basis for the choice of species (Cianca et al., 2012). To see how much BMAA would be incorporated by the species used for the bioaccumulation experiment, it was important to quantify the BMAA produced by the cyanobacteria strains used to feed these organisms. In case of mussels it was only possible to quantify the BMAA produced by each strain after the accumulation experiment.
Table 7 presents the quantification of BMAA in these strains. The strain of Nostoc sp. growth on BG1115N medium presented the highest concentration of BMAA. On the other hand, for S. salina, in both growth medium, the concentration of BMAA was lower than the limit of detection (LOD).
Table 7. BMAA quantification (µg/g) in cyanobacteria strains used to feed the marine
invertebrates. The different growth medium and organisms are also shown.
Strain Medium BMAA (µg/g) Organism fed
Nostoc sp. (LEGE#06077) BG1115N 131,78 G. umbilicalis Nostoc sp. (LEGE#06077) MN 43,09 G. umbilicalis Synechocystis salina (LEGE#06079) BG1115N <LOD G. umbilicalis Synechocystis salina (LEGE#06079) Z8 <LOD M. galloprovincilais
30
3.2.2.2. Mussels fed with cyanobacteria
Figure 11 presents the levels of BMAA in mussels digested with HCl and fed with cyanobacteria during 4, 8 and 10 days and 10 days of depuration. Although the concentration of BMAA was similar between 4 days and 8 days, it can be seen an increase of that level after 10 days. During the depuration period, there was a decrease of concentration of BMAA to 15,29 ± 0,66 µg/g . In terms of concentrations of BMAA, no statistically significant differences were observed between the different days of feeding (p ≤ 0,05). However, a significant difference was observed at the depuration period.
Figure 11. BMAA quantification (µg/g) in mussel samples exposed to BMAA 4, 8 and 10
days of feeding and 10 days of depuration and acid-digested. The columns colored with dark blue corresponds to the feeding period and the column with light blue correspond to the depuration period. Bars are the standard error (SE) of 3 replicates. * significantly different (p ≤ 0,05).
Figure 12 shows the uptake rate of BMAA by the mussels during the bioaccumulation experiment. This rate was calculated using the concentrations obtained with the samples acid-digested. It is possible to see that the rate was maximum in the first 4 days of feeding, followed by a decrease of the rate during the rest of the feeding period. During the depuration period, and as expected, there was no ingestion, because no cyanobacteria were given to the mussels.
0 10 20 30 40 50 60 0 4 8 10 20
B
M
A
A
i
n
mu
ssel (µ
g
/g
)
Time (days)
< LOD *Figure 12. Uptake rate of BMAA (µg/g/h) by mussels (acid-digested) during the
bioaccumulation experiment.
Figure 13 presents the BMAA quantification in mussel samples digested with pepsin.
Figure 13. BMAA quantification (µg/g) in mussel samples exposed to BMAA for 4, 8 and
10 days of feeding and 10 days of depuration and enzimatically digested with pepsin. The columns colored with dark pink correspond to the feeding period and the column with light pink corresponds to the depuration period. Bars are the standard error (SE) of 3 replicates. * significantly different (p ≤ 0,05).
0 2 4 6 8 10 0 4 8 10 20
U
p
take
rate
(µ
g
/g
/h
)
Time (days)
0 3 6 9 12 0 4 8 10 20B
M
A
A
i
n
mu
ssel (µ
g
/g
)
Time (days)
* *32 Figure 13 shows an increase of the concentration of BMAA during the feeding period, of which the highest concentration obtained was after 10 days with 8,08 ± 3,00 µg/g. A decrease during the depuration period was observed (2,29 ± 0,26 µg/g). No statistically significant difference was observed between 4 and 8 days (p ≤ 0,05). However, between 4 days and 10 days and between 10 days and 20 days (depuration period) was observed a significant difference (p ≤ 0,05).
Figure 14 presents the BMAA quantification in mussel samples digested with trypsin/chymotrypsin.
Figure 14. BMAA quantification (µg/g) in mussel samples exposed to BMAA during 4, 8
and 10 days of feeding and 10 days of depuration and enzymatically digested with trypsin/chymotrypsin. The columns colored with dark purple correspond to the feeding period. Bars are the standard error (SE) of 3 replicates.
From this figure, it can be seen that only at 4 days and 10 days were observed concentrations of BMAA. With 8 days and 20 days it was not possible to quantify the BMAA, since the concentrations were lower than de LOD. No significant differences were observed between 4 days and 10 days.
Table 8 shows the different concentrations of BMAA (µg/g) for the different days of exposure and for the different digestions used. It can be seen that the acid digestion was the one which removed more BMAA from the sample, followed by the pepsin digestion and the trypsin/chymotrypsin digestion.
0 2 4 6 8 0 4 8 10 20
B
M
A
A
i
n
mu
sse
l
(µ
g
/g
)
Time (days)
Table 8: BMAA quantification in mussels samples digested with HCl, pepsin and
trypsin/chymotrypsin. Mean ± standard error (SE) (3 replicates).
Samples HCl (µg/g) Pepsin (µg/g) Trypsin/chymotrypsin (µg/g) 4 days 32,92 ± 15,66 1,19 ± 0,19 1,79 ± 0,99 8 days 32,65 ± 7,93 5,32 ± 0,94 < LOD 10 days 41,92 ± 15,13 8,08 ± 3,00 5,79 ± 1,02 20 days 15,29 ± 0,66 2,29 ± 0,26 < LOD
The results obtained with samples digested with pepsin were similar with those obtained with acid digestion, in which an increase of the level of BMAA could be seen during the feeding period followed by a decrease during the depuration period. However, the concentrations showed in these samples were lower than the ones obtained with the acid digestion. With the samples digested with trypsin/chymotrypsin it was only possible to see BMAA after 4 and 10 days of feeding. For 8 days and depuration period no BMAA was possible to quantify, since the values were lower than the limit of detection. However, it was also possible to see that the concentrations of BMAA obtained with these samples were lower than the ones obtained with the acid-digestion and the pepsin digestion.
All the results concerning BMAA quantification were obtained with the measurement of underivatized samples.
For the derivatized samples no results were obtained. This happened because, although in some samples it was possible to see the peak of BMAA, it was not possible to quantify since they were lower than the limit of detection. For example, for the lowest standard BMAA used (10 µg/L) the area obtained was 146,8, whereas for sample of 10 days of exposure it was of 38,9. However, it was possible to see that the area of the peaks followed the sample trend as presented here.
Mussels collect at the beach and mussels fed with Chlorella sp. as control did not present BMAA.