http://www.uem.br/acta ISSN printed: 1679-9275 ISSN on-line: 1807-8621
Doi: 10.4025/actasciagron.v38i4.32629
Genes Software – extended and integrated with the R, Matlab and
Selegen
Cosme Damião Cruz
Laboratório de Bioinformática, Universidade Federal de Viçosa, Av. P H Rolfs, s/n, 36570-000, Campus Universitário, Viçosa, Minas Gerais, Brazil. E-mail: [email protected]
ABSTRACT. The Genes Software is useful for analyzing and processing phenotypic and molecular data using different biometric models. In the current version we dispose routines to integrate it with three other softwares: the R, Matlab and Selegen. This version allows in plant and animal breeding complementary analyzes in several breeding research fields as genomic selection, prediction of genetic values, use of neural networks and Fuzzy logic. The Genes is important to estimate parameters for understanding biological phenomena necessary to make decisions and predict the success and viability of strategic selection. The original programme can be downloaded in Portuguese, English or Spanish with the specific literature from (http://www.livraria.ufv.br/) and the user guide from (http://www.ufv.br/dbg/genes/genes.htm and http://www.ufv.br/dbg/biodata.htm). The user has also support in the address www.facebook.com/ GenesNews. The Genes is also integrated in the application softwares MS Word, MS Excel and Paint to efficiently import data and export results as numbers and figures.
Keywords: software, statistical analyses, genetic analyses, quantitative genetic, biometry.
Programa Genes – Ampliado e integrado aos aplicativos R, Matlab e Selegen
RESUMO. O programa GENES é um software destinado à análise e processamento de dados fenotípicos e moleculares por meio de diferentes modelos biométricos. Na versão atual estão disponibilizadas rotinas de integração com o software livre R e com os aplicativos Selegen e Matlab. Esta integração possibilita análises complementares em áreas diversas do melhoramento genético incluindo a seleção genômica ampla, predição de valores genéticos, o uso de redes neurais, e a lógica Fuzzy. O uso do programa Genes é de grande importância em estudos genéticos aplicados ao melhoramento vegetal e animal, por permitir obter estimativas de parâmetros para entendimento de fenômenos biológicos e fundamentais em processo de tomada de decisão e na predição do sucesso e viabilidade da estratégia de seleção. O programa é obtido pela rede Internet (http://www.ufv.br/dbg/genes/genes.htm ou http://www.ufv.br/dbg/biodata.htm) e está disponível nos idiomas português, inglês e espanhol. Conta com literatura específica (http://www.livraria.ufv.br/) e um conjunto de arquivos de exemplos, tornando-o de fácil utilização. O apoio ao usuário é feito via rede social no endereço www.facebook.com/ GenesNews. O programa GENES também está integrado aos aplicativos MS Word, MS Excel e Paint permitindo importar dados e exportar resultados, dados e figuras de forma simples e eficiente.
Palavras-chave: aplicativo computacional, análise estatística, análise genética, genética quantitativa, biometria.
Introduction
Researchers working with genetic, plants and animals breeding have paying attention on the Genes Software because of its various routines useful in several steps of the breeding programmes. Its programmes are based on three phases: first, when the aim is to form the base population for breeding traits with good responses, large variability, low genetic charge and good environmental adaptation; next, when the aim is to conduct segregant families to maximize the direct, indirect or simultaneous gains from important traits; and finally when the genetic material is available and the
researcher wants to recommend it to large or specific sites. In this case is fundamental to know the interaction genotype versus environment as well as the stability and adaptability of the genotypes. Currently, the Genes Software has about 386 routines in experimental statistics, biometry, multivariate analyses, genetic diversity, data simulation, matrices, and after amplification and improvements they have routines of genomics and computational intelligence with emphasis in neural networks and Fuzzy logic, prediction of genetic values by BLUP/REML and broad genomic selection (GWS).
biometric models for various data sets, and allows to the users processing data set to obtain responses to elucidate the phenomena under study. However, further and some different analyzes from the same data may be required. Thus, many users without expertise in informatics require a new alternative where none effort is need for particular understanding how to access this alternative or complement it using the software. Under this context, the new version of the Genes offers in its conventional environment the possibility of new analyzes using the resources from the R, Matlab and Selegen. After some straightforward configuration, the user can subject data to these softwares and the results will comeback in the Genes Software. No matters the phases as parameter identification, data processing or results appearance, the user will leave the Genes environment and he/she will see the environment of the software under demand.
Integrating the Genes with the R Development Core Team (2010) had great advantages because both softwares are free for downloading, and allow the analyses and the understanding cost-effectively the results with efficacy similar to other softwares. The R Software allows the researcher to develop routines and functions for statistical analyses and graphic displays. The R was developed in New Zealand by Ross Ihaka and Robert Gentleman (R Development Core Team, 2010), and currently it has various alternatives because of the efforts and collaboration from various researchers around the world. The base of the R is an interactive language for numerical calculus, data management, and graphic display. The calculus can be done using programmes and function already available, or routines with codes programmed by the user. In conjunction with this potential, the Genes Software has available a group of codes to link it to the R. As soon as the Genes Software has the results, it not only manages the data but it also shows them.
Integrating the Genes with the Matlab (Matlab, 2010) is important because the Matlab has potential to analyze experiments with numerous quantities of data despite their commercial characteristics. The Matlab has a broad library nominated toolboxes to attend specific areas as ordinary differential equations, statistics, images, and signal processing as well as finances. This integration has the aim of taking advantage from the current version for computational intelligence approaching, neural networks and Fuzzy logic in plant breeding.
Integrating the Genes with the Selegen software (Resende, 2002) is relevant because the Selegem
help tree breeding programs of forest species, but it can also be used in breeding programs of other perennial or semi-perennial species and animal where selection of individuais is more important than selection of groups of individuais. Selegen runs under IBM/PC-DOS and is based on algorithms which maximize efficiency of selection by comparing different selection methods in terms of accuracy, genetic gain, effective size of population, and genetic gain variables for each specific experimental situation, besides prediction of genetic values by BLUP/REML and broad genomic selection (GWS).
Description
The Genes Software has been used under the Windows System where it has compatibility with micro computers from the IBM PC and the following configuration: - resolution 1024 x 768 (normal sources 96), - decimal character expressed by the dot. It has 386 programmes and requires the space of 420 Mbytes. Additional and update information are available for users in the website http://www.ufv.br/dbg/genes/genes.htm where there is a support team in the social web www.facebook.com/GenesNews. The Software has an editor, but it also allows import data from the Excel and exports the results to the Word or Excel. Graphic resources can also be exported to the Mspaint. The use of resources after integrating the Genes with the current application softwares have to download and install a file in the following address c:\dados\ where there are various file examples and sub files with codes demanded by the Genes in the moment of the integrating the procedure with the other Softwares.
Basic programmes
The Genes has the following basic programmes based on the literature from Cruz (2006a; 2006b; 2006c; 2008).
- Experimental Statistics: provide resources for descriptive statistics, variance, regression, correlation, and comparative and agglomerative tests of means.
- Biometry: the aims are the interaction genotype x environment, stability and adaptability, environment stratification, diallel analysis, replicates, gains from direct and indirect selection and selection indices.
- Multivariate analyses: here, the aims are the analyses based on principal components, canonic variables, canonic correlation, factor analyses, and grouping and discriminant analyses.
genetic diversity based on continuous and discrete (binary and multi-categorical) phenotype data; molecular information related to dominant and codominant markers. The programme has a large number of procedures to calculate the dissimilarities among the population, discriminant analyses, cluster analyses, Hardy-Weinberg equilibrium, linking disequilibrium and calculus of fixation indices using different approaches.
Simulation: the Genes programme simulates experimental data from sampling, and the establishment of the optimum number of families, plants within families or replications.
Matrices: the software operates algebraic matrices, diagnosis of multicolinearity in correlation matrices and obtains general solution from linear regression models.
In this new version, I add broad improvement to become available new programmes besides those described by Cruz (2013) such as:
Genomics: The genomic analysis in agronomy and animal production has the aim of constructing saturated genetic maps in various species and found genes (named locus of quantitative characteristics or QTL) that are responsible by the genetic variation in interest characteristics from plants and animals (Liu, 1997, Schuster & Cruz, 2004). The majority of genes named polygenic characteristics, quantitative or complex heritage and their study at molecular level has enormous interest in science. Thus, quantitative and molecular data analyses have in the Genes the following programmes:
Analyses of population from controlled crosses
Populations for genetic mapping and detection of QTLs (Quantitative Trait Loci) is named mapping population and can be obtained from controlled crosses or natural populations (exogamic populations). The software allows the analysis of data from derived population in controlled crosses where there is contrastant homozygote genitors as F2, F3, ... , and Fn, RILs, retro-crosses and double haploids. The following programmes are available:
- Mendelian test of segregation for every marker; - Linking map for every population;
- QTL analysis using simple mark; - QTL analysis using simple interval; - QTL analysis using compound intervals; - Interaction analysis of QTL x environment; - Integration of genetic maps;
Analyzes from exogamic population
The software has resources to study in-depth the genetic mapping including information from molecular markers, codominant multiallelics in
exogamic populations from one or several families of half- and complete offsprings, and technique of QTLs detection in these populations using the following analyses:
- Mendelian segregation test for every marker; - Calculus of the identity value by descendence (IBD) from every marker;
- Linking maps;
- QTL analysis by contrast of means;
- QTL analysis by Haseman and Elston method (Haseman & Elston, 1972);
- QTL analysis by Fulker and Cardon method (Fulker & Cardon, 1994);
Genome simulation
In this programme, the user can make comparative studies of techniques, models and selection strategies applied to genome from different species using traits as: the number of linking groups, the size of every group, and number of molecular marks in every linking group. It also allows the simultaneous simulation of dominant and codominant multiallelics marks; linking phase; number and position of the QTLs; genic action from QTLs and environmental effect on the mean and phenotypic variance.
- Genome simulation from different species and from a basic number of chromosomes and genome size;
- Simulation of genitor genotypes. The user may establish genitor genotypes take into account the inclusion of crosses completely or partially informative as well as the establishment of molecular marks in the linking groups, distance between the marks and linking phases;
- Simulation of population from different types (derivatives from controlled crosses or exogamic) with different size to establish the optimum value to study the mapping and compare the methodological efficacy in the establishment of the genetic map and procedures to detect the QTLs;
- Simulation of quantitative characteristic of polygenic control with additive-dominant effects, mean, variability and the herdability known or established by the user.
Computer intelligence
and searching implement their functional performance and dynamic (Haykin, 2001). This procedure is an alternative to the conventional algorithm methodology because it is not based on rules. A conjunct of artificial connected neurons is suitable to solve problems of high complexity. In the Ceres, the user can find the following routines:
- Artificial techniques of neural network applied to the following studies:
- Classified studies with emphasis in the diversity among populations;
- Prediction studies with emphasis in model fitting;
- Forecasting studies with emphasis in the temporal analysis;
- Prediction of genomic values using phenotype and molecular analyzes;
- Prediction of phenotypic studies using experimental statistics.
- Techniques of Fuzzy logic applied to studies of stability and adaptability;
- Analytical techniques for the Kohonen maps.
Configuration of Genes to integrating with other softwares
The first step is to install the Matlab and R Software in the computer. The procedure for integrating the analysis is in the data files available in the address ftp.ufv.br/dbg/bioinfo. Next, the user has to indicate to the Genes Software, the trail where these routines are available. Thus, the user has to access the screen with the data trail definition based on the following image (Figure 1):
Figure 1. Setting screen of the path of data and path of other applications
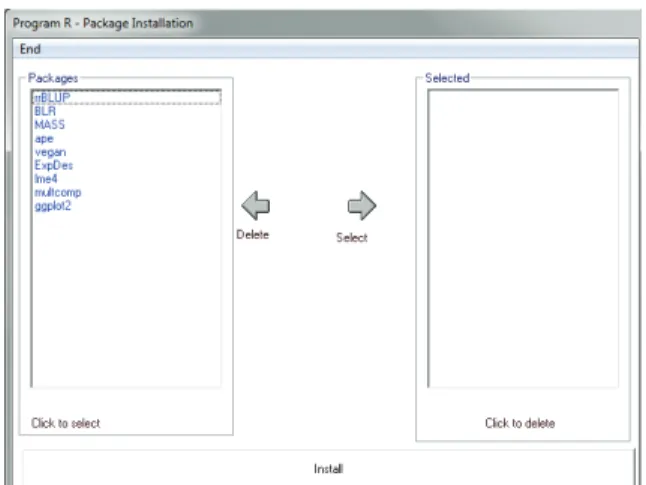
The user have to use the digit “?” to allow the Genes search the trail of the routine required for the analysis. I highlighted the needs of installing the Adobe Reader because it will be useful to access the graphic exit from R Software. Some programmes require specific library and have to be first installed to achieve the necessary aims. Thus, the user has to access the procedure integration in the tool bar and make a choice in the alternative install R programmes to access the screen (Figure 2).
Figure 2. Screen to R program package installation
Thereafter, they have to type the key “Install” to achieve automatic access to the internet network.
Available resources after integrating the R Software.
Some highlighted routines are:
- Variance and regression analyses of factorial experiments, simple and triple, using quantitative and qualitative figures. The analysis is finished with mean tests for qualitative and polynomial regression for the quantitative data;
- Non parametric analysis based on the test from Friedman, Kruskal-Wallis, Wilcoxon, Wilcoxon and Mann Whitney and Spearman or Kendall correlations.
- Analysis of principal coordinates;
- Stability and adaptability by the AMMI (additive main effect and multiplicative interaction) method;
- Broad genomic selection using the RR-Blup and GBlup
- Prediction of genetic and environmental progress by the Breseghello, Morais, and Rangel (1998) method;
- Prediction of genetic value using ASReml-Blup;
- Cluster analysis by hierarchic methods;
- Philogenetic trees based on dissimilarities matrices;
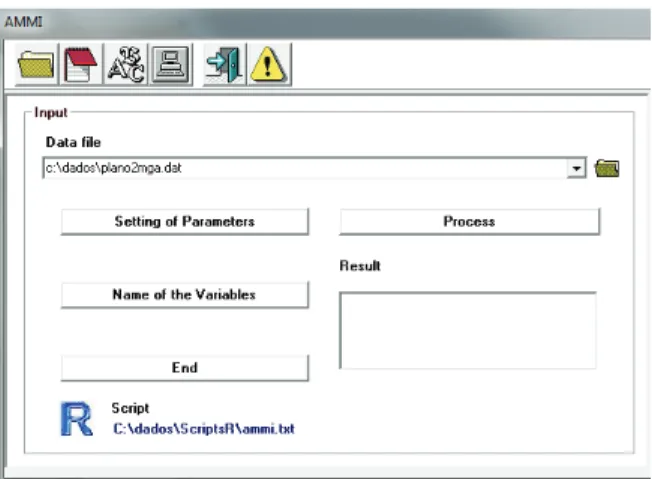
stability and adaptability using the AMMI method, after integrating the Genes with the R software. Thus, in the “Biometry” method, the user will find, within the routines to analyze stability and adaptability, the routine “AMMI”, and he/she will access the entrance screen (Figure 3):
Figure 3. Access screen AMMI application
In this screen there are the following alternatives: - Data files: the user provide the data file to analyze the stability and adaptability where the first two columns are used to codify the genotypes and the environments, and the next will describe the traits under analysis. Typing the key where there is a yellow triangle with the symbol “!”, the user will have access to the example file (available in the file c:\dados, already available in the user computer), to illustrate the analysis.
- Traits information: Access to the necessary screen to inform about the analyses. One logotype with one icon representing “one hand” giving access to the Genes characterizes the file. See the following screen as example (Figure 4):
Figure 4. Access screen parameters statement
- Trait names: nominate the name of the dependent variables to be analyzed.
- Processing: command key to allow the integration of the Genes and R Softwares. Typing this key, the analyze will be done and will appear in
the box “Result” one list of files allowing the access to graphic and AMMI results.
Available resources after integrating the Genes with the Matlab
The following resources will be available:
- Procrustes analysis: technique to compare the standard of the dispersion;
- RNA – discriminant analysis: computational intelligence for classificatory analysis or to recognize the variability among the populations;
- RNA – Model fitting: Computational intelligence to predict response variables based on a cluster of explanatory or independent variables;
- RNA – GWS: Computational intelligence for predict genomic values based on phenotypic and molecular information from individuals in one population;
- RNA – Anova: Computational intelligence to predict genomic values based on phenotypic and aggregating information from the experimental mean and other statistics from the experiment;
- RNA – Temporal analysis: Computational intelligence to predict performance based on information from other variables along the past time;
- Fuzzy – Eberhart and Russell. Fuzzy logic to recommend cultivar for specific and general environments;
- Fuzzy – Eberhart, Russell/Lin and Binns: Fuzzy logic to recommend cultivar for specific and general environments;
- Kohonen maps: Programme to generate the self-organized map allowing the dimensional organization from complex data in clusters.
As example, I will consider the discriminant analysis of RNA using the resources of integrating the Genes and Matlab Softwares. One principal screen is illustrated showing the possibility of establishing (Figure 5), in the Genes, training files and validation from a base file under analysis. These files may be generate by techniques for subdividing or amplifying data, but preserving means, maximum, minimum and the covariance matrix from the original data.
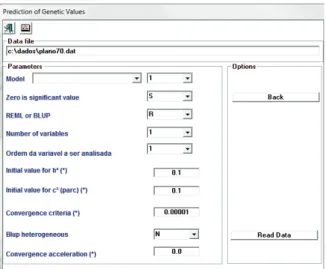
Figure 5. Access screen for establishing the net architecture Resources available after integrating the Selegen Software
The SELEGEN REML/BLUP Software (Resende, 2002) was developed as a base for breeding perennial plants and it allows working with several reproductive systems and selection methods. The aim is to predict genetic values from individuals of families, estimate genetic parameters, guide the choice of individuals to obtain the maximum of immediate genetic progress, but with compatibility with the genetic variability to maintain the breeding programme in a long term. The integration of both softwares make possible to predict the genetic values in experiments of individuals and families in randomized complete blocks and lattices. The screen for showing the parameters to connect the softwares is (Figure 6):
Figure 6. Access screen for establishing of parameter in Selegen aplicative
Conclusion
The Genes Software has been an essential computer effortlessness facility allowing researchers to analyze data from experiments and produce information useful to breeding programmes. Access to alternative procedures
or specifically analyzes was broadened and easily made available from the Genes codes to allow the user ongoing his/her analyzes in other softwares as the R, Matlab and Selegen. A routine to genomic analyzes was also integrated into the programme.
Acknowledgements
The author gratefully acknowledges FAPEMIG, CAPES and CNPq for their financial supporting.
References
Breseghello, F., Morais, O. P., & Rangel, P. H. N. (1998). A new method to estimate genetic gain in annual crops. Genetics and Molecular Biology, 21(4), 551-555. Cruz, C. D. (2013). Genes - a software package for
analysis in experimental statistics and quantitative genetics. Acta Scientiarum. Agronomy35(3), 271-276. Cruz, C. D. (2006a). Programa Genes – Estatística
Experimental e Matrizes. Viçosa, MG: UFV.
Cruz, C. D. (2006b). Programa Genes - Biometria. Viçosa, MG: UFV.
Cruz, C. D. (2006c). Programa Genes - Análise multivariada e simulação. Viçosa, MG: UFV.
Cruz, C. D. (2008). Programa Genes - Diversidade Genética. Viçosa, MG: UFV.
Fulker, D. W., Cardon, L. R. (1994). A sib-pair approach to interval mapping of quantitative trait loci. American Journal of Human Genetics, 54(3), 1092-1103.
Haseman, J. K., & Elston, R. C. (1972). The investigation of linkage between a quantitative trait and a marker locus. Behavior Genetics, 2(1), 3-19.
Haykin, S. S. (2001). Redes neurais: princípios e práticas (2a ed., Paulo Martins Engel, trad). Porto Alegre, RS: Bookman. Liu, B. H. (1997). Statistical genomics: linkage, mapping, and
QTL analysis. Boca Raton, FL: CRC Press.
Matlab. (2010). Version 7.10.0 [Software]. Natick, MA: The Math Works Inc.
R Development Core Team. (2010). R: A language and environment for statistical computing [Software]. Vienna, AT: R Foundation for Statistical Computing.
Resende, M. D. V. (2002). Software Selegen–REML/BLUP (p. 67, Documentos 77). Curitiba, PR: Embrapa Florestas. Schuster, I., & Cruz, C. D. (2004). Estatística genômica
aplicada a populações derivadas de cruzamentos. Viçosa, MG: UFV.
Received on July 8, 2016. Accepted on July 11, 2016.