Introduction
Aging has been associated with increases in occurrence of chronic diseases and reductions in physical fitness, including decreases in strength and aerobic fitness1,2,3. Hypertension figures among
the main problems in aging, since it is an important risk factors for the occurrence of cardiovascular disease with subsequent target organ damage4,5,6, and affects more than 50% of those
aged 65 years or older7,8.
Changes in lifestyle due to exercise can contribute to the miti -gation of functional decline and therefore decrease the prevalence of systemic arterial hypertension (SAH) in this population9,10.
One type of exercise, which has gained support in health stud -ies in the recent decades, is resistance training (RT), which is based on efforts made against a specific resistance and aims to increase power, strength and/or muscle endurance over time2,9.
In addition, some studies have shown significant reductions in resting blood pressure (BP) after dynamic and isometric RT, and have suggested that four weeks of RT may contribute to the treatment and / or prevention of SAH11,12,13. Suggesting that iso
-metric RT may have a potential for the largest reductions in BP13,14.
Therefore, isometric RT has emerged as an alternative exercise modality to improve BP. Its use has been supported by different meta-analyses11,13, and was recently included in
important scientific statements as a promising useful tool in the management of BP. In which mechanisms that result in possible decreases in BP after intervention include neural (sympatho-vagal activity), vascular (endothelial function) and inflammatory adaptations12,14
.
However, the majority of studies have employed isometric handgrip exercise14, and it is still unclear if other forms of iso
-metric exercise also improve BP. Recent studies suggest that isometric exercises including larger muscle mass could potentiate BP decreases15 and also improve health-related physical fitness,
including strength9 and aerobic fitness2,3,16. Very few trials using
isometric RT with a duration of over 10 weeks are reported12,14,
so the responses of BP beyond this period are still unknown, especially when compared to dynamic RT. Thus, this emphasizes the need for further studies.
Most studies with isometric RT that showed reductions in BP have involved small muscle groups14. However, recent strate
-gies have begun to use large muscle groups both acutely17,18 and
chronically15, but they do not report gains in physical fitness. Therefore, the present study hypothesized that isometric RT involving large muscle groups could generate benefits beyond BP, and improve other aspects related to health, especially with the advancing of age. Hence, the present study aimed to inves -tigate the effects of whole body isometric RT on BP, strength and aerobic fitness. We also analyzed whether the effects of whole body isometric RT compares to whole body dynamic RT.
Methods
Experimental Approach to the Problem
In order to analyze the effects of whole body isometric resis -tance training in BP, strength and aerobic fitness, subjects were divided in a control group and two resistance programs: isometric Original Article (short paper)
Effects of isometric resistance training on blood pressure
and physical fitness of men
Flavio de Souza Araujo1, Raphael Mendes Ritti Dias2, Reginaldo Luiz do Nascimento1, Eduardo Seiji Numata Filho1,
José Fernando Vila Nova de Moraes1, Sérgio Rodrigues Moreira1
1Universidade Federal do Vale do São Francisco, UNIVASF, Petrolina, PE,
Bra-zil; 2Universidade Nove de Julho, São Paulo, SP, Brazil
Abstract — Aims: The present study aimed to investigate the effects of whole body isometric resistance training (IRT)
on blood pressure (BP), strength and aerobic fitness. We also analyzed whether the effects of whole body isometric training compares to whole body dynamic resistance training (DRT). Methods: Twenty-nine pre-hypertensive sedentary
males, aged between 40 and 60 years were divided into three groups: IRT (n = 10), DRT (n = 9), and Control (n = 10). Both programs involved whole body resistance training, and occurred for 12 weeks, three times/week, at an intensity of 60% of a dynamic one repetition maximum test (1RM). Before and after 12 weeks, 24 hours blood pressure monitoring, 1RM strength and aerobic fitness were assessed. Results: IRT reduced diastolic BP values during a 24-hour period
and daytime. There was also a decrease in mean BP values during daytime (P < 0.05). No interaction between time and group in systolic BP, diastolic BP, mean BP, heart rate and arterial stiffness index were observed (P > 0.05). IRT increased strength and aerobic fitness when compared to Control group. However, these changes were lower than DRT regarding strength (DRT: ∆ = 43.1±10.6% vs. IRT: ∆ = 24.1±7.1% vs. CON: Δ = 4.2±11.5%; P < 0.05) and aerobic fitness (DRT: ∆ = 22.9±10.7% vs. IRT: ∆ = 12.9±6.1% vs. CON: Δ = -2.1±7.4%; P < 0.01). Conclusion: Whole body
IRT reduced diastolic BP and mean BP, however, the decrease was not different for the DRT group. IRT also increased strength and aerobic fitness, nevertheless, these changes were lower than after DRT.
resistance training (IRT) and dynamic resistance training (DRT). Both programs involved whole body resistance training (RT), and occurred for 12 weeks, three times/week, at an intensity of 60% of a dynamic one maximum repetition test (1RM), and lasted approximately 45 minutes per session. Before and after 12 weeks, 24 hours BP monitoring, 1RM strength and aerobic fitness were assessed. The effects of IRT were compared with an active (DRT) and an inactive Control group.
Subjects
The sample included 29 sedentary males, aged between 40 and 60 years (Table 1). Based on the pairing of age and baseline BP, the participants were allocated, by convenience, in three distinct groups, being: IRT (n = 10), DRT (n = 9), and Control (n = 10). Subjects were included if they: were pre-hypertensive during 24 hours BP monitoring5,19; ii) presented systolic and
diastolic BP < 160 and/or < 105 mmHg, respectively; iii) did not present abnormal resting electrocardiogram, and cardiometabolic
diseases or osteomuscular limitations. After inclusion, subjects were excluded if they did not attend at least 80% of RT sessions.
Before enrollment, subjects were informed of the benefits and risks of the investigation and signed an informed consent form, which was previously approved by the Committee on Ethics and Deontology in Research from the University Federal do Vale do São Francisco (Protocol number 1,141.198). After consent, the subjects were divided into groups and sent to perform the baseline procedures of the research.
Participants answered an anamnesis regarding health history and anthropometric variables: 1) Weight and Height were veri -fied by a digital scale with a stadiometer (Lider®, model P-200)
with precision of 0,1 kg and 0.1 cm; 2) body mass index was calculated; 3) waist and abdominal circumference were measured by an inextensible metal (Cescorf®) tape with a precision of
0.1 cm in the region of least curvature between the last costal arch and the iliac crest and umbilical scar respectively20. Table
1 shows the characteristics of sample. Groups were similar at baseline (P > 0.05). Figure 1 shows the flowchart of the study of subjects in each group.
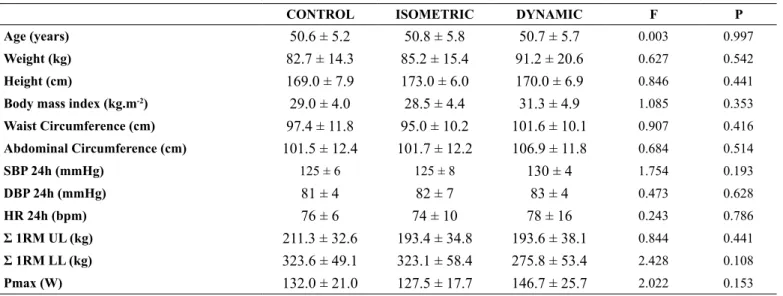
Table 1. Mean (±SD) of the sample’s main characteristics.
CONTROL ISOMETRIC DYNAMIC F P
Age (years) 50.6 ± 5.2 50.8 ± 5.8 50.7 ± 5.7 0.003 0.997
Weight (kg) 82.7 ± 14.3 85.2 ± 15.4 91.2 ± 20.6 0.627 0.542
Height (cm) 169.0 ± 7.9 173.0 ± 6.0 170.0 ± 6.9 0.846 0.441
Body mass index (kg.m-2) 29.0 ± 4.0 28.5 ± 4.4 31.3 ± 4.9 1.085 0.353
Waist Circumference (cm) 97.4 ± 11.8 95.0 ± 10.2 101.6 ± 10.1 0.907 0.416
Abdominal Circumference (cm) 101.5 ± 12.4 101.7 ± 12.2 106.9 ± 11.8 0.684 0.514
SBP 24h (mmHg) 125 ± 6 125 ± 8 130 ± 4 1.754 0.193
DBP 24h (mmHg) 81 ± 4 82 ± 7 83 ± 4 0.473 0.628
HR 24h (bpm) 76 ± 6 74 ± 10 78 ± 16 0.243 0.786
Σ 1RM UL (kg) 211.3 ± 32.6 193.4 ± 34.8 193.6 ± 38.1 0.844 0.441
Σ 1RM LL (kg) 323.6 ± 49.1 323.1 ± 58.4 275.8 ± 53.4 2.428 0.108
Pmax (W) 132.0 ± 21.0 127.5 ± 17.7 146.7 ± 25.7 2.022 0.153
BMI: Body mass index; C: Circumference; SBP: Systolic blood pressure; DBP: Diastolic blood pressure; HR: Heart rate; Σ 1RM UL: Sum of one-repetition maximum test of upper limb; Σ 1RM LL: Sum of one-repetition maximum test of lower limb; Pmax: Maximum aerobic power.
Figure 1. Flowchart of the sample.
Assessed for eligibility (n = 40)
Excluded (n = 04)
Anamnesis (n=02) Change in ECG (n=01) Not meet the criteria to ABPM (n=01)
Final sample (n = 36)
Control Group (n = 10)
Isometric Group (n = 13)
Dynamic Group (n = 13)
Excluded by frequency (n = 04)
Dynamic Group (n = 09) Isometric Group
(n = 10) Excluded by frequency
(n = 03) Excluded
(n = 00)
Control Group (n = 10)
Recruitment
Allocation
Continuation
Analysis
ECG: Resting electrocardiogram; ABPM: Ambulatory blood pressure monitoring.
24 hours Blood Pressure Monitoring and Heart Rate
Heart rate (HR), systolic BP, diastolic BP and mean BP were obtained over 24 hours using an ambulatory BP monitor (Meditech/04 British Hypertension Society)19,21,22, placed on the
One Repetition Maximum Test (1RM)
1RM test was performed at baseline, after 6 weeks (to readjust the workloads in the exercises of RT groups) and after 12 weeks in all exercises of the RT program. The protocol of the 1RM test started with two sets of warm-up followed by a recovery period of 2 minutes, being one with 15 to 20 repetitions between 40-60% and another with 5 to 10 repetitions between 60-80% of the estimated 1RM load. After 2 minutes of recovery the load was increased for the first test attempt. Subjects were asked to perform one repetition. If the participant was able or not able to overcome the resistance offered the load was increased or decreased, respectively, and the next attempt was performed after 3 to 5 minutes. The maximal of 4 attempts were allowed in the same session. Prior to the 1RM test, two sessions of fa -miliarization with the strength equipment were performed and each participant performed the tests always in the same period of the day26,27.
Aerobic Fitness
For the evaluation of aerobic fitness a maximal aerobic incre -mental test (MAIT) in a cyclergometer was performed (Biotec 2100, Cefise/SP-Brazil). The test began with a warm-up of 1 minute without load, followed by increments of 15 watts at each stage of 3 minutes. The participants were instructed to maintain a frequency of 60 rpm’s during the entire test until voluntary exhaustion or not being able to maintain the pre-established rotation. The last stage of the test was considered valid when the individual remained at least one minute in the stage. During
the test, rate of perceived exertion (RPEmax)28, aerobic power
(Pmax) 29 and, maximum heart rate (HRmax) (Polar® RS800CX,
Electro Oy, Kempele, Finland) were obtained.
Resistance Training Programs
Resistance training programs lasted 12 weeks, and were performed three times/week, using 3 sets of 60%1RM. The training was performed in a circuit method, using the exercises: bench press machine, leg extension machine, front pull-down, leg curl machine, shoulder press machine and leg press (Evidence, Cachoeirinha/RS-Brazil; Physicus, Auriflama/SP-Brazil). There was a 90 second resting period between exercises, and 120 second rest between circuit sets.
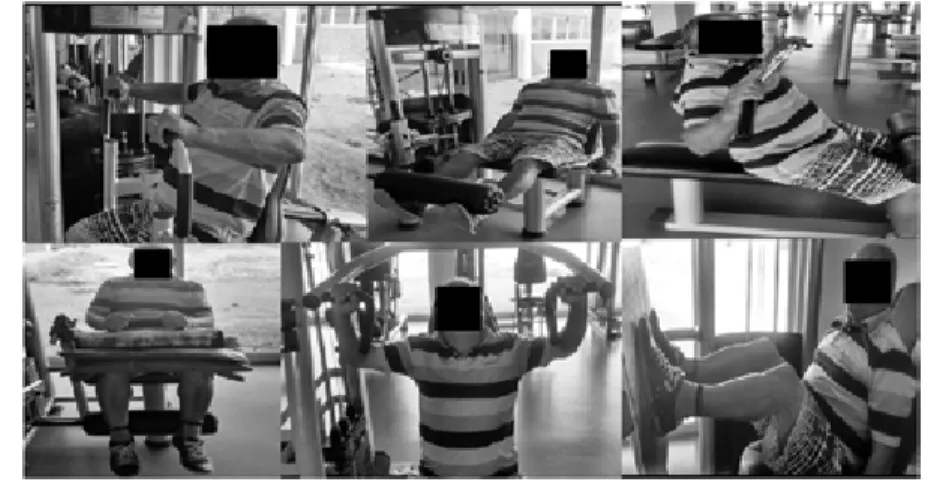
The IRT group performed a static muscle action standardized at a single disadvantage angle for all subjects (Figure 2)30. The
time of isometric muscle action was 36 seconds for lower limb (LL) exercises and 24 seconds for upper limb (UL) exercises. The DRT included 12 repetitions for LL exercises and 8 repeti -tions for UL exercises. Each repetition lasted 1 second in the concentric and 2 seconds in eccentric actions. Thus, the duration of IRT was similar to the time required for completing the sets in the DRT. The Control group did not perform exercise during the intervention period.
During the interventions, participants were instructed to maintain their nutritional routines, without any counseling by the researchers. In addition, participants of IRT and DRT did not participate in any other exercise intervention during the period of study. Figure 3 shows the experimental procedures in the timeline during the intervention.
Figure 2. Exercises performed in the circuit, standardized at a single disadvantage angle to isometric training.
Figure 3. Experimental design.
Control
Isometric PA and
Anamnesis ECG ABPM MAIT F1 F2 lRM
Isometric
W1 W2 W3 W4 W5 W6 W7 W8 W9 W10 W11 W12
PA ABPM MAIT lRM
Control
Isometric
Dynamic Dynamic
3 sessions/week Dynamic
Statistical Analysis
Descriptive statistics with mean and standard deviation were performed. The normality of data distribution was tested through the Shapiro-Wilk test. The Levene test was used to verify the homogeneity of variance between groups in pre and post-intervention. ANOVA (one-way) was used to analyze variables at baseline and the percentage of variation in strength. BP, HR, AASI, strength individuals exercises and aerobic fitness were analyzed using a ANOVA (two-way) with a mixed design to verify the effect of the interaction time (Pre vs. Post) x group (IRT, DRT and Control) in addition to the main effect of time in different groups. The results of “F-ratio” and “P” were reported. Bonferroni’s post-hoc correction was applied for the identifica -tion of pairs of difference and the “P” value was considered.
The alpha was set at 5% and the software used was SPSS 22.0 for Windows (SPSS, Inc., Chicago, IL).
Results
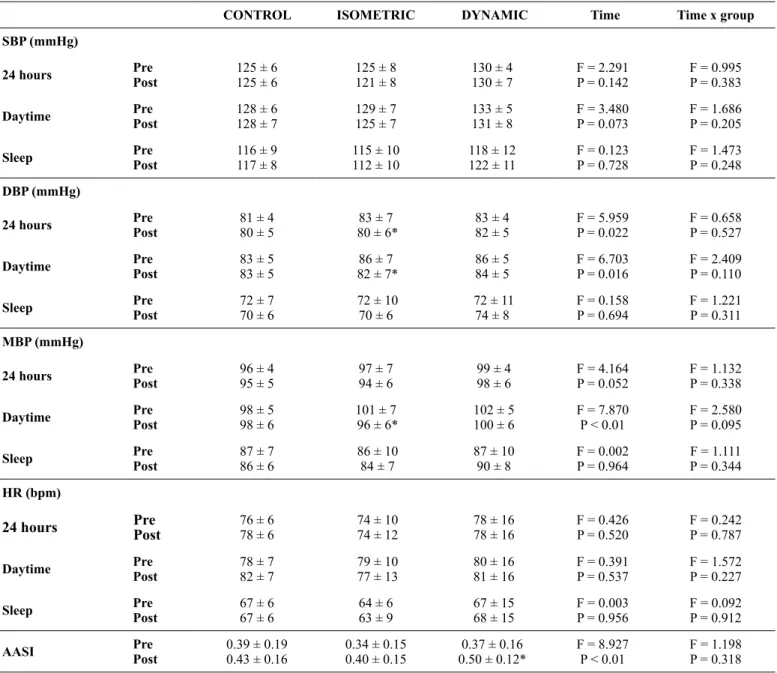
Table 2 presents the 24 hours BP results. No interactions between time x group were observed in systolic BP, diastolic BP, mean BP, heart rate and arterial stiffness index (P > 0.05). However, there was a main effect of time indicating a reduction in diastolic BP values in IRT group during 24 hours (P = 0.022) and during daytime (P = 0.016), as well as mean BP during day -time (P < 0.01). Table 2 also shows that unlike IRT and Control (P > 0.05), in DRT there was a main effect of time indicating an increase of AASI (P < 0.01).
Table 2. Mean (±SD) of blood pressure, HR and AASI response according to the intervention and considering the different periods of the day.
CONTROL ISOMETRIC DYNAMIC Time Time x group
SBP (mmHg)
24 hours Pre
Post
125 ± 6
125 ± 6 125 ± 8121 ± 8 130 ± 4130 ± 7 F = 2.291P = 0.142 F = 0.995P = 0.383
Daytime Pre
Post
128 ± 6
128 ± 7 129 ± 7125 ± 7 133 ± 5131 ± 8 F = 3.480P = 0.073 F = 1.686P = 0.205
Sleep Pre
Post
116 ± 9
117 ± 8 115 ± 10112 ± 10 118 ± 12122 ± 11 F = 0.123P = 0.728 F = 1.473P = 0.248
DBP (mmHg)
24 hours Pre
Post
81 ± 4
80 ± 5 80 ± 6*83 ± 7 83 ± 482 ± 5 F = 5.959P = 0.022 F = 0.658P = 0.527
Daytime Pre
Post
83 ± 5
83 ± 5 82 ± 7*86 ± 7 86 ± 584 ± 5 F = 6.703P = 0.016 F = 2.409P = 0.110
Sleep Pre
Post
72 ± 7
70 ± 6 72 ± 1070 ± 6 72 ± 1174 ± 8 F = 0.158P = 0.694 F = 1.221P = 0.311
MBP (mmHg)
24 hours Pre
Post
96 ± 4
95 ± 5 97 ± 794 ± 6 99 ± 4 98 ± 6 F = 4.164P = 0.052 F = 1.132P = 0.338
Daytime Pre
Post
98 ± 5
98 ± 6 96 ± 6*101 ± 7 102 ± 5 100 ± 6 F = 7.870P < 0.01 F = 2.580P = 0.095
Sleep Pre
Post
87 ± 7
86 ± 6 86 ± 10 84 ± 7 87 ± 10 90 ± 8 F = 0.002P = 0.964 F = 1.111P = 0.344
HR (bpm)
24 hours Pre Post 76 ± 678 ± 6 74 ± 10 74 ± 12 78 ± 16 78 ± 16 F = 0.426P = 0.520 F = 0.242P = 0.787
Daytime Pre
Post
78 ± 7
82 ± 7 79 ± 10 77 ± 13 80 ± 16 81 ± 16 F = 0.391P = 0.537 F = 1.572P = 0.227
Sleep Pre
Post
67 ± 6
67 ± 6 64 ± 663 ± 9 67 ± 15 68 ± 15 F = 0.003P = 0.956 F = 0.092P = 0.912
AASI Pre
Post
0.39 ± 0.19
0.43 ± 0.16 0.34 ± 0.150.40 ± 0.15 0.50 ± 0.12*0.37 ± 0.16 F = 8.927P < 0.01 F = 1.198P = 0.318
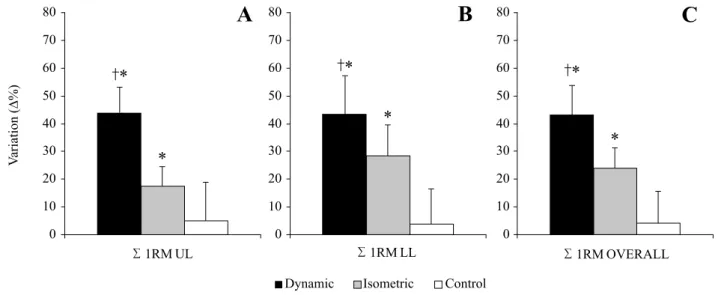
Figure 4 shows the changes in 1RM strength. Time x group interactions were observed for UL and LL exercises. Changes in strength were greater after DRT when compared to other groups (P<0.05). In addition, increases in strength after IRT were greater than Control group (P < 0.05). Table 3 presents the mean values of strength obtained through the dynamic one-repetition maximum
test, in each exercise, analyzed in separate, in the different inter -ventions. There was a main effect of time indicating an improve -ment of strength in IRT and DRT (P < 0.05), and no difference in the Control group (P > 0.05). However, when comparing time x group effects, the DRT obtained greater gains than IRT in the exercise Bench press machine and Front pull-down (P < 0.05).
Table 3. Mean (±SD) of strength (kg) obtained through a dynamic one-repetition maximum test, in each exercise, in the different interventions.
CONTROL ISOMETRIC DYNAMIC Time Time x group
Bench press machine Pre
Post
56.6 ± 10.6
56.7 ± 11.2 57.6 ± 8.4*49.4 ± 7.9 74.8 ± 12.0*†49.9 ± 12.9 F = 35.170P < 0.01 F = 14.889P < 0.01
Leg extension machine Pre
Post
123.6 ± 17.7
121.9 ± 13.5 130.2 ± 23.3*103.4 ± 19.3 155.1 ± 32.1*#111.1 ± 24.0 F = 49.957P <0.01 F = 16.601P <0.01
Front pull-down Pre
Post
67.0 ± 13.4
70.5 ± 10.93 67.0 ± 10.5*59.5 ± 8.8 81.4 ± 9.7*‡61.8 ± 10.2 F = 91.923P <0.01 F =20.157P <0.01
Leg curl machine Pre
Post
87.7 ± 12.8
90.4 ± 14.5 95.5 ± 16.9*81.4 ± 13.1 107.2 ± 25.0*79.9 ± 19.1 F = 89.981P < 0.01 F = 20.659P < 0.01
Shoulder press machine Pre
Post
87.7 ± 16.4
94.0 ± 19.9 101.9 ± 21.1*84.5 ± 20.5 118.9 ± 22.1*#81.9 ± 19.9 F = 270.935P < 0.01 F = 51.955P < 0.01
Leg press Pre
Post
112.3 ± 35.9
119.0 ± 17.9 186.1 ± 29.3*#138.3 ± 39.4 § 129.8 ± 20.4*84.7 ± 17.9 F = 52.037P < 0.01 F = 8.505P < 0.01
* P < 0.01 to Pre in the same group; † P < 0.01 to Post ISOMETRIC and CONTROL; # P < 0.05 to Post CONTROL; ‡ P < 0.05 to Post ISOMETRIC; § P < 0.05 to Pre DYNAMIC.
Figure 4. Mean (±SD) of variation percentage (∆%) of strength obtained through of one-repetition maximum test at the different interventions.
∑1RM UL ∑1RM LL ∑1RM OVERALL
A
B
C
*
*
*
*
*
*
80
70
60
50
40
30
20
10
0
80
70
60
50
40
30
20
10
0
80
70
60
50
40
30
20
10
0
Variation (∆%)
Dynamic Isometric Control
Σ 1RM UL: Sum of One-repetition maximum test of upper limb; Σ 1RM LL: Sum of One-repetition maximum test of lower limb; Σ 1RM OVERALL: Sum of
one-repetition maximum test of all exercises. †P < 0.05 to Isometric; *P < 0.05 to Control.
The aerobic fitness results are presented in table 4. A time x group interaction was observed in Pmax indicating superior results for the DRT group when compared to IRT and Control
Discussion
The main results of the present study were that 12 weeks of whole body IRT reduced diastolic BP values during daytime and during a 24-hour period. There was also a decrease in mean BP values during daytime. However, there were no differences for the DRT group. Moreover, IRT increased strength and aero -bic fitness in pre-hypertensive middle-aged subjects. But, the increases in strength and aerobic fitness were lower than DRT.
Previous meta-analysis studies11,12,13 have consistently
de-scribed positive effects of isometric training in reducing BP in normotensive, pre-hypertensive and hypertensive subjects. The main explanation for the controversy are the differences in the protocols employed, since most studies that observed significant decreases in BP employed isometric handgrip training, in 4 sets of 2 minutes with 30% of maximal voluntary contraction. This protocol contrasts with the whole body, circuit isometric training with 60% of 1RM and with sets lasting less than 1 minute used in the current study. As several variables differed between ours and previous studies. Therefore, it is not possible to determine the main variable involved in BP effects promoted by isometric training, which should be further studied.
In the present study, the magnitude of the decrease in BP was not sufficient to indicate a significant interaction among the groups (Table 2). However, a main effect of intervention in IRT was evidenced, which reflected in a reduction of diastolic BP values in a 24-hour period (∆ = -2.7±4.4 mmHg) and dur -ing daytime (∆ = -3.8±4.9 mmHg). In this scenario, Whelton et al.31 showed that long-term small changes in BP could have a significant impact on cardiovascular survival. More specifically, the authors demonstrated that a reduction of only 2 mmHg in SBP and DBP is associated with a decrease from 6% to 14% and 4% to 6% in the incidence of acute myocardial infarction and coronary artery disease, respectively. A small reduction of 2 mmHg in diastolic BP was also associated with a 17% reduction in the prevalence of SAH in the general population. In addition, the reduction of 3 mmHg in BP could reduce the overall risk of mortality at 4%31.
Two meta-analysis studies found an independent effect of DRT and IRT11,13 on BP. However, the mechanisms responsible
for this decrease are still unclear, especially regarding the differ -ences between dynamic and isometric RT. Possible mechanisms that result in decreases in BP after intervention include neural
(sympatho-vagal activity), vascular (endothelial function) and inflammatory adaptations11,12,14.In the present study, unlike IRT
and Control groups, the intervention with DRT promoted a sig -nificant increase in AASI (Table 2). The AASI obtained from ABPM 24 hours, is associated with the speed of the pulse wave, and has been introduced as a new measure of arterial function24,25.
Okamoto, Sakamaki, Min, Yoshida, Watanabe, Ogasawara32
found that 16 continuous weeks of DRT increased arterial stiffness measured by the speed of the pulse wave. Thus, it is possible to speculate that the DRT group, in the present study, had its BP results influenced by the increase of AASI. However, more studies are needed to clarify the possible interference between these variables for different RT models.
Increases in dynamic strength after isometric training have been previously described in the literature. Folland, Hawker, Leach, Little, Jones30 observed that 9 weeks of isometric train
-ing increased isokinetic strength in 10.5%. The results in the present study (Figure 4) indicated that the increases in dynamic strength after IRT were lower (∆ = 24.1±7.1%) than the increases observed in DRT (∆ = 43.1±10.6%). This could be explained by the specificity of the training. Given that increases in strength during initial phases of resistance training are mainly attributed to neural adaptations, IRT might have improved neural drive to trained muscles, improving neural activation during dynamic 1RM strength33,34.
The present study found that whole body isometric train -ing improved aerobic fitness in 12.9% (Table 4). Studies have demonstrated that RT increases cardiorespiratory fitness2,16,35.
Vincent, Braith, Feldman, Kallas, Lowenthal36 showed that 6
months of RT at intensities of 50% or 80% of 1RM increased peak oxygen consumption in the elderly. Even though there are controversies in the literature, a possible mechanism related to increases in cardiorespiratory fitness with whole body resis -tance training could be related to an improvement in energy economy due to an increase in strength levels1,2,37. Moreover,
IRT is associated with vascular occlusion, which is a potent stimulus for angiogenesis14,32,38.
To our knowledge, this is the first controlled study to investi -gate and compare physical fitness and 24 hours of BP responses between different RT models of whole body (Isometric vs. Dynamic) using similar relative loads and balancing under ten -sion among groups. Even though the present study contributes to the available literature it presents some limitations, such as
Table 4. Mean (±SD) of aerobic fitness variables obtained on maximum aerobic incremental test (MAIT) according to interventions.
CONTROL ISOMETRIC DYNAMIC Time Time x group
Pmax (W) Pre
Post
132 ± 21
129 ± 21 144 ± 23*128 ± 18 178 ± 20*†147 ± 26 F = 66.532P < 0.01 F = 29.195P < 0.01
HRmax (bpm) Pre
Post
164 ± 9
162 ± 10 156 ± 14157 ± 7 158 ± 10156 ± 6 F = 0.013P = 0.909 F = 0.617P = 0.547
RPEmax Pre
Post
19 ± 1
18 ± 1 18 ± 219 ± 1 19 ± 1#18 ± 1 F = 3.370P = 0.078 F = 3.892P = 0.033
the non-randomization of the subjects in the groups, the lack of dietary control and the non-standardization of period of the day in which the participants trained. Additionally, it was not pos -sible to carry out the assessment in the isometric strength from a specific dynamometer, which could result in more accurate values of neuromuscular performance. Finally, the present study used 1RM strength for prescribing and evaluating the adaptations to the different RT programs. Due to being a dynamic method, a possible bias could be speculated regarding the specificity of the test in the evaluation of the results found. On the other hand, Juneja, Verma, Khanna39 in a systematic review of 15 studies,
tested the association between isometric and dynamic strength and found correlations from moderate to high (P<0.05), primarily for the large muscle groups, similar to those used in this study.
Future studies comparing isometric and dynamic RT are encouraged to analyze chronic effects of BP during 24hours, physical fitness and anthropometric aspects, using robust equip -ment, and seeking to equalize exercise intensity for such methods in order to provide support for their use in health programs. Furthermore, the analysis of possible mechanisms for reduc -tions in BP that may differ between methods is also encouraged.
Conclusion
In conclusion, whole body IRT during 12 weeks reduced diastolic BP values during a 24-hour period and during daytime. There was also a decrease in mean BP values during daytime. However, the decrease was not different for the DRT group. Unlike IRT and Control groups, the intervention with DRT promoted a significant increase in AASI. Moreover, IRT increased strength and aerobic fitness in pre-hypertensive middle-aged subjects, in spite of these increases being of lower magnitude than the DRT.
The results suggest that for improving muscle strength and aerobic fitness, DRT emerges as a good alternative. However, if the primary objective is to control BP, IRT presented results that are more interesting. Lastly, if the subjects present joint limitations, IRT may be an alternative to improve strength and fitness parameters, considering participants with similar char -acteristics to the ones of the present study.
References
1. Conley KE, Esselman PC, Jubrias SA, Cress ME, Inglin B, Mogadam C, et al. Ageing, muscle properties and maximal O2 uptake rate in humans. J Physiol. 2000;526(1):211-7.
2. Guido M, Lima RM, Benford R, Leite TKM, Pereira RW, Oliveira RJ. Effects of 24 weeks of resistance training on aerobic fitness in -dexes of older women. Rev Bras Med Esporte. 2010;16(4):259-63. 3. Hollenberg M, Yang J, Haight TJ, Tager IB. Longitudinal changes
in aerobic capacity: implications for concepts of aging. J Gerontol A Biol Sci Med Sci. 2006;61(8):851-8.
4. Ben-Dov IZ, Kark JD, Ben-Ishay D, Mekler J, Ben-Arie L, Bursztyn M. Predictors of all-cause mortality in clinical ambula -tory monitoring: unique aspects of blood pressure during sleep. Hypertension. 2007;49(6):1235-41.
5. Brazilian Cardiology Society – SBC. VII Brazilian Hypertension Guidelines. Arq Bras Cardiol. 2016;107(3):1-83.
6. Carvalho FO, Fernandes RA, Christofaro DGD, Codogno JS, Monteiro HL, Moreira SR, et al. Cluster of cardiovascular risk factors and occurrence of arterial hypertension in sedentary adults. Rev Bras Med Esporte. 2013;19(6):419-22.
7. Brazilian Institute of Geography and Statistics – IBGE. The National Health Survey, Perception of health status, lifestyles and chronic diseases. Brazil, Major Regions and Federation Units. 2013.
8. Schmidt MI, Duncan BB, Hoffmann JF, Moura L, Malta DC, Carvalho RMSV. Prevalence of diabetes and hypertension based on selfreported morbidity survey, Brazil, 2006. Rev. Saúde Pública. 2009;43(2):74-82.
9. Maslow AL, Sui X, Colabianchi N, Hussey J, Blair SN. Muscular Strength and Incident Hypertension in Normotensive and Prehypertensive Men. Med Sci Sports Exerc. 2010;42(2): 288-95. 10. Paffenbarger RSJ, Wing AL, Hyde RT, Jung DL. Physical activity
and incidence of hypertension in college alumni. Am J Epidemiol. 1983;117(3):245-57.
11. Cornelissen VA, Smart NA. Exercise Training for Blood Pressure: A Systematic Review and Meta-analysis. J Am Heart Assoc. 2013;2:e004473.
12. Millar PJ, Mcgowan CL, Cornelissen VA, Araujo CG, Swaine IL. Evidence for the Role of Isometric Exercise Training in Reducing Blood Pressure: Potential Mechanisms and Future Directions. Sports Med. 2013;44(3):345-56.
13. Carlson DJ, Dieberg G, Hess NC, Millar PJ, Smart NA. Isometric exercise training for blood pressure management: a systematic review and meta-analysis. Mayo Clin Proc. 2014;89(3):327-34. 14. Lawrence MM, Cooley ID, Huet YM, Arthur ST, Howden
R. Factors influencing isometric exercise training-induced reductions in resting blood pressure. Scand J Med Sci Sports. 2015;25(2):131-42.
15. Wiles JD, Goldring N, Coleman D. Home-based isometric ex -ercise training induced reductions resting blood pressure. Eur J Appl Physiol. 2017;117(1):83-93.
16. Haykowsky M, Mcgavock J, Vonder Muhll I, Koller M, Mandic S, Welsh R, et al. Effect of exercise training on peak aerobic power, left ventricular morphology, and muscle strength in healthy older women. J Gerontol A Biol Sci Med Sci. 2005;60(3):307-11. 17. Taylor KA, Wiles JD, Coleman DD, Sharma R, Oʼdriscoll
JM. Continuous Cardiac Autonomic and Hemodynamic Responses to Isometric Exercise. Med Sci Sports Exerc. 2017;49(8):1511-19.
18. O’Driscoll JM, Taylor KA, Wiles JD, Coleman DA, Sharma R. Acute cardiac functional and mechanical responses to isometric exercise in prehypertensive males. Physiol Rep. 2017;5(7):e13236. 19. Brazilian Cardiology Society - SBC. V Guidelines for Ambulatory
Blood Pressure Monitoring (ABPM). Arq Bras Cardiol. 2011;97(3):1-24.
22. Conen D, Bamberg F. Noninvasive 24-h ambulatory blood pres -sure and cardiovascular disease: a systematic review and meta-analysis. J Hypertens. 2008;26(7):1290-9.
23. Carvalho VO, Ciolac EG, Guimarães GV, Bocchi EA. Effect of ex -ercise training on 24-hour ambulatory blood pressure monitoring in heart failure patients. Congest Heart Fail. 2009;15(4):176-80. 24. Li Y, Dolanc E, Wanga J, Thijs L, Zhua D, Staessenb JA, et al.
Ambulatory arterial stiffness index: determinants and outcome. Blood Press Monit. 2006;11(2):107-10.
25. Kollias A, Stergiou GS, Dolan E, O’Brien E. Ambulatory arte -rial stiffness index: A systematic review and meta-analysis. Atherosclerosis. 2012;224(2):291-301.
26. Dias RMR, Avelar A, Menêses AL, Salvador EP, Silva DRP, Cyrino ES. Safety, reliability, intervenient factors and applicability of 1-RM tests. Motriz: J. Phys. Ed. 2013;19(1):231-42.
27. Kraemer WJ, Fry AC. Strength testing: Development and evaluation of methodology. In Maud, PJ, Foster, C. (Eds.). Physiological assessment of human fitness. Champaign, IL: Human Kinetics.1995;115-38.
28. Borg GAV. Psychophysical bases of perceived exertion. Med Sci Sports Exerc. 1982; 14(5):377-81.
29. Silva DF, Sotero RC, Simões HG, Machado FA. Maximal aerobic speed calculated by heart rate cost: Relationship with perfor -mance. Rev Andal Med Deporte. 2015;8(1):7-15.
30. Folland JP, Hawker K, Leach B, Little T, Jones DA. Strength train -ing: isometric training at a range of joint angles versus dynamic training. J Sports Sci. 2005;23(8):817-24.
31. Whelton PK, He J, Appel LJ, Cutler JA, Havas S, Kotchen TA, et al. Primary prevention of hypertension: clinical and public health advisory from the National High Blood Pressure Education Program. JAMA. 2002; 288(15):1882-8.
32. Okamoto T, Sakamaki MS, Min SK, Yoshida S, Watanabe Y, Ogasawara R. Repeated Cessation and Resumption of Resistance Training Attenuates Increases in Arterial Stiffness. Int J Sports Med. 2015; 36(6):440-5.
33. Balshaw TG, Massey GJ, Maden-Wilkinson TM, Tillin NA, Folland JP. Training-specific functional, neural, and hypertrophic
adaptations to explosive- vs. sustained-contraction strength train-ing. J Appl Physiol. 2016;120(11):1364-73.
34. Folland JP, Williams AG. The adaptations to strength training: morphological and neurological contributions to increased strength. Sports Med. 2007;37(2):145-68.
35. Lovell D, Cuneo R, Gass GC. Strength training improves sub -maximum cardiovascular performance in older men. J Geriatr Phys Ther. 2009;32(3):117-24.
36. Vincent KR, Braith RW, Feldman RA, Kallas HE, Lowenthal DT. Improved cardiorespiratory endurance following 6 months of resistance exercise in elderly men and women. Arch Intern Med. 2002;162(6):673-8.
37. Lovell D, Cuneo R, Delphinus E, Gass G. Leg strength and the VO2 max of older men. Int J Sports Med. 2011;32(4):271-6. 38. Baross AW, Wiles JD, Swaine IL. Effects of the Intensity of Leg
Isometric Training on the Vasculature of Trained and Untrained Limbs and Resting Blood Pressure in Middle-Aged Men. Int J Vasc Med. 2012; 2012:964697.
39. Juneja H, Verma SK, Khanna GL. Isometric Strength and Its Relationship to Dynamic Performance: A Systematic Review. JESP. 2010;6(2):60-9.
Corresponding author
Flavio de Souza Araujo
Universidade Federal do Vale do São Francisco, UNIVASF. Av. José de Sá Maniço
-ba, s/n, Centro, Petrolina, PE, Brazil. Email: [email protected]
Manuscript received on January 4, 2018 Manuscript accepted on May 28, 2018