Comparison of the homeostasis model
assessment and quantitative insulin
sensitivity check index with data from
forearm metabolic studies for the
in
vivo
assessment of insulin sensitivity
Divisão de Endocrinologia e Metabologia, Departamento de Clínica Médica, Faculdade de Medicina de Ribeirão Preto, Universidade de São Paulo, Ribeirão Preto, SP, Brasil
M.C. Foss-Freitas and M.C. Foss
Abstract
The present study was designed to compare the homeostasis model assessment (HOMA) and quantitative insulin sensitivity check index (QUICKI) with data from forearm metabolic studies of healthy indi-viduals and of subjects in various pathological states. Fifty-five healthy individuals and 112 patients in various pathological states, including type 2 diabetes mellitus, essential hypertension and others, were studied after an overnight fast and for 3 h after ingestion of 75 g of glucose, by HOMA, QUICKI and the forearm technique to estimate muscle uptake of glucose combined with indirect calorimetry (oxida-tive and non-oxida(oxida-tive glucose metabolism). The patients showed increased HOMA (1.88 ± 0.14 vs 1.13 ± 0.10 pmol/l x mmol/l) and
insulin/glucose (I/G) index (1.058.9 ± 340.9 vs 518.6 ± 70.7 pmol/l x
(mg/100 ml forearm)-1), and decreased QUICKI (0.36 ± 0.004 vs 0.39
± 0.006 (µU/ml + mg/dl)-1) compared with the healthy individuals.
Analysis of the data for the group as a whole (patients and healthy individuals) showed that the estimate of insulin resistance by HOMA was correlated with data obtained in the forearm metabolic studies (glucose uptake: r = -0.16, P = 0.04; non-oxidative glucose metabo-lism: r = -0.20. P = 0.01, and I/G index: r = 0.17, P = 0.03). The comparison of QUICKI with data of the forearm metabolic studies showed significant correlation between QUICKI and non-oxidative glucose metabolism (r = 0.17, P = 0.03) or I/G index (r = -0.37, P < 0.0001). The HOMA and QUICKI are good estimates of insulin sensitivity as data derived from forearm metabolic studies involving direct measurements of insulin action on muscle glucose metabolism.
Correspondence
M.C. Foss
Departamento de Clínica Médica FMRP, USP
Av. Bandeirantes, 3900 14049-900 Ribeirão Preto, SP Fax: +55-16-633-6695 E-mail: [email protected]
Research supported by the University Hospital, Faculdade de Medicina de Ribeirão Preto, USP, FAEPA and CAPES.
Publication supported by FAPESP.
Received May 29, 2003 Accepted March 2, 2004
Key words
•Homeostasis model assessment •Quantitative insulin
sensitivity check index •Forearm metabolic study •Insulin sensitivity
Introduction
The control of body glucose homeostasis is mainly due to two closely related physi-ological mechanisms, i.e., the capacity of the
diabetes mellitus, glucose intolerance, obe-sity, polycystic ovary syndrome, essential hypertension, metabolic syndrome and, more recently, atherosclerosis, insulin resistance (IR) is frequently an associated condition or is considered to be a predictor or pathoge-netic factor (2,3). There is also much evi-dence that defects in insulin secretion occur in these pathological states (4).
Therefore, it is important to have meth-ods to estimate insulin secretion and sensi-tivity in the human body (5). Previous stud-ies have shown that the most adequate meth-ods to evaluate insulin secretion and its de-fects are the hyperglycemic clamp and the intravenous glucose tolerance test (6-8). The euglycemic hyperinsulinemic clamp tech-nique is the reference and best method for quantifying insulin sensitivity or resistance in vivo because it directly measures the
ef-fects of insulin on glucose utilization under steady state conditions (6). In contrast, the forearm technique to estimate muscle glu-cose metabolism combined or not with indi-rect calorimetry diindi-rectly analyzes the bio-logical action of insulin on a metabolically active tissue, the muscle, and represents a good method to evaluate insulin sensitivity or resistance (9-16). However, these meth-ods are not easily applied in large-scale or routine clinical investigations because they are laborious and expensive. Thus, several alternative and simpler methods have been recently proposed. These include the ho-meostatic model assessment (HOMA) (17, 18) and the quantitative insulin sensitivity check index (QUICKI) (19-21).
On the basis of these considerations, the objective of the present study was to com-pare the HOMA and QUICKI with data from forearm metabolic studies (muscle glucose uptake, oxidative and non-oxidative glucose metabolism and insulin/glucose (I/G) index) of healthy individuals and subjects in vari-ous pathological states, including type 2 dia-betes mellitus, essential hypertension and others.
Subjects and Methods
The study was conducted on 55 healthy individuals and 112 patients in various patho-logical states, including type 2 diabetes mel-litus (N = 20), essential hypertension (N = 9), acanthosis nigricans (N = 7), acromegaly (N = 12), hyperthyroidism (N = 11), con-genital adrenal hyperplasia (N = 8), hyper-prolactinemia (N = 8), polycystic ovary syn-drome (N = 16), chronic renal failure (N = 11), and psoriasis (N = 10), whose character-istics of sex, age and body mass index (BMI) are presented in Table 1. All subjects were asked to consume a diet containing a mini-mum of 200 g of carbohydrate for at least 3 days before the study. The protocol was approved by the Ethics Committee of the University Hospital, School of Medicine of Ribeirão Preto, USP, Brazil. Before giving their consent to participate, the volunteers were carefully informed of the nature, pur-pose and possible risks of the study. No side effects were observed in any of the patients or volunteers.
After a 12- to 14-h fast, the studies were initiated in the morning with the subjects resting in bed in the supine position at the Endocrine and Metabolism Unit of the Uni-versity Hospital-FMRPUSP. The brachial artery in the left arm and a right antecubital deep vein were cannulated (10). After an equilibration period of 30-60 min, forearm blood flow was determined by capacitance plethysmography (22), and arterial and venous blood samples were drawn simulta-neously to determine plasma glucose (23), total blood CO2 and O2 (24), and serum
insulin (25). After this procedure under ba-sal conditions, the subjects ingested 75 g of glucose dissolved in 300 ml flavored water, additional blood samples were collected and forearm blood flow determinations were made at 30, 60, 120 and 180 min after glu-cose ingestion.
period of time (Q) was calculated using the following equation: Q = F (A - V), where F is the forearm blood flow and A and V are the arterial and venous concentrations of the substrate, respectively. Blood flow and the arteriovenous difference of glucose in whole blood were used to determine the forearm glucose uptake rate. The whole blood glu-cose concentration was calculated from the plasma glucose level by the formula: whole blood glucose concentration = plasma glu-cose concentration x (1-0.3 hematocrit) (26). The relationships between the arteriovenous differences in CO2 and O2 were used to
de-termine the respiratory quotient. The Lusk tables were then used to obtain the carbohy-drate and lipid oxidation rates (27). The amount of glucose taken up or oxidized dur-ing the 3 h of the experiment was estimated by the determination of the areas under the curves of the rates of glucose uptake and glucose oxidation, respectively. Non-oxida-tive glucose metabolism was calculated as the difference between glucose uptake and glucose oxidation. The I/G index was calcu-lated as the ratio of insulin response (area under the curve of serum insulin-pmol/l) to the forearm glucose uptake (mg/100 ml fore-arm) during the 3 h of the study.
Using the fasting serum levels of glucose and insulin, the HOMA estimate of IR was
determined by the following formula: IR = insulin (pmol/l) x glycemia (mmol/l)/135 (28) and the QUICKI index was calculated by the formula: 1/[log insulin (µU/ml) + log glucose (mg/dl)] (19).
Results are reported as means ± SEM. Data were analyzed statistically by the Wil-coxon-Mann-Whitney test (29) or Student t -test (29) and correlations were assessed by a non-parametric test (Spearman) (29). P < 0.05 was considered to indicate statistical significance.
Results
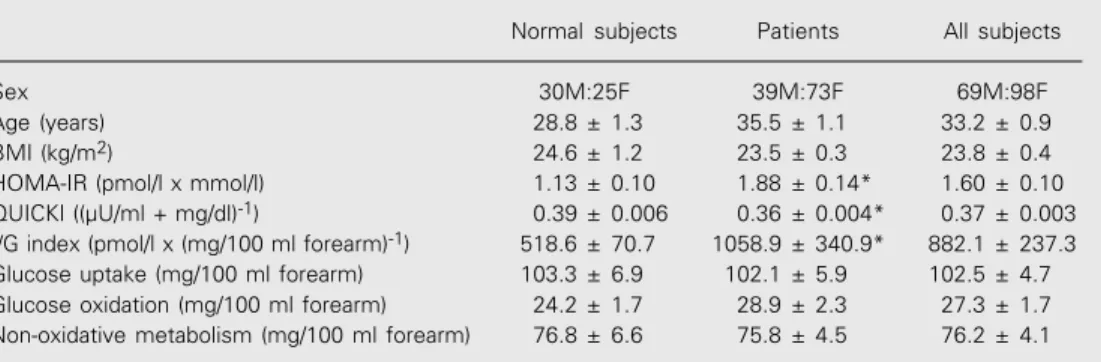
Mean BMI values did not differ signifi-cantly between the group of healthy subjects and the group of patients in various patho-logical states, while the patients showed greater mean age values than the group of healthy subjects (P < 0.05; Table 1). The patients showed higher values of HOMA-IR estimates and I/G index than the values of healthy individuals. As expected, the pa-tients revealed decreased QUICKI values when compared with normal controls (Table 1). There was no difference in the amounts of glucose taken up or oxidized or utilized by non-oxidative pathways during the 3 h of the forearm study between the normal and pa-tient groups.
Table 1. Comparison of homeostasis model assessment (HOMA) and quantitative insulin sensitivity check index (QUICKI) with data from forearm metabolic studies for the assessment of in vivo insulin sensitivity.
Normal subjects Patients All subjects Sex 30M:25F 39M:73F 69M:98F Age (years) 28.8 ± 1.3 35.5 ± 1.1 33.2 ± 0.9 BMI (kg/m2) 24.6 ± 1.2 23.5 ± 0.3 23.8 ± 0.4
HOMA-IR (pmol/l x mmol/l) 1.13 ± 0.10 1.88 ± 0.14* 1.60 ± 0.10 QUICKI ((µU/ml + mg/dl)-1) 0.39 ± 0.006 0.36 ± 0.004* 0.37 ± 0.003
I/G index (pmol/l x (mg/100 ml forearm)-1) 518.6 ± 70.7 1058.9 ± 340.9* 882.1 ± 237.3
Glucose uptake (mg/100 ml forearm) 103.3 ± 6.9 102.1 ± 5.9 102.5 ± 4.7 Glucose oxidation (mg/100 ml forearm) 24.2 ± 1.7 28.9 ± 2.3 27.3 ± 1.7 Non-oxidative metabolism (mg/100 ml forearm) 76.8 ± 6.6 75.8 ± 4.5 76.2 ± 4.1 Data are reported as means ± SEM. BMI = body mass index; M = male; F = female; I/G = insulin/glucose index; IR = insulin resistance.
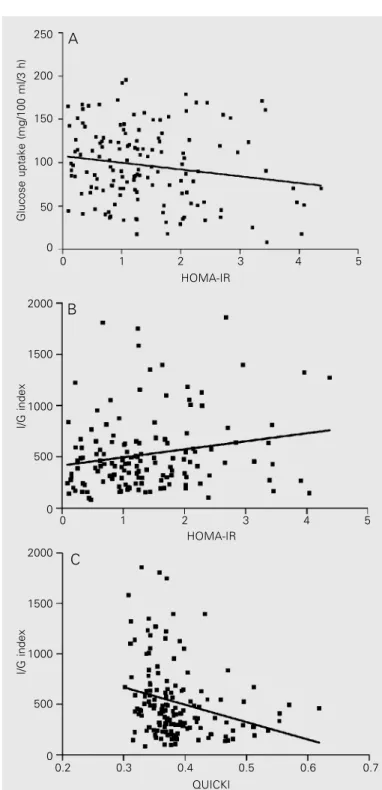
Analysis of the data for the group as a whole (normal subjects and patients) revealed a statistically significant correlation between the estimates of IR by HOMA and the data of the forearm metabolism studies (glucose uptake: r = -0.16, P = 0.04 (Figure 1A), non-oxidative glucose metabolism: r = -0.20, P = 0.01 and I/G index: r = 0.17, P = 0.03 (Figure 1B). The comparison of QUICKI values with data obtained in the forearm metabolic stud-ies showed a significant correlation between QUICKI and non-oxidative glucose metabo-lism (r = 0.17, P = 0.03) and QUICKI and I/ G index (r = -0.37, P < 0.0001; Figure 1C).
Discussion
Because of the frequent association of IR as a predictor or pathogenic factor of various human pathological states such as type 2 diabetes mellitus, glucose intolerance, obe-sity, essential hypertension, polycystic ovar-ian syndrome, atherosclerosis, and metabolic syndrome, it is important to have methods to estimate insulin sensitivity in the human body (5). The euglycemic hyperinsulinemic clamp technique is the reference method for the quantification of insulin sensitivity or resis-tance in vivo in the whole body (6), while the forearm technique used to estimate muscle glucose metabolism directly analyzes the bio-logical action of insulin on a metabolically active tissue, the muscle (30). However, since these methods are not easily applied in large-scale or routine clinical investigations, sev-eral simpler methods have been recently pro-posed, such as HOMA and QUICKI esti-mates (17,19).
In the present study, for the first time in the literature, we compared data from fore-arm metabolic studies of healthy individuals and subjects in various pathological states involving different alterations in insulin sen-sitivity, with estimates obtained by the HOMA and QUICKI methods. We observed that in the whole group of subjects (normal and patients) the parameters of the forearm
Figure 1. Comparison of homeostasis model assessment (HOMA) and quan-titative insulin sensitivity check index (QUICKI) with data from forearm meta-bolic studies for the assessment of in vivo insulin sensitivity. A, Glucose uptake vs HOMA-IR. Data are for 167 patients and healthy individuals (r = -0.16, P = 0.04; Spearman correlation test). B, Insulin/glucose (I/G) index vs
HOMA-IR. Data are for 167 patients and healthy individuals (r = 0.17, P = 0.03; Spearman correlation test). C, I/G index vs QUICKI. Data are for 167 patients and healthy individuals (r = -0.37, P < 0.0001; Spearman correlation test). IR = insulin resistance.
Glucose uptake (mg/100 ml/3 h)
250
200
150
100
50
0
2000
1500
1000
500
0
I/G index
0 1 2 3 4 5
HOMA-IR
0 1 2 3 4 5
HOMA-IR
A
B
2000
1500
1000
500
0
I/G index
0.2 0.3 0.4 0.5 0.6 0.7
C
study, particularly the I/G index and the non-oxidative glucose metabolism, were signifi-cantly correlated with the HOMA and QUICKI estimates of IR and sensitivity, re-spectively. The correlation was statistically significant but weak. The I/G index, ob-tained during the forearm studies as the ratio of the area under the curve of serum insulin concentrations and the area under the curve of muscle glucose uptake, increased when more insulin was necessary to establish a determined rate of glucose entry into the muscle cell. Then the I/G index directly re-flects the degree of IR in muscle tissue, and therefore its correlation with HOMA-IR is significant and positive while the correlation with QUICKI is significant and negative. The rate of muscle glucose uptake and even more the non-oxidative metabolism of glu-cose inside the muscle cell are metabolic processes directly sensitive to insulin. As expected, the amount of glucose utilized during the forearm studies by the non-oxida-tive pathway inside the muscle cells of the subjects correlated positively with the QUICKI value and inversely correlated with the HOMA estimate. It is important to em-phasize that the statistical significance of the correlations was higher when we compared the HOMA and QUICKI estimates with the I/G index, that better reflects the degree of IR in muscle tissue.
The HOMA estimates of IR and ß-cell deficiency are derived from a mathematical model of the glucose-insulin interactions in a feedback loop in the steady-state basal
condition (17). These interactions involve ß-cell secretion of insulin and its action on liver and peripheral tissues. The QUICKI is also defined by a formula applied to fasting insulin and glucose data, and the changes detected in this index are mostly related to insulin sensitivity estimated by the hyperin-sulinemic euglycemic clamp in the whole body (19). The forearm studies specifically analyze the action of insulin on peripheral tissues, particularly muscle tissue (30). The significant correlation between the forearm studies data, involving mainly insulin sensi-tivity in muscle tissue, and the HOMA and QUICKI estimates of insulin sensitivity in the whole body indicated that in the patho-logical situations included in our study IR was present in muscle and probably in other metabolically active tissue such as hepatic and adipose tissue. Unfortunately, at present there are no well-defined cut-off points for HOMA or QUICKI that would permit the use of better statistical analysis such as kappa statistics for the analysis of the data.
Acknowledgments
The authors are grateful to Mario J.A. Saad, Walkyria P. Pimenta, Gloria M.G.F. Paccola, Francisco J.A. Paula, Leonor M.B. Gouveia, Maria Teresa C.G. Torquato, Fernanda O.M. Menezes, Renan M. Monte-negro Jr., and C.E. Piccinato for assistance in the forearm studies, and to Sebastião Brandão Filho for technical assistance.
References
1. Van Hoeften TW, Pimenta W, Mitrakou A, Korytkowski M, Jenssen T, Yki-Jarvinen H & Gerich JE (2000). Relative contribution of beta cell function and tissue insulin sensitivity to fasting and post-glucose-load glycemia. Metabolism, 49: 1319-1325.
2. De Fronzo RA (1988). The triumvirate: beta cell, muscle, liver. A collusion for NIDDM. Diabetes, 37: 667-687.
3. De Fronzo RA & Ferrannini E (1991). Insulin resistance: a multifac-eted syndrome responsible for NIDDM, obesity, hypertension,
dys-lipidemia and atherosclerotic cardiovascular disease. Diabetes Care, 14: 173-194.
4. Taverna MJ (2002). Homeostatic model assessment (HOMA). Re-vista de la Asociación Latino Americana de Diabetes, X: 8-17. 5. Ferrannini E & Mari A (1998). How to measure insulin sensitivity.
Journal of Hypertension, 16: 895-906.
American Journal of Physiology, 237: 214-236.
7. Bergman RN (1989). Lilly lecture. Toward physiological understand-ing of glucose tolerance. Minimal-model approach. Diabetes, 38: 1512-1527.
8. Bergman RN, Prager R, Volund A & Olefesky JM (1987). Equiva-lence of the insulin sensitivity index in man derived by the minimal model method and the euglycemic glucose clamp. Journal of Clini-cal Investigation, 79: 790-800.
9. Saad MJA, Pimenta WP, Paccola GMGF, Piccinato CE, Moreira AC & Foss MC (1989). Effect of glucose ingestion on peripheral glucose metabolism in normal man. Diabetes and Metabolism, 15: 5-10. 10. Foss MC, Paccola GMGF, Saad M, Pimenta W, Piccinato CE & Iazigi
N (1990). Peripheral glucose metabolism in human hyperthyroid-ism. Journal of Clinical Endocrinology and Metabolism, 70: 1167-1172.
11. Foss MC, Saad M, Paccola GMGF, Paula FJA, Piccinato CE & Moreira AC (1991). Peripheral glucose metabolism in acromegaly.
Journal of Clinical Endocrinology and Metabolism, 72: 1048-1053. 12. Foss MC, Saad MJA, Paccola GMGF, Paula FJA & Piccinato CE
(1992). Peripheral glucose metabolism in patients with insulin resis-tance and acanthosis nigricans. Hormone and Metabolic Research, 24: 26-30.
13. Paula FJA, Gouveia LMFB, Paccola GMGF, Piccinato CE, Moreira AC & Foss MC (1994). Androgen-related effects on peripheral glu-cose metabolism in women with congenital adrenal hyperplasia.
Hormone and Metabolic Research, 26: 552-556.
14. Gouveia LMFB, Moyses-Neto M, Paccola GMGF, Piccinato CE & Foss MC (1995). Peripheral glucose metabolism in patients with chronic renal failure. Brazilian Journal of Medical and Biological Research, 28: 201-207.
15. Foss MC, Paula FJA, Paccola GMGF & Piccinato CE (1995). Periph-eral glucose metabolism in human hyperprolactinemia. Clinical En-docrinology, 43: 721-726.
16. Foss MC, Gouveia LMFB, Moyses-Neto M, Paccola GMGF & Piccinato CE (1996). Effect of hemodialysis on peripheral glucose metabolism of patients with chronic renal failure. Nephron, 73: 48-53.
17. Mathews DR, Horsker JP, Rudeniski AS, Naylor BA, Treacher DF & Turner RC (1985). Homeostasis model assessment: insulin resis-tance and beta cell function from fasting plasma glucose and insulin concentrations in man. Diabetologia, 28: 412-419.
18. Bonora E, Targher G, Alberiche M, Bonadonna RC, Saggiani F,
Zenere MB, Monauni T & Muggeo M (2000). Homeostasis model assessment closely mirrors the glucose clamp technique in the assessment of insulin sensitivity. Diabetes Care, 23: 57-63. 19. Katz A, Mambi SS, Mather K, Baron AD, Follmann DA, Sullivam G &
Quon MJ (2000). Quantitative insulin sensitivity check index: a simple, accurate method for assessing insulin sensitivity in hu-mans. Journal of Clinical Endocrinology and Metabolism, 85: 2402-2410.
20. Hrebicek J, Janout V, Malincikova J, Horakova D & Cizek L (2002). Detection of insulin resistance by simple quantitative insulin sensi-bility check index QUICKI for epidemiological assessment and pre-vention. Journal of Clinical Endocrinology and Metabolism, 87: 144-147.
21. Katsuki A, Sumida Y, Gabazza EC et al. (2002). QUICKI is useful for following improvements in insulin sensitivity after therapy in pa-tients with type 2 diabetes mellitus. Journal of Clinical Endocrinol-ogy and Metabolism, 87: 2906-2908.
22. Norton JA, Burt ME & Brennan MF (1945). Capacitance plethys-mography validation in an ex vivo human limb model. Journal of Surgical Research, 160: 127-129.
23. Somogyi N (1945). Determination of blood sugar. Journal of Biologi-cal Chemistry, 160: 69-73.
24. Van Slyke DD & Neill JM (1924). The determination of gases in blood and other solutions by vacuum extraction and manometric measurements. Journal of Biological Chemistry, 61: 523-573. 25. Soeldner JS & Slone D (1985). Critical variables in the
radioimmu-noassay of serum insulin using the double antibody technique.
Diabetes, 14: 771-779.
26. Dillon RS (1965). Importance of the hematocrit in interpretation of blood sugar. Diabetes, 14: 672-674.
27. Lusck G (1924). Animal calorimetry. Analysis of the oxidation of mixtures of carbohydrate and fat. Journal of Biological Chemistry, 59: 41-42.
28. Stumvoll H, Mitrakou A, Pimenta W, Jensen T, Yki-Jarvinen H, van Haften T, Renn W & Gerich J (2000). Use of the oral glucose tolerance test to assess insulin release and insulin sensitivity. Dia-betes Care, 23: 295-301.
29. Shott S (1990). Statistics for Health Professionals. W.B. Saunders, Philadelphia, PA, USA.