1 School of Physical Therapy, Universidade Federal de Juiz de Fora (UFJF), Juiz de Fora, MG, Brazil 2 Biomedical Engineering Program, Universidade Federal do Rio de Janeiro (UFRJ), Rio de Janeiro, RJ, Brazil 3 Department of Physical Education, Universidade Federal de Viçosa (UFV), Viçosa, MG, Brazil
4 Department of Physical Education, Universidade Federal de São Carlos (UFSCar), São Carlos, SP, Brazil
Received: 06/06/2013 Revised: 08/26/2013 Accepted: 10/15/2013 a r t i c l e
Influence of aging on isometric muscle strength, fat-free
mass and electromyographic signal power of the upper
and lower limbs in women
Josária F. Amaral1, Felipe C. Alvim2, Eliane A. Castro3, Leonice A. Doimo3, Marcus V. Silva1
, José M. Novo Júnior5
ABSTRACT | Background: Aging is a multifactorial process that leads to changes in the quantity and quality of skeletal muscle and contributes to decreased levels of muscle strength. Objective: This study sought to investigate whether the isometric muscle strength, fat-free mass (FFM) and power of the electromyographic (EMG) signal of the upper and lower limbs of women are similarly affected by aging. Method: The sample consisted of 63 women, who were subdivided into three groups (young (YO) n=33, 24.7±3.5 years; middle age (MA) n=15, 58.6±4.2 years; and older adults (OA). n=15, 72.0±4.2 years). Isometric strength was recorded simultaneously with the capture of the electrical activity of the flexor muscles of the fingers and the vastus lateralis during handgrip and knee extension tests, respectively. FFM was assessed using dual-energy X-ray absorptiometry. Results: The handgrip strength measurements were similar among groups (p=0.523), whereas the FFM of the upper limbs was lower in group OA compared to group YO (p=0.108). The RMSn values of the hand flexors were similar among groups (p=0.754). However, the strength of the knee extensors, the FFM of the lower limbs and the RMSn values of the vastus lateralis were lower in groups MA (p=0.014, p=0.006 and p=0.013, respectively) and OA (p=0.000, p=0.000 and p<0.000, respectively) compared to group YO. Conclusions: The results of this study demonstrate that changes in isometric muscle strength in MLG and electromyographic activity of the lower limbs are more pronounced with the aging process of the upper limb.
Keywords: aging; muscle strength; electromyography, rehabilitation.
HOW TO CITE THIS ARTICLE
Amaral JF, Alvim FC, Castro EA, Doimo LA, Silva MV, Novo Júnior JM. Influence of aging on isometric muscle strength, fat-free mass and electromyographic signal power of the upper and lower limbs in women. Braz J Phys Ther. 2014 Mar-Apr; 18(2):183-190. http://dx.doi.org/10.1590/S1413-35552012005000145
Introduction
Aging is a multifactorial process that causes changes in the quantity and quality of skeletal muscles and leads to a reduction in their strength1. Muscle atrophy and functional impairment affect the overall state of health of older adults by inducing significant personal losses, such as physical weakness2, an increased risk of falls and fractures3, an impaired ability to perform activities of daily life4, poorer quality of life and an increased risk of death5.
The changes in muscle strength associated with aging are not homogeneous among the muscle groups of the upper and lower limbs. According to previous studies, the knee extensors and flexors exhibit greater strength reduction with age compared to the elbow
flexors and extensors, particularly among women6,7. Similarly, hand grip strength seems better preserved compared to that of the knee extensors in older adults8,9.
79 years. After a 3-year follow-up period, the muscle strength reduction was three times greater than the FFM reduction in both males and females. These results indicate that FFM alone does not explain the reduction in muscle strength that occurs in older adults. Thus, other factors, such as alterations in the intrinsic ability of muscles to produce force and/or in neuromuscular activation, are also involved12.
Neuromuscular activation can be assessed by measuring the electromyographic (EMG) signals produced during muscle contraction13. Surface EMG is a noninvasive and easy-to-perform technique that detects the myoelectric activity associated with a contracting muscle. For these reasons, EMG has been used to investigate the neural changes associated with aging and physical function14,15. Regarding muscle strength modulation, a relationship between an increase in EMG signal power and an increase in the number of active motor units has been reported. The activation level of previously recruited fibers as a function of the length of activation has also been established16. Although changes in muscle strength and mass have been investigated by several authors6-8, few studies have sought to analyze muscle strength, muscle mass and neuromuscular activation in a single population, particularly in females, as they exhibit the greatest age-related differences in muscle strength between the upper and lower limbs6,7. Thus, the aim of the present study was to investigate whether isometric muscle strength, FFM and EMG signal power are similarly affected in the upper and lower limbs of women as a function of aging.
Method
Sample
The present study used a non-probabilistic intentional sample comprising 63 women who were distributed into the following age groups: young (YO; 33 women; age range, 20 to 39 years; mean age, 24.7±3.5 years); middle age (MA; 15 women; 40 to 64 years; 58.6±2 years) and older adults (OA; 15 women; ≥65 years; 72.0±4.2 years). The volunteers in groups MA and OA were recruited from participants in a socialization group of a project conducted at the Department of Physical Education, Federal University of Viçosa (Universidade Federal de Viçosa - UFV), Viçosa, MG, Brazil, while the students in group YO attended various courses at
that institution. All groups included white, black and brown-skinned women.
Women with musculoskeletal diseases, injuries, or trauma or those subjected to surgery in the assessed limbs were excluded from this study. The volunteers were requested to sign an informed consent form in compliance with the ethical norms stipulated in Resolution 196/96. The study was approved by the human research ethics committee of the Federal University of Juiz de Fora (Universidade Federal de Juiz de Fora - UFJF), Juiz de Fora, MG, Brazil, protocol CEP/UFJF 2451.191.2011, ruling no. 201/2011.
Assessment of isometric muscle strength and EMG
The isometric muscle strength of the upper and lower limbs was indirectly assessed using hand grip and knee extension tests. For hand grip tests, a strength transducer was coupled to a handle configuration designed by Novo Jr.17, and knee extension tests used a (tensiometer) load cell; both devices were manufactured by EMG System of Brasil. The instruments were connected to a signal conditioner with a sampling frequency of 1,024 Hz per channel, which was equipped with an anti-aliasing band-pass filter with a cutoff frequency of 20 to 500 Hz. The signal conditioner was connected to a LI-ION battery (11.1 V, 2.2 mA/h). The computers were not connected to a power source to avoid electrical interference with the data collection.
The muscle electric activity in both isometric muscle strength tests was captured simultaneously with the recording of muscle strength. For these measurements, active bipolar Ag/AgCl electrodes with a 2-cm interelectrode distance were applied.
ulnar olecranon in the hand grip test and on the fibular malleolus in the knee extension test.
Each assessment comprised three maximum isometric effort attempts, each lasting 6 seconds for 2-minute intervals to avoid the occurrence of cumulative fatigue21,22. Muscle strength in both tests was assessed on the dominant side, as informed by the volunteers.
The body position in the hand grip test was determined according to the recommendations of the American Society of Hand Therapists23,which state that the volunteer should be comfortably seated, with the shoulder adducted and non-rotated, the elbow flexed to 90 degrees in the neuter position and the wrist in 0- to 30-degree extension. The volunteers were requested to wrap the handle with their hand, while the examiner held the dynamometer. The dynamometer handle size was selected to allow for the action of the distal joint of the fifth finger and to inhibit the thumb action, as described by Amaral et al.21.
In the knee extension test, the volunteers were requested to sit with their hands placed on the lateral chair supports and their trunk straight; the chair back was adjusted to allow for 90-degree flexion of the hip. The dominant knee was placed in 90-degree flexion24. The tensiometer load cell was fixated on a bar and placed parallel to the floor by means of a steel wire, while its other end was coupled to a shinguard fixated to the volunteers’ dominant ankle. The volunteers were provided time to acquaint themselves with the equipment and test protocol before each assessment.
In both tests, the examiner provided verbal encouraging orientations to the volunteers. All volunteers were instructed to apply the maximum strength in the minimum possible time following the verbal command to start the test and to maintain that level until told to relax.
Isometric muscle strength data processing
To establish the maximum isometric muscle strength achieved by the volunteers, the strength signal curve was divided into 1,024 sample windows (1 second) with 1,023 overlapping samples. The largest average value of all windows corresponding to a single muscle contraction was considered the greatest isometric muscle strength achieved during that contraction. This procedure was selected to dismiss strength peaks achieved at the onset of muscle contraction. Finally, the highest value among three attempts was considered as the maximum isometric
muscle strength achieved by the volunteers. The hand grip and knee extensor peak strength measurements were calculated for the upper and lower limbs, respectively.
EMG data processing
The EMG signal time segment corresponding to the strength curve window that exhibited the greatest production of isometric muscle strength was used to calculate the variable root mean square (RMS) of the upper and lower limbs. The EMG signal of the finger flexor muscles was used to calculate the RMS corresponding to the upper limbs, and that of the vastus lateralis muscle was used to calculate the RMS of the lower limbs. The RMS values normalized according to the FFM of the dominant extremity (RMSn) were used for analysis.
Body composition
Body mass and height were measured using a scale (Filizola) with 100-g accuracy and a stadiometer (Sanny) with 1-mm accuracy. At the time of assessment, the volunteers were requested to wear as little clothing as possible, and all instruments were in perfect condition and calibration. Body mass and height were measured according to the method of Lohman25. Body mass index (BMI) was calculated by dividing the body mass by the square of the height (kg/m²).
Body composition was assessed by means of DXA26 using a Lunar Prodigy Advance DXA System densitometer, version 13.31. The tests were performed by a specialized technician from the Division of X-Ray and Bone Densitometry, Division of Health, UFV. During the tests, the volunteers placed the dorsal decubitus on the equipment scanning area to occupy the center of the table. The volunteers were also requested to remove any metallic objects that could interfere with the data collection.
DXA data processing
of the lower limbs corresponded to all fat-free tissue from the femoral neck to the foot phalanges26. The appendicular FFM (AFFM) was calculated by adding the FFM of the right and left upper and lower limbs.
Data analysis
The descriptive characteristics of the sample were analyzed according to measures of central tendency (mean) and dispersion (standard deviation). The normality of the data distribution was assessed by means of the Shapiro-Wilk test. Age-related differences were analyzed through analysis of variance (ANOVA) with one factor (variable) and three levels (age-based groups), followed by Tukey’s post hoc test (for variables with a normal distribution) or the Kruskal-Wallis test (for variables with a non-normal distribution). Statistical analysis was performed using Statistica software (version 7.0). The significance level was established as p<0.05.
Results
Table 1 describes the age and body composition of the volunteers distributed in groups YO, MA and OA.
Tables 2 and 3 show the comparisons among age-based groups in terms of isometric muscle strength levels, FFM and EMG signal power corresponding to the upper and lower limbs.
Discussion
The present study investigated age-associated changes in isometric muscle strength, FFM and EMG signal power in the upper and lower limbs among young, middle-aged and elderly women. The anthropometric characteristics of the volunteers in each group reflected the typical changes in body height2, mass and percentage of body fat that occur with age27. The muscle strength level achieved by the volunteers did not appear to be affected by differences in anthropometric variables, as the total FFM and AFFM normalized to body height were similar in all three groups. In addition, none of the volunteers was classified as sarcopenic according to the cutoff point suggested by Baumgartner et al.28.
FFM measurements exhibited a differential reduction between the upper and lower limbs as a function of age. In particular, the upper-limb FFM decreased only in group OA compared to YO, while the lower-limb FFM was decreased in groups MA and OA. These findings are in agreement with reports by
other authors, who also observed greater and more rapid muscle mass reduction in the lower compared to the upper limbs10,29,30. Tankó et al.30 analyzed the FFM in the limbs of healthy Danish women aged 18 to 85 years and found a linear decrease in the lower-limb FFM starting at 39 years of age. In addition, the upper-limb FFM did not exhibit any differences between the ages of 18 and 50 years, although a significant reduction was observed between the ages of 50 and 70 years. Narici and Maffulli31 suggested that sedentary behavior may play a significant role in the reduction of lower-limb muscle mass, while the upper-limb muscle mass is preserved as a function of use in activities of daily living.
Corroborating the results of previous studies6-8,10,29, we observed differences in isometric muscle strength reduction in the upper and lower limbs. Specifically, the muscle strength of the lower limbs was significantly decreased in all groups evaluated, whereas no significant changes were seen for the upper limbs. This age-associated difference in the reduction of muscle strength between the upper and lower limbs has been attributed to changes in the patterns of the physical activities performed. As a consequence, the musculoskeletal system adapts to differences in physical activity demand associated with aging. Ferreira et al.32 compared the physical activity level and intensity of the upper and lower limbs in active, functionally independent young and elderly Brazilian women living in a medium-sized city. The results suggested that the activity level of the upper limbs increased, while the activity of the lower limbs decreased, with age. Kern et al.33 quantified the activity of the upper and lower limbs in healthy men and women during a 10-hour period of normal use and found that the upper-limb muscles were activated 67% more often than the lower-limb muscles, although the latter exhibited greater amplitude. In addition, Theou et al.34 measured the activity and quiescence of the biceps brachii, triceps brachii, vastus lateralis, and biceps femoris muscles in women aged 68 to 90 years by means of surface EMG over a 9-hour period in a typical day, and the results showed greater muscle activity in the arm compared to the thigh muscles.
the upper limbs compared to the lower limbs29. In addition, impairments in the activation mechanisms of muscles or muscle groups during a maximal voluntary isometric contraction (MVIC) have been significantly associated with the muscle strength reduction that occurs with age35.
In comparison to the vastus lateralis muscle, which exhibited a reduction in RMSn together with age, the RMSn of the finger flexor muscles did not exhibit significant differences among the groups, although this level was slightly increased in group OA. Bazzucchi et al.36 reported a reduction in EMG signal power for the vastus lateralis and biceps brachii muscles during MVIC of the knee extensors and elbow flexors, respectively, in elderly compared to young women. Moreover, other studies have reported a reduction in EMG signal power during MVIC of the elbow flexors15 and knee extensors14 in older adults compared to youths. However,
no studies have assessed the EMG signal power of the finger flexor muscles in youths and older adults using isometric hand grip tests. In addition, none of the abovementioned studies described the method used to normalize the EMG signals, which makes the comparison of our findings difficult. The characteristics of the EMG signal can be influenced by several individual factors, such as muscle volume and thickness of the adipose tissue interposed between the electrodes and assessed muscles. Therefore, as the subcutaneous adipose tissue increases and the muscle mass decreases with age, comparisons of raw EMG signals between youths and older adults are not recommended12. To compare the EMG signal power among different groups of individuals, it is recommended to normalize the signal to the power achieved by each individual37 during a MVIC. However, as in the present study, because the EMG signal power during a MVIC was selected Table 1. Volunteer characteristics.
Variables YO (n=33) MA (n=15) OA (n=15) p value
Age (years) 24.7±3.5 58.6±4.2* 72.0±4.2* <0.001
Body Mass (kg) 58.6±7.7 66.7±10.6* 62.4±7.1 0.006
Height (cm) 161.8±5.4 152.9±4.9* 153.4±6.0* <0.001 BMI (kg/m²) 22.4±2.9 28.5±4.3* 26.4±2.4* <0.001
Body Fat (%) 29.9±5.7 38.6±5.6* 38.4±5.3* <0.001
FFM total (kg) 39.1±3.7 39.3±4.3 37.0±3.0 0.211 AFFM/height² (kg/m²) 7.4±0.6 7.5±0.7 7.0±0.4 0.080
Mean ± standard deviation; n = number of participants; * vs. group YO; YO = young; MA = middle age; OA = older adults; BMI = body mass index; FFM = fat-free mass; AFFM = appendicular fat-free mass.
Table 2. A comparison of isometric muscle strength, FFM and EMG signal power for the dominant upper limb.
Variables YO (n=33) MA (n=15) OA (n=15) p value
HS (kgf) 27.0±4.6 26.6±4.7 25.4±3.9 0.523
FFM UP (kg) 1.9±0.2 1.8±0.3 1.7±0.2* 0.027
RMSs FF (uV) 101.9±37.5 94.6±43.4 137.7±124.4 0.754
Mean ± standard deviation; n = number of participants; * vs. group YO; YO = young; MA= middle age; OA = older adults; HS = handgrip strength; FFM = fat-free mass; RMSs = root mean square standardized; FF = finger flexors; UP = upper limb.
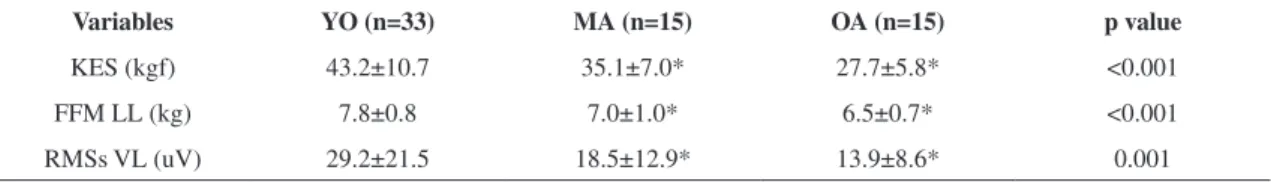
Table 3. A comparison of isometric muscle strength, FFM and EMG signal power for the dominant lower limb.
Variables YO (n=33) MA (n=15) OA (n=15) p value
KES (kgf) 43.2±10.7 35.1±7.0* 27.7±5.8* <0.001
FFM LL (kg) 7.8±0.8 7.0±1.0* 6.5±0.7* <0.001 RMSs VL (uV) 29.2±21.5 18.5±12.9* 13.9±8.6* 0.001
as an outcome variable, this measurement could not be used for normalization. For this reason, we chose to normalize the RMS variable to the FFM of the limbs to represent the EMG signal power developed per FFM unit.
The maintenance of absolute isometric muscle strength associated with the (non-significant) increase in RMSn in the upper limbs in group OA and the reduction of isometric muscle strength and RMSn in the lower limbs in groups MA and OA compared to group YO indicate that the adaptation of the upper and lower limbs to the physiological changes associated with aging occurs in a differential manner. Thus, one might assume that an increase in muscle activation and/or active motor unit firing frequency represents an efficient mechanism for increasing muscle strength in the upper limbs, particularly in older adults.
The results of the present study bear significant clinical implications, as they emphasize the relevance of preventive interventions for muscle strength preservation, particularly for the lower limbs in middle-aged and elderly women. This type of intervention is extremely relevant, as it could influence modifiable risk factors for weakness, mobility loss and falls in older adults. In addition, an understanding of the adaptive mechanisms developed to compensate for the physiological changes associated with age may help elucidate the process of aging and thus provide sounder foundations for the development of interventions at various healthcare levels, including rehabilitation. Based on the patterns of muscle activation most closely associated with adaptations due to aging, one might assume that exercises resulting in frequent, but not necessarily more intense, activation of the lower-limb muscles could produce satisfactory outcomes.
One of the limitations of the present study was its cross-sectional nature, and longitudinal studies are therefore needed to confirm these results. Additionally, studies assessing modifications in the coactivation of antagonist muscles and the changes in the proportion of the muscle fiber composition associated with aging are needed. Finally, studies including the control of global physical activity, as well as that of the limbs separately, are also needed.
Conclusions
To summarize, the results of the present study indicate that the lower limbs are more affected by aging than the upper limbs, as demonstrated by
a greater reduction in isometric muscle strength, FFM and EMG signal power. Based on the results of previous studies that assessed changes in limb activity patterns in older adults, one might suggest that differences between the upper and lower limbs are related to neuromuscular adaptations derived from greater activation of the upper limbs compared to the lower limbs. Therefore, exercise practices demanding more frequent activation of lower-limb muscles may be beneficial.
Acknowledgments
We acknowledge Marcelly Mancini, Letícia Moreira, Josiane Almeida, Marcos Paulo Azevedo and Fred Frizero for their help in data collection.
We also acknowledge the Brazilian Federal Agency for Support and Evaluation of Graduate Education (Coordenação de Aperfeiçoamento de Pessoal de Nível Superior - CAPES) for funding this study.
References
1. Seene T, Kaasik P. Muscle weakness in the elderly: role of sarcopenia, dynapenia, and possibilities for rehabilitation. Eur Rev Aging Phys Act. 2012; 9(2):109-17. http://dx.doi. org/10.1007/s11556-012-0102-8
2. Lauretani F, Russo CR, Bandinelli S, Bartali B, Cavazzini C, Di Iorio A, et al. Age-associated changes in skeletal muscles and their effect on mobility: an operational diagnosis of sarcopenia. J Appl Physiol. 2003;95(5):1851-60. PMid:14555665.
3. Topinková E. Aging, Disability and Frailty. Ann Nutr Metab. 2008;52(Suppl.1):6-11. PMid:18382070. http:// dx.doi.org/10.1159/000115340
4. Hartman MJ, Fields DA, Byrne NM, Hunter GR. Resistance training improves metabolic economy during functional tasks in older adults. J Strength Cond Res. 2007;21(1):91-5. PMid:17313273. http://dx.doi. org/10.1519/00124278-200702000-00017
5. Xue QL, Beamer BA, Chaves PH, Guralnik JM, Fried LP. Heterogeneity in rate of decline in grip, hip, and knee strength and the risk of all-cause mortality: The women’s health and aging study II. J Am Geriatr Soc. 2010;58:2076-84. PMid:21054287 PMCid:PMC3058914. http://dx.doi. org/10.1111/j.1532-5415.2010.03154.x
6. Lynch NA, Metter EJ, Lindle RS, Fozard JL, Tobin JD, Roy TA, et al. Muscle quality. I. Age-associated differences between arm and leg muscle groups. J Appl Physiol. 1999;86(1):188-94. PMid:9887130.
Sci. 2001;56:B209-17. PMid:11320101. http://dx.doi. org/10.1093/gerona/56.5.B209
8. Samuel D, Wilson K, Martin HJ, Allen R, Sayer AA, Stokes M. Age-associated changes in hand grip and quadriceps muscle strength ratios in healthy adults. Aging Clin Exp Res. 2012;24(3):245-50. PMid:23114550. 9. Hicks GE, Shardell M, Alley DE, Miller RR, Bandinelli
S, Guralnik J, et al. Absolute strength and loss of strength as predictors of mobility decline in older adults: the InCHIANTI study. J Gerontol A Biol Sci Med Sci. 2012;67(1):66-73. PMid:21546582 PMCid:PMC3260485. http://dx.doi.org/10.1093/gerona/glr055
10. Janssen I, Heymsfield SB, Wang Z, Ross R. Skeletal muscle mass and distribution in 468 men and women aged 18-99 yr. J Appl Physiol. 2000;89:81-8. PMid:10904038. 11. Goodpaster BH, Park SW, Harris TB, Kritchevsky SB,
Nevitt M, Schwartz AV, et al. The loss of skeletal muscle strength, mass, and quality in older adults: the health, aging and body composition study. J Gerontol A Biol Sci Med Sci. 2006;61(10):1059-64. PMid:17077199. http:// dx.doi.org/10.1093/gerona/61.10.1059
12. Klass M, Baudry S, Duchateau J. Voluntary activation during maximal contraction with advancing age: a brief review. Eur J Appl Physiol. 2007;100(5):543-51. PMid:16763836. http://dx.doi.org/10.1007/ s00421-006-0205-x
13. De Luca CJ. Phisyology and mathematics of myoelectric signals. IEEE Trans Biomed Eng. 1979;26(6):313-25. PMid:468280. http://dx.doi.org/10.1109/ TBME.1979.326534
14. Macaluso A, Nimmo MA, Foster JE, Cockburn M, McMillan NC, De Vito G. Contractile muscle volume and agonist-antagonist coactivation account for differences in torque between young and older women. Muscle Nerve. 2002;25(6):858-63. PMid:12115975. http://dx.doi. org/10.1002/mus.10113
15. Esposito F, Malgrati D, Veicsteinas A, Orizio C. Time and frequency domain analysis of electromyogram and sound myogram in the elderly. Eur J Appl Physiol Occup Physiol. 1996;73(6):503-10. PMid:8817119. http://dx.doi. org/10.1007/BF00357671
16. Farina D, Fosci M, Merletti R. Motor unit recruitment strategies investigated by surface emg variables. J Appl Physiol. 2002;92(1):235-47. PMid:11744666.
17. Novo Júnior J, inventor; Universidade Federal de Juiz de Fora, cessionário. Configuração aplicada em empunhadura. Brasil patente DI 6901797-2; 2009 may 05. 18. European Recommendations for Surface Electromyography (SENIAN). Recommendations for sensor locations on individual muscles [online]. [cited 2011 Nov 28]. Available from: www.seniam.org.
19. Duque J, Masset D, Malchaire J.Evaluation of handgrip force from EMG measurements. Appl Ergon. 1995;26(1):61-6. http://dx.doi.org/10.1016/0003-6870(94)00003-H 20. Junqueira L. Anatomia palpatória e seus aspectos clínicos.
Rio de Janeiro: Guanabara Koogan; 2010.
21. Amaral JF, Mancini M, Novo Júnior JM. Comparison of three hand dynamometers in relation to the accuracy
and precision of the measurements. Rev Bras Fisioter. 2012;16(3):216-24.
22. Amaral JF, Castro EA, Mancini M, Doimo LA, Novo Júnior J M. Taxa de desenvolvimento da força muscular de membros superiores e inferiores em mulheres idosas. Motricidade. 2012;8(2):454-61.
23. Fess E. Grip strength. In: Casanova JS. Clinical assessment recommendations. 2nd ed. Chicago: American Society of Hand Therapists; 1992. p. 41-5.
24. Watanabe K, Kouzaki M, Merletti R, Fujibayashi M, Moritani T. Spatial EMG potential distribution pattern of vastus lateralis muscle during isometric knee extension in young and elderly men. J Electromyogr Kinesiol. 2012;22(1):74-9. PMid:21996320. http://dx.doi. org/10.1016/j.jelekin.2011.09.010
25. Lohman TG. Advances in body composition assessment. Champaign: Human Kinetics Publishers; 1992.
26. Heymsfield SB, Smith R, Aulet M, Bensen B, Lichtman S, Wang J, et al. Appendicular skeletal muscle mass: measurement by dual-photon absorptiometry. Am J Clin Nutr. 1990;52(2):214-8. PMid:2375286.
27. Mitchell WK, Williams J, Atherton P, Larvin M, Lund J, Narici M. Sarcopenia, dynapenia, and the impact of advancing age on human skeletal muscle size and strength: a quantitative review. Front Physio. 2012;3:260. 28. Baumgartner RN, Koehler KM, Gallagher D, Romero
L, Heymstleld SB, Ross RR, et al. Epidemiology of sarcopenia among the elderly in New Mexico. Am J Epidemiol. 1998;147(8):755-63. PMid:9554417. http:// dx.doi.org/10.1093/oxfordjournals.aje.a009520 29. Candow DG, Chilibeck PD. Differences in Size, Strength,
and Power of Upper and Lower Body Muscle Groups in Young and Older Men. J Gerontol A Biol Sci Med Sci. 2005;60(2):148-56. http://dx.doi.org/10.1093/ gerona/60.2.148
30. Tankó LB, Movsesyan L, Mouritzen U, Christiansen C, Svendsen OL. Appendicular lean tissue mass and the prevalence of sarcopenia among healthy women. Metabolism. 2002;51(1):69-74. PMid:11782875. http:// dx.doi.org/10.1053/meta.2002.28960
31. Narici MV, Maffulli N. Sarcopenia: characteristics, mechanisms and functional significance. British Medical Bulletin. 2010;95:139-59. PMid:20200012. http://dx.doi. org/10.1093/bmb/ldq008
32. Ferreira L, Gobbi S, Gobbi LT. An explanatory mechanism for the different decline in limb strength in older women. Arch Gerontol Geriatr. 2009;49(3):373-7. PMid:19162342. http://dx.doi.org/10.1016/j.archger.2008.12.002 33. Kern DS, Semmeler JG, Enoka RM. Long-term activity in
upper - and lower-limb muscles of humans. J Appl Physiol. 2001;91:2224-32. PMid:11641365.
34. Theou O, Jones GR, Vandervoort AA, Jakobi JM. Daily muscle activity and quiescence in non-frail, pre-frail, and frail older women. Exp Gerontol. 2010;45:909-17. PMid:20736056. http://dx.doi.org/10.1016/j. exger.2010.08.008
36. Bazzucchi I, Felici F, Macaluso A, De Vito G. Differences between young and older women in maximal force, force fluctuations, and surface EMG during isometric knee extension and elbow flexion. Muscle Nerve. 2004;30(5):626-35. PMid:15389720. http://dx.doi. org/10.1002/mus.20151
37. Knutson LM, Soderberg GL, Ballantyne BT, Clarke WR. A study of various normalization procedures for within day electromyographic data. J Electromyogr Kinesiol. 1994;4(1):47-59. http://dx.doi. org/10.1016/1050-6411(94)90026-4
Correspondence Josária Ferraz Amaral
Universidade Federal de Juiz de Fora (UFJF) Faculdade de Educação Física