http://dx.doi.org/10.1590/1806-9061-2017-0496
Author(s)
Muniz JCLI
Barreto SLTI
Viana GSI
Mencalha RII
Reis RSIII
Hannas MII
Barbosa LMRI
Maia RCI
I Universidade Federal de Viçosa -
Departa-mento de Zootecnia
II Universidade Federal de Lavras
III Universidade Federal de Sao Joao del-Rei
Mail Address
Corresponding author e-mail address Jorge Cunha Lima Muniz
Avenida Peter Henry Rolfs, s/n , Viçosa, Minas Gerais 36570-900 - Brazil Tel: (31) 992263733
Email: [email protected]
Keywords
Carcass traits, Coturnix coturnix coturnix, performance.
Submitted: 16/May/2017 Approved: 30/October/2017
ABSTRACT
This experiment was conducted to evaluate the effects of dietary nitrogen-corrected apparent metabolizable energy (AMEn) levels on meat-type quail performance and carcass traits from 1 to 14d of age. A total of 1120 not sexed meat-type quails were randomly distributed to seven treatments, with eight replicates with 20 quails each. A basal corn and soybean meal-based diet was formulated to meet or exceed quail nutritional requirements, except for ME. Graded levels of soybean oil were added to the basal diet in replacement, to sand, to obtain dietary treatments (2,600; 2,700; 2,800; 2,900; 3,000; 3,100 and 3,200 KcalAMEn/kg diet). Data were analyzed as one-way ANOVA and optimum AMEn levels were estimated using polynomial regression model. Increasing in dietary AMEn levels elicited a linear decrease (p<0.01) in feed intake and nutrient intake (AMEn, protein and lysine). Quail weight gain and final body weight exhibited a quadratic response (p<0.03) to increased AMEn levels, being both optimized at 2820 KcalAMEn/kg diet. Graded AMEn levels elicited a linear increase (p<0.01) in carcass dry matter and fat content, whereas moisture content was linearly decreased (p<0.01). The protein content of the carcasses was not influenced (p>0.05) by AMEn. Based on the results, the dietary AMEn level that warrants adequate performance and carcass traits of meat-type quails from 1 to 14d of age is 2,820 Kcal/kg diet.
INTRODUCTION
In the past, the commercialization of quail meat in Brazil was restricted to the slaughter of male and female Japanese quails, which due to age, had their fertility reduced and therefore, were no longer useful to reproduction. In general, the carcasses had a small size and the meat a poor quality, mainly regarding tenderness. However, over the last years, this scenario has changed due to the introduction of type quails in the Brazilian market. Despite the increasing in meat-type quail production, little research efforts have been put forward on establishing meat-type quail nutritional requirements.
Nutrition is well acknowledged as the major input in production cost, and energy represents the most costly nutrient in poultry diets. Thus, in order to optimize feeding programs, knowing the energy content of feedstuffs as well as establishing the ideal energy intake for poultry is essential to warrant the maximum economic returns (Suida
Comparing research findings obtained with meat-type quails is difficult since the most part of published literature refers to Japanese quail nutrition (Barreto et al., 2006). Moreover, few information on meat-type quail requirement in the initial (from 1d to 14d) and growing-finishing phase (from 15d to 35d), in separate, are found in literature. The conduction of trials to establish quail nutrient needs is crucial to update the existing tables of quail nutritional requirements. Thus, this study was conducted to estimate the AMEn level for optimum meat-type quail performance and carcass trait in the starter phase.
MATERIALS AND METHODS
All the procedures adopted in this study, involving animal care and use, were previously approved by the Ethics Animal Care and Use Committee of the Universidade Federal de Viçosa (protocol no. 37/2012), which is consistent with the ethical principles of animal
experimentation established by the Brazilian College of Animal Experimentation (COBEA, 1991).
Animal husbandry, experimental design, and diets
One-day-old meat-type quails, vaccinated for Marek disease were obtained from a local commercial hatchery and housed in curtain sided room thermally controlled. A total of one thousand one hundred twenty quails (average body weight 9.53g), was randomly assigned into fifty-six 50×50×5 cm (width×length×height) stain-less steel cages placed over a masonry countertop (120 cm height), previously covered by wood shavings. Each cage was equipped with one incandescent light, one nipple drinker and one trough feeder, where twenty quails were allotted. A basal diet, based on corn and soybean meal, was formulated to meet or exceed Silva & Costa (2009). Nutritional composition of feedstuffs used in experimental diets corresponded to those described by Rostagno (2011). Experimental treatments (Table 1) consisted of seven levels of
Table 1 – Composition of experimental diets.
Metabolizable Energy levels (kcal/kg)
Ingredients 2.600 2.700 2.800 2.900 3.000 3.100 3.200
Corn (7%) 42.343 42.343 42.343 42.343 42.343 42.343 42.343 Soybean meal (48%) 45.563 45.563 45.563 45.563 45.563 45.563 45.563
Inert 7.000 5.863 4.725 3.587 2.450 1.312 0.174
Soybean oil 1.132 2.270 3.407 4.545 5.683 6.820 7.958
Limestone 1.225 1.225 1.225 1.225 1.225 1.225 1.225
Dicalcium phosphate 1.051 1.051 1.051 1.051 1.051 1.051 1.051
Salt 0.384 0.384 0.384 0.384 0.384 0.384 0.384
L-lysine HCl (79%) 0.056 0.056 0.056 0.056 0.056 0.056 0.056 DL-methionine (99%) 0.445 0.445 0.445 0.445 0.445 0.445 0.445 L-triptophan (99%) 0.080 0.080 0.080 0.080 0.080 0.080 0.080 L-isoleucine (99%) 0.118 0.118 0.118 0.118 0.118 0.118 0.118 L-arginine (99%) 0.263 0.263 0.263 0.263 0.263 0.263 0.263 Choline chloride (60%) 0.100 0.100 0.100 0.100 0.100 0.100 0.100 Mineral premixl1 0.070 0.070 0.070 0.070 0.070 0.070 0.070
Vitamin premix2 0.100 0.100 0.100 0.100 0.100 0.100 0.100
Antioxidant3 0.010 0.010 0.010 0.010 0.010 0.010 0.010
Antibiotic4 0.010 0.010 0.010 0.010 0.010 0.010 0.010
Coccidiostat5 0.050 0.050 0.050 0.050 0.050 0.050 0.050
Total 100.00 100.00 100.00 100.00 100.00 100.00 100.00 Calculated composition
Metabolizable energy (kcal/kg) 2.600 2.700 2.800 2.900 3.000 3.100 3.200 Crude protein (%) 25.95 25.95 25.95 25.95 25.95 25.59 25.59 Digestible Lys (%) 1.381 1.381 1.381 1.381 1.381 1.381 1.381 Digestible Met + Cys (%) 1.113 1.113 1.113 1.113 1.113 1.113 1.113 Digestible Thr (%) 0.885 0.885 0.885 0.885 0.885 0.885 0.885 Digestible Trp (%) 0.399 0.399 0.399 0.399 0.399 0.399 0.399
Calcium (%) 0.852 0.852 0.852 0.852 0.852 0.852 0.852
Non-phytate phosphorous (%) 0.325 0.325 0.325 0.325 0.325 0.325 0.325
Sodium (%) 0.170 0.170 0.170 0.170 0.170 0.170 0.170
metabolizable energy (2.600, 2.700, 2.800, 2.900, 3.000, 3.100 and 3.200 kcal/kg), which were obtained through graded replacement of sand, by soybean oil. Throughout the feeding trial birds had free access to water and feed. Lighting program consisted of 24 h of light (natural + artificial). The minimum and maximum average daily room temperatures recorded throughout the experiment were 25.30 ± 1.2 and 37.63 ± 2.8, respectively.
Performance and carcass trait measure-ments
At 14 d of age, birds and feeders were weighed to obtain feed intake (g) and body weight (g). Weight gain (g) was obtained by the difference between the average of the final and initial body weight, whereas feed conversion (g/g) were calculated through the division between feed intake and weight gain. The intake of AMEn (kcal), crude protein (g) and lysine (g) were calculated by multiplying feed intake by the respective concentrations of the afore mentioned nutrients in diets. Mortality was daily recorded to adjust feed intake and feed conversion. After weighing birds and feeders, two birds were selected according to body weight for further carcass trait measurements. After four hours of feed withdrawal period, the selected birds were humanely slaughtered by cervical dislocation between the atlas and the occipital bone. After the slaughter, birds were immediately frozen. Then, frozen samples were ground in an industrial meat grinder, lyophilized
and stored for further analyses of carcass composition, according to Silva & Queiroz (2004).
Statistical analysis
Data were analyzed by one-way ANOVA using Sistema para Análises Estatísticas (SAEG, 2007) software package. Ideal AMEn level for performance data assessed was estimated by polynomial (linear or quadratic) regression model. Significant effects were considered when p≤0.05.
RESULTS AND DISCUSSION
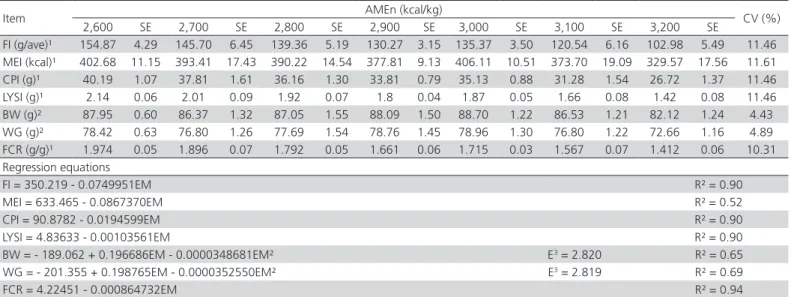
Feed intake exhibited a linear decrease (p<0.05) as dietary AMEn levels increased, showing a reduction by 7.50 g for every increase in 100 kcal in AMEn (Table 2). These results support those found by Reis (2010), Ton (2011) and Scherer (2011), who observed a linear decrease in quail feed intake from 1 to 14 d of age in response to increasing dietary AMEn. These findings confirm the hypothesis that, indeed, energy plays an important role in feed consumption; and that poultry tend to regulate feed intake to maintain constant energy intake. Indeed, AMEn is the nutrient responsible for driving feed intake, but excessive energy supply may promote failure in feed intake control (Mbajiorgu 2011). Such assumption may explain the linear decrease (p<0.05) in AMEn intake observed in the current study as dietary AMEn increased. As a consequence of the depression in quail feed intake, crude protein and
Table 2 – Growth performance of meat-type quails fed increasing dietary metabolizable energy levels from 1 to 14 d of age.
Item AMEn (kcal/kg) CV (%)
2,600 SE 2,700 SE 2,800 SE 2,900 SE 3,000 SE 3,100 SE 3,200 SE
FI (g/ave)¹ 154.87 4.29 145.70 6.45 139.36 5.19 130.27 3.15 135.37 3.50 120.54 6.16 102.98 5.49 11.46 MEI (kcal)¹ 402.68 11.15 393.41 17.43 390.22 14.54 377.81 9.13 406.11 10.51 373.70 19.09 329.57 17.56 11.61 CPI (g)¹ 40.19 1.07 37.81 1.61 36.16 1.30 33.81 0.79 35.13 0.88 31.28 1.54 26.72 1.37 11.46 LYSI (g)¹ 2.14 0.06 2.01 0.09 1.92 0.07 1.8 0.04 1.87 0.05 1.66 0.08 1.42 0.08 11.46 BW (g)² 87.95 0.60 86.37 1.32 87.05 1.55 88.09 1.50 88.70 1.22 86.53 1.21 82.12 1.24 4.43 WG (g)² 78.42 0.63 76.80 1.26 77.69 1.54 78.76 1.45 78.96 1.30 76.80 1.22 72.66 1.16 4.89 FCR (g/g)¹ 1.974 0.05 1.896 0.07 1.792 0.05 1.661 0.06 1.715 0.03 1.567 0.07 1.412 0.06 10.31 Regression equations
FI = 350.219 - 0.0749951EM R² = 0.90
MEI = 633.465 - 0.0867370EM R² = 0.52
CPI = 90.8782 - 0.0194599EM R² = 0.90
LYSI = 4.83633 - 0.00103561EM R² = 0.90
BW = - 189.062 + 0.196686EM - 0.0000348681EM² E3 = 2.820 R² = 0.65
WG = - 201.355 + 0.198765EM - 0.0000352550EM² E3 = 2.819 R² = 0.69
FCR = 4.22451 - 0.000864732EM R² = 0.94
Nitrogen-corrected apparent metabolizable energy (AMEn), Feed intake (FI), metabolizable energy intake (MEI), crude protein intake (CPI), lysine intake (LYSI), body weight (BW); weight gain (WG), feed conversion rate (FCR), standard error (SE), coefficient of variation (CV), estimated AMEn level (E);
1 Linear effect;
lysine intake were also linearly decreased (p<0.05) by graded dietary AMEn.
Final body weight and weight gain exhibited a quadratic response (p<0.05) to increasing AMEn levels. Optimum body weight (88.30 g) and weight gain (78.80) were reached at 2,820 kcal AMEn/kg diet, which corresponded to an energy-to-protein ratio of 108.60. Similarly, Scherer (2011) verified optimum performance in starter meat-type quails fed energy-to-protein of 108.90. Dietary energy, derived from carbohydrates, lipids, and protein provides conditions for adequate poultry growth. Nevertheless, based on its influence on feed intake, excessive dietary energy supply may limit nutrients intake (e.g. amino acids) and consequently compromise bird performance (Maiorka
et al., 2004). In the current study, increasing in dietary AMEn decreased protein and lysine intake, which might explain the quadratic responses observed on FBW and WG.
Starter phase is marked by the immaturity of the gastrointestinal tract, which presents limited nutrient digestion and absorption capacity (Lima 2016). Lipids, in particular, appear to have its digestion and absorption more compromised among nutrients. Reports indicate low pancreatic lipase activity in pre-starter broiler chicks after hatching, which is graded enhanced until 15d of age when it reaches maximum activity (Nir 1993). Macari (2002) reported that broiler chick enterocytes reach total development approximately 2-3 weeks after hatching. Presumably, diets containing higher AMEn levels, due to high soybean oil inclusion, might have supplanted gut capacity of lipids digestion and absorption, which might have contributed to the decrease in BW and WG in quails in the current study. Ton (2011) reported a linear decrease in meat-type quail WG and BW at 14 d of age by increasing dietary
AMEn levels from 2,800 to 3,100 Kcal/kg. Contrary to our results, however, Corrêa (2007) did not observe detrimental effects of AMEn levels on 7-to-21-day-old meat-type quail BW and WG by ranging dietary AMEn from 2,900 to 3,100 Kcal/kg.
Feed conversion was linearly improved (p<0.05) in response to increasing AMEn levels, decreasing by 0.1 points for every increase in 100 Kcal in AMEn (Table 2). Feed intake decreased 33.50% when dietary AMEn ranged from 2,600 to 3,200 Kcal/kg, whereas the WG was 7.98% lower in birds fed the higher AMEn level. The effects of AMEn in feed intake explain the improvement in feed conversion. On the other hand, Scherer (2011) observed a quadratic response in meat-type quail feed conversion at the initial phase which were optimized at 2,997 kcal/kg.
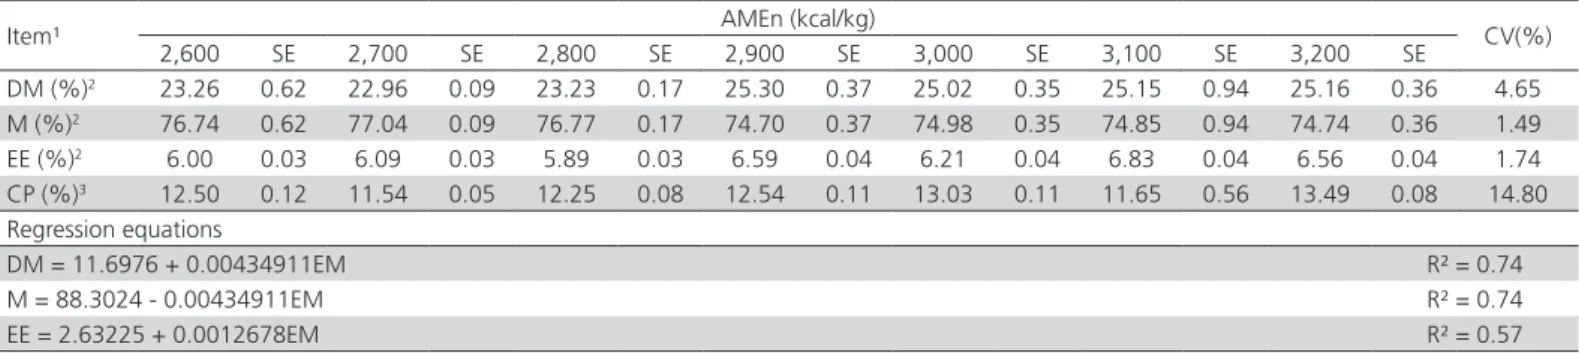
Dry matter content in quail carcass was linearly increased (p<0.01) as AMEn intake increased and hence carcass moisture content decreased (p<0.01) as detailed in Table 3. These findings are in agreement with those reported by Scherer et al. (2011) for meat-type quails in the initial phase. Contrary to fat deposition, body protein accretion is positively associated with moisture content. Boekholt et al.
(1994) demonstrated that for each 1g of crude protein retained, approximately an amount of 3g of water was deposited in muscle tissue. The response observed on dry matter content as a function of increasing AMEn levels may be explained by fat content in carcass, which were linearly increased (p<0.01) by the increase in dietary AMEn supply. In turn, the increase observed on carcass fat content may be explained by the increase in the energy:protein ratio and as a consequence of the increase in soybean oil inclusion when AMEn content increased. According to Sakomura et al. (2004), the inclusion of vegetable oils decrease heat increment
Table 3 – Carcass traits of meat-type quails fed increasing dietary metabolizable energy levels from 1 to 14 d of age.
Item¹ AMEn (kcal/kg) CV(%)
2,600 SE 2,700 SE 2,800 SE 2,900 SE 3,000 SE 3,100 SE 3,200 SE
DM (%)2 23.26 0.62 22.96 0.09 23.23 0.17 25.30 0.37 25.02 0.35 25.15 0.94 25.16 0.36 4.65
M (%)2 76.74 0.62 77.04 0.09 76.77 0.17 74.70 0.37 74.98 0.35 74.85 0.94 74.74 0.36 1.49
EE (%)2 6.00 0.03 6.09 0.03 5.89 0.03 6.59 0.04 6.21 0.04 6.83 0.04 6.56 0.04 1.74
CP (%)3 12.50 0.12 11.54 0.05 12.25 0.08 12.54 0.11 13.03 0.11 11.65 0.56 13.49 0.08 14.80
Regression equations
DM = 11.6976 + 0.00434911EM R² = 0.74
M = 88.3024 - 0.00434911EM R² = 0.74
EE = 2.63225 + 0.0012678EM R² = 0.57
Nitrogen-corrected apparent metabolizable energy (AMEn),Dry matter (DM), moisture (M), ether extract (EE), crude protein (CP), standard error (SE), Coefficient of variation (CV);
1 Values on dry matter basis;
2Linear effect;
which result in a higher net energy content of diets. Fat deposition is more efficient when the organism uses dietary lipids and endogenous synthesis from glycerol and fatty acids. When fat sources are included in diets, the endogenous synthesis of fatty acids are down regulated, which result in higher amounts of energy available for productive purposes (Franco, 1998).
Protein content in carcass was unaffected (p>0.05) by AMEn concentration in the diets, which are in agreement with Scherer et al. (2011). The afore mentioned authors noticed that despite the lower intake of nutrients due to the lower feed intake of quails fed high AMEn levels, meat-type quails reduced body weight but not protein content in carcass. Nutrient intake was indeed lower in quails fed the highest AMEn levels. However, the oil, due to its extra-caloric effect, may have attenuated the reduced nutrient supply by increasing digestibility by increasing digesta retention in gastrointestinal tract (Sakomura et al., 2004; Mateos & Sell, 1981). Such hypothesis was confirmed by Cançado & Baião (2002) who observed an increase in protein digestibility in broilers fed diets with higher oil content compared with birds fed diets without oil.
CONCLUSION
Based on performance and carcass composition, the level of 2,820 kcal AMEn/kg meet meat-type quail requirements.
REFERENCES
Boekholt HA, Van der Grinten P, Schreurs VV, Los MJ, Leffering CP. Effect of dietary energy restriction on retention of protein, fat and energy in broilers chickens. British Poultry Science 1994;35(4):603-614.
Cobea - Colégio Brasileiro de Experimentação Animal. Princípios éticos da experimentação animal. São Paulo, 1991. [cited 2015 Mar]. Available from: http://www.cobea.org/COBEA/etica.htm.
Corrêa GSS, Silva MA, Corrêa AB, Fontes DO, Torres RA, Dionello NJL, et al. Níveis de proteína bruta para codornas de corte durante o período de crescimento. Arquivo Brasileiro de Medicina Veterinária e Zootecnia 2007;60(3):797-804.
Degolier TF, Duke GE, Carraway, RE. Neurotensin Decreases pepsin output and gastrointestinal motility in chickens. Poultry Science 1997;76(10):1435–1439.
Degolier TF, Carraway RE, Duke GE. Release of avian neurotensin in response to intraluminal contents in the duodenum of chickens. Poultry Science 2013;92(2):418–423.
de Persio S, Utterback PL, Utterback CW, Rochell SJ, O’Sullivan N, et al.
Effects of feeding diets varying in energy and nutrient density to Hy-Line W-36 laying hens on production performance and economics. Poultry Science 2015;94(2):195–206.
Ferket PR, Gernat AG. Factors that affect feed intake of meat birds: a review. International Journal of Poultry Science 2006;5(10):905-911.
Lima VBS, Dourado LRB, Machado LP, Biagiotti D, Lima SBPL, Ferreira GJBC,
et al. Cottonseed oil in diets for broilers in the pre-starter and starter phases. Plos One 2016;11(1):147-152.
Maiorka A, Dahlke F, Santin E, Kessler AM, Penz Jr. AM. Effect of energy levels of diets formulated on total or digestible amino acid basis on broiler performance. Brazilian Journal of Poultry Science 2004;6(2):87-91.
Mbajiorgu CA, Ng`ambi JW, Norris DD. Voluntary feed intake and nutrient composition in chickens. Asian Journal of Animal and Veterinary Advances 2011;6(1):20-28.
Nir I, Nitsan Z, Mahagua M. Comparative growth and development of the digestive organs and of some enzymes in broiler and egg type chicks after hatching. British Poultry Science 1993;34(3):523-532.
Reis RS, Barreto SLT, Torres RA, Muniz JCL, Mendonça MO, Viana GS, et al. Proteína bruta e energia metabolizável para codornas de corte de 1 a 14 dias de idade. Arquivos Brasileiros de Medicina Veterinária e Zootecnia 2014;66(11):903-910.
Rostagno HS, Albino LFT, Donzele JL, Gomes PC, Oliveira RF, Lopes DC, et al. Tabelas brasileiras para aves e suínos. composição de alimentos e exigências nutricionais. 3rd ed. Viçosa: Editora UFV; 2011.
Scherer C, Furlan AC, Martins EN, Scapinello C. Ton APS. Exigência de energia metabolizável de codornas de corte no período de 1 a 14 dias de idade. Revista Brasileira de Zootecnia 2011;40(11):2496-2501.
Silva JHV, Costa FGP. Tabela de exigência nutricional de codornas japonesas e europeias. 2nd ed. Jaboticabal: Fundação de Apoio à Pesquisa, Ensino
e Extensão; 2009.
Silva DJ, Queiroz ACD. Análises de alimentos: métodos químicos e biológicos. 3rd ed. Viçosa: Editora UFV; 2004.
Ton APS, Furlan AC, Martins EN, Toledo JB, Scherer C, Conti ACM. Exigências de lisina digestível e de energia metabolizável para codornas de corte em crescimento. Revista Brasileira de Zootecnia 2011;40(3):593-601.