Population structure of
Eupemphix nattereri
(Amphibia, Anura, Leiuperidae)
from Central Brazil
Daniela de Melo e Silva
1,2, Aparecido Divino da Cruz
1, Rogério Pereira Bastos
3, Raquel Loren Reis
1,
Mariana Pires de Campos Telles
4and José Alexandre Felizola Diniz-Filho
2,31
Núcleo de Pesquisas Replicon, Departamento de Biologia, Universidade Católica de Goiás, Goiânia,
GO, Brazil.
2
Programa de Pós-Graduação em Biologia Animal, Universidade de Brasília, Brasília, DF, Brazil.
3
Departamento de Biologia Geral, Instituto de Ciências Biológicas, Universidade Federal de Goiás,
Goiânia, GO, Brazil.
4Departamento de Zootecnia, Universidade Católica de Goiás, Goiânia, GO, Brazil.
Abstract
This study reports on 156 specimens of the amphibianEupemphix nattereri, a widely distributed leiuperid, obtained from 11 municipalities of central Brazil. The extent of genetic variation was quantified by determining the mean num-ber of alleles per locus and the proportion of polymorphic loci. An analysis of molecular variance (AMOVA) was per-formed on the random amplified polymorphic DNA (RAPD) haplotypes. The genetic distances obtained by calculating pairwiseΦst among local samples were used to determine population relationships using the unweighted pair-group method (UPGMA) and non-metric multidimensional scaling (NMDS). The cophenetic correlation was cal-culated to confirm agreement between the genetic matrix and the unweighted pair group method with averages (UPGMA) dendrogram. To determine if genetic distances were correlated to geographical distances we constructed pairwise genetic distance and geographical distance matrices and compared them using the Mantel test. The AMOVA results indicated significant genetic differences (p < 0.001) betweenE. nattereri populations, representing 69.5% of the within population genetic diversity. The Mantel test showed no significant correlation (r = 0.03; p = 0.45) between the genetic and geographical distance matrices. Our findings indicate that the genetic variation ofE. nattereri populations was randomly distributed in geographic space and that gene flow for this species is probably structured at spatial scales smaller than those between our samples
Key words: Eupemphix nattereri, gene flow, population structure, RAPD markers.
Received: April 6, 2006; Accepted:March 2, 2007.
Introduction
Amphibian populations have been the focus of nu-merous studies that have contributed to the general under-standing of ecological and evolutionary phenomena (Newman 1992; Wilbur, 1997; McDiarmid and Altig, 1999; Funket al., 2005). Amphibians are good models for investigating the genetics of wild animal populations be-cause they are widely distributed in most ecosystems, easy to sample in breeding assemblages and often philopatric to breeding sites. These characteristics can generate high lev-els of population genetic structure (McDiarmid and Altig, 1999; Beebee, 2005).
Although a global decline in amphibians has been re-ported since the 1980s, relatively little is known about the status of amphibian populations in South American coun-tries due to insufficient data on species distribution and population dynamics, combined with high levels of species diversity (Myerset al., 2000; Younget al., 2001). Informa-tion on the populaInforma-tion genetic structure of amphibians could help, at least in part, to understand the reason for such declines. Amphibian populations are often thought to have a metapopulation spatial structure (Alford and Richards, 1999), but few studies have actually assessed interpopu-lation movement, much less the effects of such movement on population dynamics and genetic structure (Newman and Squire, 2001). Amphibians are also thought to have low dispersal rates (Blausteinet al., 1994), although this may not apply to all species (Funket al., 2005). Low num-bers of breeding individuals and limited gene flow between
Send correspondence to Daniela de Melo e Silva. Universidade Católica de Goiás, Departamento de Biologia, Núcleo de Pesqui-sas Replicon. Rua 235 n. 40 Cep 74605-010, Goiânia, Goiás, Bra-zil. E-mail: [email protected]/[email protected].
populations can reduce genetic diversity in such a way that a species ceases to be viable (Blausteinet al., 1994; Kraai-jeveld-Smitet al., 2005; Spearet al., 2005; Telleset. al., 2006).
Neutral genetic markers have been used in studies of amphibian population structures (Rissleret al., 2004; Spear
et al., 2005; Telleset. al., 2006). DNA-based markers are capable of disclosing microevolutionary variation and PCR-based genotyping of molecular markers has greatly benefited areas such as population and conservation genet-ics, allowing the assessment of relatedness and genetic variability between individuals, populations, and species (Avise, 1994; Busoet al., 1998; Zhang and Hewitt, 2003). Random Amplified Polymorphic DNA (RAPD) is one class of DNA markers used to study the structure of ge-netic diversity in many species (Wuet al., 2002; Almeidaet al., 2003; Telleset al., 2006). This molecular marker can be used for rapid testing, due to its relatively low cost per reac-tion, the small amounts of DNA needed and the simple method of acquiring data on variation in genomic DNA (Welsh and McClelland, 1990; Hadryset al., 1992). RAPD markers have been considered suitable for genetic analysis because they allow for examination of accumulated genetic differences that are important at various taxonomic levels (Hardy, 2003). Furthermore, in comparison to codominant markers, dominant markers such as RAPD markers, easily generate a genetic profile even for species to which no prior genetic information is available (Mueller and Wolfenbar-ger, 1999).
The genusEupemphixbelongs to the anuran family Leiuperidae a widely distributed family which occurs in al-most all the Neotropics (Frost, 2007). The genera
Eupemphix (Leiuperidae) was described by Steindachner (1863) to include the frogEupemphix nattereri(Amphibia: Anura: Leptodactylidae), the type locality for which is Cuiabá, in the Brazilian state of Mato Grosso (Nascimento
et al., 2005). It is known thatE. nattereriis widely distrib-uted in South America, ranging from the east of Paraguay to the mid-east and southeast of Brazil (Frost, 2007) but, how-ever, little is known about the genetic structure of popula-tions of this species or any other frog belonging to this family.
The objective of this study was to investigate the ge-netic similarity and diversity within and between natural populations ofE. nattererifrom eleven geographical sites in central Brazil using RAPD markers. Genetic and geo-graphic distances were also associated to test whether nearby populations were more genetically similar than dis-tant populations, thus providing the first insight into the microevolutionary processes underlying genetic variation.
Material and Methods
Sample collection and DNA extraction
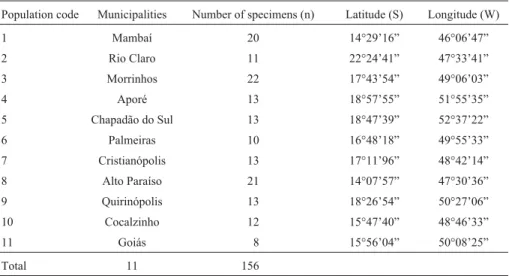
During the rainy seasons (October to March) of 2002-2004 we obtained 156 Eupemphix nattereri speci-mens from 11 localities in central Brazil, the number of specimens studied in each municipality and the geographic coordinates of the sampling areas are listed in Table 1. Voucher specimens are deposited in Brazil at the Zoologi-cal Collection of the Federal University of Goiás (ZUFG). This research was done according to the statutes of COBEA (Brazilian College of Animal Experimentation), once our institution does not have an ethics committee of animal ex-perimentation.
The 156E. nattererispecimens were humanly sacri-ficed and liver tissue was removed and stored at -20 °C until DNA extraction was performed. Genomic DNA was puri-fied from 20 mg of frozen liver with the Wizard Genomic DNA® purification Kit (Promega Corporation, USA), ac-cording to the procedures described by the manufacturer. To estimate the quality and amount of genomic DNA we
Table 1- The 11 localEupemphix nattereripopulations analyzed, sample sizes, municipalities in the Brazilian state of Goiás and the geographical coordi-nates.
Population code Municipalities Number of specimens (n) Latitude (S) Longitude (W)
1 Mambaí 20 14°29’16” 46°06’47”
2 Rio Claro 11 22°24’41” 47°33’41” 3 Morrinhos 22 17°43’54” 49°06’03”
4 Aporé 13 18°57’55” 51°55’35”
5 Chapadão do Sul 13 18°47’39” 52°37’22” 6 Palmeiras 10 16°48’18” 49°55’33” 7 Cristianópolis 13 17°11’96” 48°42’14” 8 Alto Paraíso 21 14°07’57” 47°30’36” 9 Quirinópolis 13 18°26’54” 50°27’06” 10 Cocalzinho 12 15°47’40” 48°46’33”
11 Goiás 8 15°56’04” 50°08’25”
subjected 5µL samples of extracted product to electropho-resis on 1% (w/v) agarose gel at 5V cm-1for 30 min. When necessary, the samples were diluted to 2.5 ngµL-1.
Random amplified polymorphic DNA (RAPD) analysis
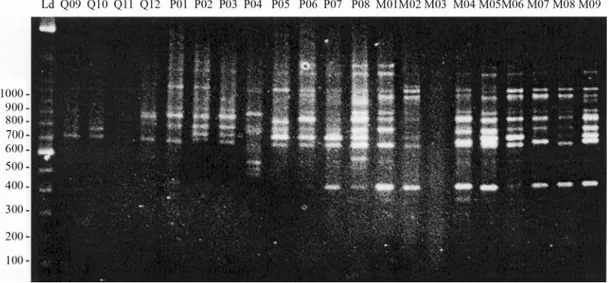
A total of 40 primers of 10 base pairs were tested to select those with the best amplification pattern. A prelimi-nary screening was performed with DNA from two frogs from the studied populations and allowed the identification of eight RAPD primers (Table 2) that yielded distinct, well-separated and reproducible bands. These bands were subsequently chosen for final analyses. Band repeatability for each primer was confirmed by duplicated PCRs with DNA from at least two frogs from each population sam-pled. Amplification patterns obtained from two independ-ent sets of PCR reactions using DNA from the Mambai population (n = 20) were scored twice by two different technicians to test the technical reproducibility and the reli-ability of the software Image Master 1D system for inter-preting and analyzing RAPD markers. Loci that did not reproduce were excluded from the analyses, as well as un-clear and undefined bands. The presence of a determined locus was confirmed by the Total Lab Master 1D software (Amersham Pharmacia Biotech, USA) by verifying the peaks of the bands produced during gel analyses. Loci with peaks smaller than 20 pixels, after two repetitions, were ex-cluded from the analyses (Figure 1). A binary matrix was constructed from the gel readings, where the samples from the individual frogs were genotypically characterized for the presence (1) or absence (0) of bands. The percentage of polymorphism obtained with each primer was calculated from this matrix.
Data analysis
The extent of genetic variation in each population was quantified by determining the mean number of alleles per locus and the proportion of polymorphic loci, using the TFPGA (Tools for population genetic analyses) v 1.3
soft-ware (Miller, 1997). Analysis of molecular variance (AMOVA) was performed on the RAPD haplotypes and the Euclidean distances between all pairs of haplotypes were calculated (Excoffieret al., 1992). The AMOVA was used to partition the total genetic variation into that occur-ring within and among population, expressed by theΦst statistic and tested by randomization using 1,000 permuta-tions. These analyses were performed with WINAMOVA software provided by L. Excoffier (University of Geneva).
TheΦst statistic was also estimated between pairs of local populations, providing an explicit estimate of genetic divergence among local populations to be further used for spatial analyses. Another direct estimate of Fstfrom domi-nant markers was obtained using the Bayesian approach proposed by Holsingeret al.(2002), which does not make explicit assumptions about inbreeding and Hardy-Wein-berg equilibrium in local populations. Ana posteriori dis-tribution of the θB estimator (an estimate of FST) was numerically approximated by a Markov Chain Monte Carlo (MCMC) simulation, and tended to converge to a beta dis-tribution. The HICKORY v 1.0 software (Holsinger and Lewis, 2003) allows the estimation of four different mod-els. The first is a full model, in which bothθBandf(similar to FIS, the inbreeding coefficient) are estimated. Alterna-tively, other two models can assumeθBorfequal to zero. Finally, because estimates offbased on dominant markers may often be strongly biased, especially for small sample sizes (n < 10), the HICKORY program allows the estima-tion of a final model in whichfis free to vary. The sampler will not attempt to estimatefand instead it will choose val-ues offat random from its prior distribution while estimat-ing other parameters durestimat-ing the MCMC run. These models were compared using the deviant information criterion
Figure 1- Random amplified polymorphic DNA marker analysis using the OPA13 primer and oneEupemphix nattererispecimen from Palmeiras municipality. The analysis was made using the Image Master 1D software (Amersham Pharmacia Biotech, USA). The amplicons varied from 1104 to 3274 bp and band intensity ranged from 20 to 90 pixels for eleven am-plified loci.
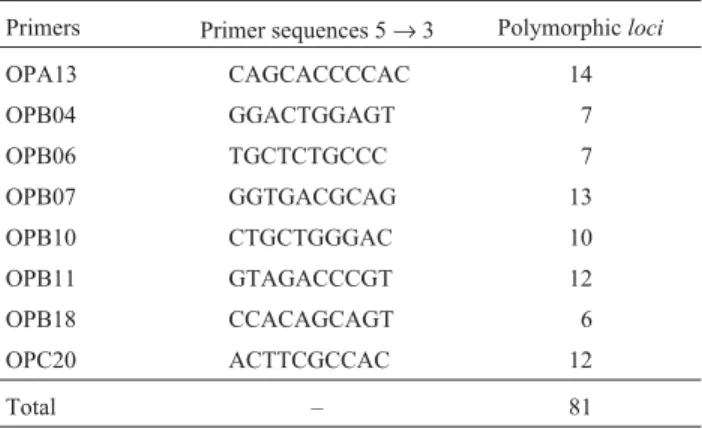
Table 2- Random amplified polymorphic DNA (RAPD) primers, primer sequences and the number of polymorphic loci used in the population study ofEupemphix nattererifrom Central Brazil.
Primers Primer sequences 5→3 Polymorphicloci
OPA13 CAGCACCCCAC 14
OPB04 GGACTGGAGT 7
OPB06 TGCTCTGCCC 7
OPB07 GGTGACGCAG 13 OPB10 CTGCTGGGAC 10 OPB11 GTAGACCCGT 12
OPB18 CCACAGCAGT 6
OPC20 ACTTCGCCAC 12
(DIC), with smaller DIC values indicating the best model. Estimates ofθBand other parameters obtained in this way incorporate all of the uncertainty in the priorfvalue (Hol-singer, 1999; Holsingeret al., 2002; Spiegelhalter et al., 2002; Holsinger and Wallace, 2004).
The genetic distances obtained by calculating pair-wiseΦst values between local samples were used to deter-mine population relationships using the unweighted pair group method with averages (UPGMA) (Sneath and Sokal, 1973). Cophenetic correlation using the NTSYS (Numeri-cal Taxonomy and Multivariate Analysis System) software (Rohlf, 1989) was used to verify agreement between the genetic matrix and the UPGMA dendrogram. A high corre-lation coefficient with a cophenetic correcorre-lation > 0.8 indi-cates a dendrogram that well reflects the original data but for values lower than 0.8 the clustering result for individual samples should be carefully checked.
Despite the fact that the UPGMA method is one of the methods most frequently used to represent multivariate ge-netic distances, some authors suggested that hierarchical structures do not always appear in genetic similarity since evolutionary processes tend to generate continuously clinal or reticulate patterns (Lessa 1990; Rodrigues and Diniz-Filho, 1998). In this case, ordination techniques, such as non-metric multidimensional scaling (NMDS), could also be useful for describing population divergence. Starting from the multidimensional genetic distances, the NMDS program uses iteration to produce the best possible repre-sentation of the relationship among populations in a space with a lower number of dimensions (in this paper, a two-dimensional (2-D) solution was used), by minimizing the stress (S) value, a measure of “badness-of-fitness”.
In order to determine whether genetic distances, based on pairwise Φst values, were correlated with geo-graphical distances Mantel tests were performed using the
NTSYS statistical package program (Manly, 1997; Rohlf, 1989). Matrix correlation was tested using 1,000 random permutations. To refine the Mantel statistics and detect short-distance spatial patterns, analyses were also perfor-med by comparing genetic distances with the binary model matrix (1/0) connecting sampling sites situated only at dis-tances of less than 50 km or 100 km, forming a spatial correlogram at small geographical distances.
Results
The eight primer sets amplified a total of 82 scorable RAPD fragments in 156 frogs from the 11 populations studied, with 81 (98.8%) of the 82 loci being polymorphic and only one locus being monomorphic. The variation in band size ranged from approximately 100 to 2000 bp and the number of RAPD fragments per primer varied from 06 to 14 considering all populations (Table 2). Primer set OPA13 produced the highest number of fragments among all the primers used, with an average of 14 loci (Figure 2). On the other hand, primer set OPB18 produced the lowest number of fragments with an average of 6 loci. All primers resulted in polymorphic banding patterns both between and within populations.
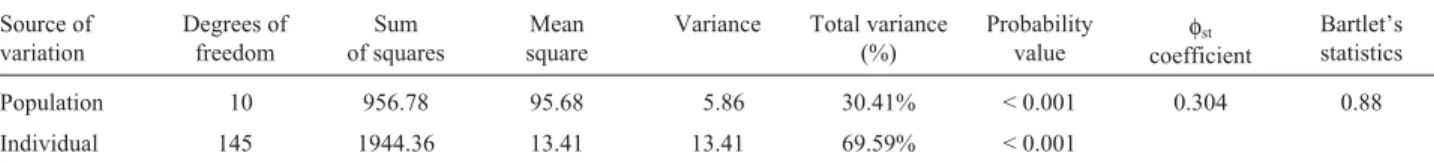
The AMOVA results indicated significant genetic differences (p < 0.001) betweenE. nattereripopulations (Table 3). The ΦST, analogous to FST (Excoffier et al., 1992), was equal to 0.3, indicating a large amount of inter-populational variation. Of the four models obtained using the Bayesian approach (Table 4), the model with the smaller DIC value (3303.4) was the full model, in which the
θBvalue was equal to 0.36. However, in this model, thef
value was high (f= 0.87), probably the result of an artifact due to the small sample sizes and high number of loci (Holsinger and Lewis, 2003). The freef-model was the sec-ond best one according to the DIC value (3350.1), with
θB = 0.34 and f = 0.51, but this free f model was only slightly better than thef= 0 model, in whichθBwas equal to 0.29 (DIC = 3357.2). The worst of all models was the one in whichθBwas equal to zero (DIC = 7255). So, the Bayesian approach supports results from AMOVA, suggesting a sig-nificant between-population component of genetic varia-tion of about 30%.
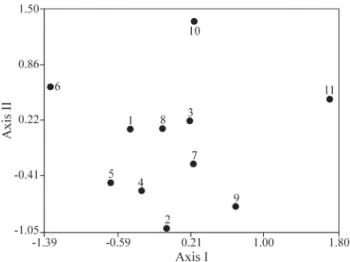
Pairwise Φst values ranged from 0.23 to 0.42 (Table 5) and its representation using the two multivariate procedures was not very satisfactory considering the rela-tively low UPGMA cophenetic correlation coefficient (Fig-ure 3) and the high NMDS stress value for a bi-dimensional solution (S= 0.36). However, increasing the NMDS stress value to a 3-D solution did not improve the stress, so a 2-D visualization was shown (Figure 4). The 2-D NMDS space did not reveal a clear correspondence with the spatial
distri-bution of local populations. Local populations 2 and 11 were in opposed genetic space, these populations being in the extreme positions along the northeast-southwest geo-graphical axis. On the other hand, populations such as 1 and 7, which were separated by larger distances, were close in genetic space. Some groups of populations close in geo-graphic space (such as 1 and 8; 3 and 7) were also close in genetic space.
Thus, no clear spatial structure was apparent either from the UPGMA or NMDS methods. Indeed, the Mantel
Table 3- Analysis of Molecular Variance (AMOVA) based on 82 random amplified polymorphic DNA (RAPD) loci for all populations ofEupemphix nattererifrom Central Brazil.
Source of variation
Degrees of freedom
Sum of squares
Mean square
Variance Total variance (%)
Probability value
φst
coefficient
Bartlet’s statistics Population 10 956.78 95.68 5.86 30.41% < 0.001 0.304 0.88 Individual 145 1944.36 13.41 13.41 69.59% < 0.001
Table 4- Bayesian analysis of population divergence for 11 local popula-tions ofEupemphix nattereriusing the HICKORY version 1.0 program in-cluding the tested models, the estimates of f andθBand the deviant
information criterion (DIC).
Model f θB DIC
full 0.8689 0.3579 3303.4324
f= 0 - 0.2886 3357.2500
θB= 0 0.8314 - 7255.7819 freef 0.5133 0.3411 3350.1127
Table 5- Matrix ofΦSTvalues for each pairwise combination of 11Eupemphix nattereripopulations based on 82 random amplified polymorphic DNA
(RAPD) loci.
Population 1 2 3 4 5 6 7 8 9 10 11
1 0
2 0.309 0
3 0.263 0.318 0
4 0.264 0.283 0.249 0
5 0.287 0.329 0.311 0.241 0
6 0.309 0.362 0.285 0.375 0.310 0
7 0.253 0.285 0.236 0.227 0.305 0.334 0
8 0.289 0.282 0.232 0.318 0.289 0.316 0.278 0
9 0.305 0.333 0.258 0.354 0.321 0.392 0.280 0.272 0
10 0.293 0.362 0.271 0.341 0.376 0.411 0.341 0.308 0.357 0
11 0.362 0.401 0.253 0.334 0.394 0.409 0.302 0.386 0.417 0.347 0
test showed no globally significant correlation between pairwiseΦst values and geographical distances (r = 0.03; p = 0.45) (Figure 5). Moreover, no spatial structure appeared when comparing genetic distances with short-distance con-nectivity matrices, situated at distances of less than 50 km (r = 0.05, p = 0.37) or 100 km (r = 0.02; p = 0.45).
Discussion
The RAPD markers indicated that there is a signifi-cant population structure ofE. nattereriin Goiás State, as found for many other species of anurans worldwide (Lampertetal., 2003; Paloet al., 2004; Smith and Green, 2004 Telles et al., 2006). Although both AMOVA and Bayesian analyses showed a significant interpopulational variance component of about 30%, the observed population differentiation was not structured in geographic space, as shown by the Mantel tests and NMDS analyses. According
to these results, for the relationship between genetic and geographic distances, patterns of population differentiation would approximate to Wright’s island model. In our case, allele frequencies in each population are allowed to drift in-dependently without relation to the geographic distances separating them. This pattern probably arises because natu-ral populations are of finite size and dispersal is usually constrained to some extent by geographic distance (see Hutchinson and Templeton, 1999). This is indeed to be ex-pected forE. nattereri, for which high levels of population differentiation could arise because this species reproduces only in the beginning of the rainy season, a fact that contrib-utes to the limited dispersion of individual frogs and high site fidelity.
Our data was in partial agreement with a recent RAPD marker study involving 18 populations of the barker frog Physalaemus cuvieri also sampled in Goiás State (Telles et al., 2006). In that study, only short-distances (> 100 km) structure was found, but not an overall signifi-cant correlation between genetic and geographical dis-tances. These results confirmed that amphibian populations tend to be relatively isolated from each other, due to re-duced gene flow and absence of migration, even at a fine scale, tending to generate and maintain high levels of ge-netic population structure (Roweet al., 1998; Lampertet al., 2003; Burnset al., 2004; Paloet al., 2004).
OurE. nattereriresults were very similar to those for the British marsh frog Rana ridibunda in the study con-ducted by Zeisset and Beebee (2003) using RAPD and microsatellite markers. These authors found that 24.7% of the total variance was between populations and 72.6% was within populations and theΦstcoefficient estimated signifi-cant genetic differentiation between most of the R. ridibundapopulations studied.A microsatellite marker po-pulation study was carried out onBufo calamita, sampled at distances between 0.5 and 9.0 km, by Roweet al.(2000) who found an averageΦstvalue of 0.11, lower than the value found by us for ourE. nattereristudy. However, other genetic structure studies have reported even higherΦst val-ues,e.g.theGeocrinia roseaallozymes study by Driscoll (1998), which reported aΦstof 0.6, and theBufo canorus single-strand conformation polymorphism study by Shaffer
et al. (2000), which found a Φst value of 0.2. All the reported studies using amphibians have indicated that eco-logical and behavioral factors can also create genetic struc-tures at local scales according to the species studied (Paloet al., 2004; Rissleretal., 2004; Rowe and Beebee, 2004). In fact, theΦstvalue found in our group is higher when com-pared to other groups, because our geographical range var-ied from 71 km to 916 km.
Thus, some amphibian species also presented high genetic structuring, even when populations sampled were less than 5 km apart (Roweet al., 2000; Lampertet al., 2003; Burnset al., 2004). Significant Fst andΦstvalues
Figure 4- Two-dimensional plot showing the relative position of the 11 localEupemphix nattereripopulations in pairwise genetic space (ΦST)
re-duced by non-metric multidimensional scaling (NMDS).
found in amphibian populations indicate that dispersal is low, even between pools in close proximity (Kraaijeveld-Smitet al., 2005) and, in our case, the genetic structuring of
E. natterericould be also explained by local extinction and recolonization by a few individual frogs from one or a few source populations. However, we can make no further com-ments on past fragmentation or other types of range fluctua-tions since we only sampled a small subset of the species range. Our results presented in this paper provided a pre-liminary indication of the population structure of E. nattereri, and while RAPD markers are insufficient to infer phylogeographic processes mitochondrial DNA analyses could be used to test these predictions.
Our results have revealed thatE. nattereripresented high levels of genetic differentiation. However, the genetic variation betweenE. nattereripopulations was randomly distributed in geographic space and, probably, gene flow was structured at spatial scales smaller than those between our samples. As mentioned above, in the absence of migra-tion-drift equilibrium mediated by geographic space, popu-lations are weakly connected and a large amount of random differentiation between populations is to be expected. In conclusion, this study has greatly improved our knowledge on the genetic diversity ofEupemphix nattereri. Sampling more sites and the use of different markers would be neces-sary to test for historical evolutionary forces that shape spe-cies population structure.
Acknowledgments
The authors thank Leôncio Pedrosa Lima, Lorena Dall’ara Guimarães and William Vaz Silva for their help in fieldwork. We also thank Sean Quail for support with the English. This study was undertaken under IBAMA permit 017/05 – RAN. This work was supported by several grants, including Conselho Nacional de Desenvolvimento Cientí-fico Tecnológico (CNPq, proc. N. 520804/99-6, 465137/ 00-8, and 474.189/03-1) and by PRONEX program of CNPq/SECTEC-GO (proc. 23234156). RPB and JAFD-F have been supported by CNPq under the researcher produc-tivity fellowships and by Fundação de Amparo à Pesquisa/ Universidade Federal de Goiás (FUNAPE/UFG). DMS, ADC and MPCT have been continuously supported by grants from the Pró-Reitoria de Pós-Graduação e Pesquisa (PROPE)/Universidade Católica de Goiás.
References
Almeida FS, Sodré LMK and Contel EPB (2003) Population structure analysis of Pimelodus maculatus (Pisces, Silu-riformes) from the Tietê and Paranapanema Rivers (Brazil). Genet Mol Biol 26:301-305.
Alford RA and Richards SJ (1999) Global amphibian declines: A problem is applied ecology. Annu Rev Ecol Syst 30:133-165.
Avise JC (1994) Molecular Markers, Natural History and Evolu-tion. Chapman and Hall, New York, 669 pp.
Beebee TJ (2005) Conservation genetics of amphibians. Heredity 95:423-427.
Blaustein AR, Wake DB, and Sousa WP (1994) Amphibian de-clines: Judging stability, persistence, and susceptibility of populations to local and global extinctions. Conserv Biol 8:60-71.
Burns EL, Eldrigde MDB and Houlden BA (2004) Microsatellite variation and population structure in a declining Australian hylidLitoria aurea. Mol Ecol 13:1745-1757.
Buso GSC, Rangel PH and Ferreira ME (1998) Analysis of ge-netic variability of South American wild rice populations (Oryza glumaepatula) with isozymes and RAPD markers. Mol Ecol 7:107-117.
Driscoll DA (1998) Genetic structure of the frogsGeocrinia lutea andGeocrinia roseareflects extreme population divergence and range changes, not dispersal barriers. Evolution 52:1147-1157.
Excoffier L, Smouse PE and Quattro JM (1992) Analysis of mo-lecular variance inferred from metric distances among DNA haplotypes: Application to human mitochondrial DNA re-striction data. Genetics 131:479-491.
Hadrys H, Balik M and Schierwater B (1992) Application of ran-dom amplified polymorphic DNA (RAPD) in molecular ecology. Mol Ecol 1:55-63.
Hardy OJ (2003) Estimation of pairwise relatedness between indi-viduals and characterization of isolation-by-distance pro-cesses using dominant genetic markers. Mol Ecol 12:1577-1588.
Holsinger KE (1999) Analysis of genetic diversity in geographi-cally structured populations: A Bayesian perspective. Here-ditas 130:245-255.
Holsinger KE, Lewis PO and Dey DK (2002) A Bayesian method for analysis of genetic population structure with dominant marker data. Mol Ecol 11:1157-1164.
Holsinger KE and Lewis PO (2003) HICKORY: v 1.0. A Package for Analysis of Population Genetic Data, 1.0 edn. Storrs. De-partment of Ecology and Evolutionary Biology, The Univer-sity of Connecticut. http://www/eeb.uconn.edu/.
Holsinger KE and Wallace LE (2004) Bayesian approaches for the analysis of population genetic structure: An example from Platanthera leucophae (Orchidaceae). Mol Ecol 13:887-894.
Hutchison DW and Templeton AR (1999) Correlation of pairwise genetic and geographic distance measures: Inferring the rel-ative influences of gene flow and drift on the distribution of genetic variability. Evolution 53:1898-1914.
Kraaijeveld-Smit FJL, Beebee TJC, Griffiths RA, Moore RD and Schley L (2005) Low gene flow but high genetic diversity in the threatened Mallorcan midwife toad Alytes muletensis. Mol Ecol 14:3307-3315.
Lampert KP, Rand AS, Mueller UG and Ryan MJ (2003) Fine-scale genetic pattern and evidence for sex-biased dispersal in the tungara-frog, Physalaemus pustulosus. Mol Ecol 12:3325-3334.
Lessa E (1990) Multidimensional analysis of geographic genetic structure. Syst Zool 39:242-252.
Manly BFJ (1997) Randomization, Bootstrap and Monte Carlo Methods in Biology. Chapman and Hall, London, 399 pp. McDiarmid RW and Altig R (1999) Tadpoles: The Biology of
Miller MP (1997) Tools for Population Genetic Analyses (TFPGA), version 1.3: A Windows Program for the Analy-sis of Allozyme and Molecular Population Genetic Data. Flagstaff, University of Northern Arizona. http://herb.bio. nau.edu/_miller/tfpga.htm.
Mueller UG and LL Wolfenbarger (1999) AFLP genotyping and fingerprinting. Trends Ecol Evol 14:389-394.
Myers N, Mittermeier RA, Mittermeier CG, Fonseca GAB and Kent J (2000) Biodiversity hotspots for conservation priori-ties. Nature 403:853-858.
Nascimento LB, Caramaschi U and Cruz CAG (2005) Taxonomic review of the species groups of the genus Physalaemus Fitzinger, 1826. Arq Mus Nac 63:297-320.
Newmann RA (1992) Adaptative plasticity in amphibian meta-morphosis. Bioscience 42:671-678.
Newman RA and Squire T (2001) Microsatellite variation and fine-scale population structure in the wood frog (Rana sylvatica). Mol Ecol 10:1087-1100.
Palo JU, Schmeller DS, Laurila A, Primmer CR, Kuzmin SL and Merila J (2004) High degree of population subdivision in a widespread amphibian. Mol Ecol 13:2631-2644.
Rissler LJ, Wilbur HM and Taylor DR (2004) The influence of ecology and genetics on behavioral variation in salamander populations across the Eastern Continental Divide. Am Nat 164:201-213.
Rodrigues FM and Diniz-Filho JAF (1998) Hierarchical structure of genetic distances: Effects of matrix size, spatial distribu-tion and correladistribu-tion structure among gene frequencies. Ge-net Mol Biol 21:233-240.
Rohlf FJ (1989) NTSYS-pc: Numerical Taxonomy and Multi-variate Analysis System (Manual). Exeter Publishers, New York.
Rowe G and Beebee TJC (2004) Reconciling genetic and demo-graphic estimators of effective population size in the anuran amphibianBufo calamita. Conserv Genetics 5:287-298. Rowe G, Beebee TJC and Burke T (1998) Phylogeography of the
natterjack toadBufo calamitain Britain: Genetic differentia-tion of native and translocated populadifferentia-tions. Mol Ecol 7:751-760.
Rowe G, Beebee TJC and Burke T (2000) A microsatellite analy-sis of natterjack toad, Bufo calamita, metapopulations. Oikos 88:641-651.
Shaffer HB, Fellers GM, Magee A and Voss SR (2000) The genet-ics of amphibian declines: Population substructure and mo-lecular differentiation in the Yosemite toad,Bufo canourus (Anura, Bufonidae) based on single strand conformation polymorphism analysis (SSCP) and mitochondrial DNA se-quence data. Mol Ecol 9:245-257.
Smith MA and Green DM (2004) Phylogeography ofBufo fowleri at its northern range limit. Mol Ecol 13:3723-3733. Sneath PHA and Sokal RP (1973) Numerical Taxonomy. WH
Freeman and Company, San Francisco, 573 pp.
Spear SF, Peterson CR, Matocq MD and Storfer A (2005) Land-scape genetics of the blotched tiger salamander (Ambystoma tigrinum melanostictum). Mol Ecol 14:2553-2564. Spiegelhalter DJ, Best NG, Carlin BP and Linde VD (2002)
Bayesian measures of model complexity. J R Stat Soc [Se-ries B] 64:483-689.
Telles MPC, Bastos RP, Soares TN, Resende LV and Diniz-Filho JAF (2006) RAPD variation and population genetic struc-ture of Barker frog Physalaemus cuvieri (Anura, Lepto-dactylidae) in Central Brazil. Genetica 128:323-332. Welsh J and McClelland M (1990) Fingerprinting genomes using
PCR with arbitrary primers. Nucleic Acid Res 18:7213-7218.
Wilbur HM (1997) Experimental ecology of food webs: Complex systems in temporary ponds. Ecology 78:2279-2302. Wilson AJ, Hutchings JA and Ferguson MM (2004) Dispersal in a
stream dwelling salmonid: Inferences from tagging and microsatellite studies. Conserv Genetics 5:25-37.
Wu X-B, Wang Y-Q, Zhou K-Y, Zhu W-Q, Nie J-S, Wang C-L and Xie W-S (2002) Genetic variation in captive population of chinese alligator,Alligator sinensis, revealed by random amplified polymorphic DNA (RAPD). Biol Conserv 106:435-441.
Young B, Lips KR, Reaser JK, Ibáñez R, Salas AW, Credeño JR, Coloma LA, Ron S, Marca Ela, Meyer JR,et al.(2001) Pop-ulation declines and priorities for Amphibian conservation in Latin America. Conserv Biol 15:1213-1223.
Zeisset I and Beebee TJC (2003) Population genetics of a success-ful invader: The marsh frogRana ridibundain Britain. Mol Ecol 12:639-646.
Zhang D-X and Hewitt GG (2003) Nuclear DNA analyses in ge-netic studies of populations: Practice, problems and pros-pects. Mol Ecol 12:563-584.
Internet Resources
Frost (2007) Amphibian Species of the World: An Online Refer-ence. Version 4 (30 October 2006). Electronic. American Museum of Na tural History, New York. Available in: http:// research.amnh.org/herpetology/amphibia/index.php. Funk WC, Greene AE, Corn PS and Allendorf FW (2005) High
dispersal in a frog species suggests that it is vulnerable to habitat fragmentation. Biol Let 1-4. Available in: http:// www.royalsoc.ac.uk.