Morphometric and genetic
differentiation among populations of
Eupemphix nattereri
(Amphibia, Anura, Leiuperidae)
from central Brazil
Daniela de M. e Silva
1, 2, Aparecido D. da Cruz
1, Rogério P. Bastos
3, Mariana P. de C. Telles
3& José Alexandre F. Diniz-Filho
2, 31. Núcleo de Pesquisas Replicon, Departamento de Biologia, Universidade Católica de Goiás, Avenida Universitária, 1440, 74605-010 Goiânia, Goiás, Brazil. ([email protected])
2. Programa de Pós-Graduação em Biologia Animal, Universidade de Brasília, Brasília-DF, Brazil.
3. Departamento de Biologia Geral, Instituto de Ciências Biológicas, Universidade Federal de Goiás, Goiânia, Goiás, Brazil.
ABSTRACT. To assess genetic structure and phenotypic diversity of Eupemphix nattereri Steindachner, 1863, morphometric and molecular analyses were carried out for nine populations from the State of Goiás. A total of 11 morphometric traits were evaluated and genetic information was estimated using RAPD markers. Genetic and phenotypic distances were determined as a function of geographical origin. Correlation among genetic, morphometric, micro, and macroenviromental were analyzed by the Mantel test. Genetic data indicated high levels of genetic diversity ( st= 0.3) among the nine populations. Mantel tests did not reveal a significant positive
correlation between genetic and geographical distances, indicating that locally geographical populations were not genetically similar, even in distances smaller than 50 km. Discriminant analysis on 11 morphometric measurements showed a high divergence among the nine populations. However, a marginally significant correlation (P=0.08) between genetic and morphometric distances was found. The observed correlation was not causal in terms of the relationship between phenotype and genotype, but indicated common spatial structures. Thus, our results suggest that isolation-by-distance processes may explain population divergence in Eupemphix nattereri.
KEYWORDS. Eupemphix nattereri, morphology, RAPD markers, gene flow, population structure.
RESUMO.Diferenciação genética e morfométrica em populações de Eupemphix nattereri (Amphibia, Anura, Leiuperidae) do Brasil Central. Visando conhecer a estrutura genética e a diversidade fenotípica da espécie Eupemphix nattereri Steindachner, 1863, análises morfométricas e moleculares foram realizadas em nove populações do Estado de Goiás. Onze caracteres morfométricos foram avaliados e a diversidade genética foi estimada com o uso de marcadores RAPD. As matrizes de distâncias genéticas e fenotípicas foram correlacionadas com as distâncias geográficas e dados macro e microambientais, utilizando o teste de Mantel. Em relação aos caracteres genéticos, foram encontrados altos níveis de diversidade ( st= 0,3) entre as nove populações. Não houve, entretanto, uma correlação
positiva significativa entre as distâncias genéticas e geográficas, indicando que populações geograficamente próximas não seriam geneticamente similares, mesmo estando situadas entre distâncias menores do que 50 km. Uma análise discriminante dos onze caracteres morfométricos evidenciou também uma elevada divergência entre as nove populações. Entretanto, foi encontrada uma correlação quase significativa (P=0,008) entre as distâncias genéticas e morfométricas. A correlação observada não foi casual entre fenótipo e genótipo, mas indicou estruturas espaciais comuns. Desta forma, nossos resultados sugerem que processos de isolamento por distância poderiam explicar a divergência populacional na espécie Eupemphix nattereri.
PALAVRAS-CHAVE.Eupemphix nattereri, morfologia, marcadores RAPD, fluxo gênico, estrutura populacional.
At present there are approximately 6,300 species of
anuran amphibians over the world (IUCN, 2004), and the
largest diversity is found in the Neotropics (D
UELLMAN,
1988). Brazil represents one of the most diverse countries,
with 747 species (SBH, 2005). In State of Goiás, more
than 70 anuran species are known to occur, corresponding
to 9.4% of Brazil’s anuran diversity. However, the anuran
fauna remains largely unknown in the central areas of
Brazil (B
RANDÃO& A
RAÚJO, 1998).
Despite the high levels of species diversity, little is
known about the population structure of amphibians in
South America, due to the scarcity of data referring to
the dynamics of the group (M
YERSet al
., 2000; Y
OUNGet
al
., 2001). Many studies on population genetic structure
of amphibians sustain the idea that among vertebrates,
amphibians exhibit relatively low vagility and are highly
philopatric (B
LAUSTEINet al
., 1994; S
EPPÃ& L
AURILA, 1999;
S
HAFFERet al
., 2000; L
AMPERTet al
., 2003), allowing the
accumulation of genetic and morphological differences
among populations (B
LOUIN& B
ROWN, 2000; C
AMPet al
.,
2000; M
ÉNDEZet al
., 2004). Consequently, amphibians
have recently become a focus in studies trying to
understand ecological and evolutionary processes
(Z
EISSET& B
EEBEE, 2003; E
TEROVICKet al
., 2005; F
UNKet
al
., 2005).
The family Leiuperidae comprises 7 genera, and 48
species, occurring all over the Neotropical region and
including species that have terrestrial, fossorials, arboreal,
and aquatic habits (F
ROSTet al
., 2006).
The genus
Eupemphix
(Leiuperidae) was
described by Steindachner (1863) to include the species
Eupemphix nattereri
, whose type locality is Cuiabá, Mato
Grosso, Brazil (N
ASCIMENTOet al
., 2005).
Eupemphix
nattereri
is a frog largely distributed in South America,
ranging from the east of Paraguay to central and southeast
Brazil (C
EI, 1980; F
ROST, 2004). At the beginning of the
(B
RASILEIROet al
., 2005). The breeding season can extend
for many months, characterizing the reproductive pattern
as explosive (W
ELLS, 1977).
Analyses of intraspecific geographical variability
in morphology have often revealed extensive variation
in body size among amphibians (B
ABIK& R
AFINSKI, 2000;
C
ASTELLANOet al
., 2000; S
CHÄUBLE, 2004). Body size is a
fundamental morphological trait, important in a
physiological, ecological, and behavioral context of a
species (S
CHÄUBLE, 2004). However, causes and
maintenance of geographical variation in morphology are
likely to be complex and not always well understood
(M
ALHOTRA& T
HORPE, 1997).
Studies based on molecular markers, such as RAPD
(Random Amplified Polymorphic DNA) have contributed
in a complementary manner to the understanding of
amphibian population genetics all over the world
(R
AFINSKI& B
ABIK, 2000; T
RAKIMASet al
., 2003; Z
EISSET&
B
EEBEE, 2003). RAPD are based on randomic
amplifications of DNA fragments by small primer
sequences of approximately 8 to 10 base pairs (R
ABOUAMet al
., 1999). Dominant markers such as RAPD can be
easily developed, even for species without prior genetic
information at low costs (M
UELLER& W
OLFENBARGER,
1999). Consequently, RAPD markers represent molecular
tools that help answer questions about variations among
individuals and populations (V
ONE
GGELING&
S
PIELVOGEL, 1995; C
USHWA& M
EDRANO, 1996; H
ASSANIENet al
., 2004).
The current paper reports on the association among
morphometric, genetic, macroenvironmental, and
microenvironmental data of nine populations of
Eupemphix nattereri
, from the State of Goiás. Our
hypothesis is that it is possible to infer the population
structure of
Eupemphix nattereri
by investigating the
levels of similarity and genetic diversity between and
among populations of this anuran. Thus, it was
determined the extent of genetic differentiation of
Eupemhix nattereri
in Central Brazil using RAPD markers
and, it was also evaluated the potential correlations among
morphological variation, abiotic factors, and genetic
differentiation.
MATERIALS AND METHODS
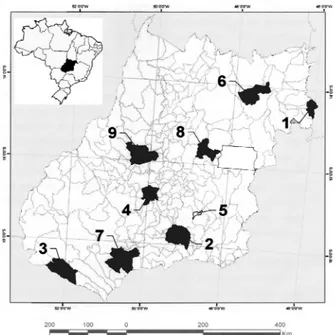
Study Area. All nine study areas were located in
State of Goiás, central Brazil, between parallels 14
oN and
19
oS and the meridians 52.5
oW and 40
oE, occupying an
area of 281,250 Km
2. The vegetation of these areas is
composed by different physiognomies of the Cerrado
biome, forming savanna-like vegetation in the
well-drained interfluves, and gallery forests along streams and
rivers (R
ATTERet al
., 1998).
A total of 132 specimens of
E. nattereri
were
collected at the nine municipalities (Fig.1), during the
rainy season of 2002-2004, between October and March.
Sampling localities, sample sizes, coordinates, micro
environmental characteristics of each municipality are
listed in Table I. Voucher individuals were deposited in
the Zoological Collection of the Universidade Federal de
Goiás (ZUFG).
Morphometric analysis.
Eleven external body
measurements were taken from each of the 132 adult
specimens of
E. nattereri
. All the measurements are
expressed in millimeters. Measured specimens were fixed
in 10% formalin and maintained in 70% ethyl alcohol. For
measurements we used an ocular micrometer in a
stereomicroscope and calipers to the nearest 0.05 mm.
Raw morphometric data were log-transformed to perform
a parametric statistical analysis. The descriptions of each
measurement are listed in Table II.
Molecular data.
Genomic DNA was purified from
20mg of frozen liver with DNA purification Kit, according
to manufacture’s procedures. Amplification reactions were
performed in a final solution of 20µl with 2.5 ng of genomic
DNA, 10X reaction buffer, 2mM of MgCl
2, 0.26 mM of
each dNTP, 10 ng of a single primer (Operon Technologies),
0.5 U of Taq DNA-polymerase and double distiled H
2O.
The cycling amplification parameters were: initial
denaturation at 96ºC for 3 min, followed by 40 cycles of
denaturation for 1 min at 92ºC, annealing for 1 min at 35º C
and elongation for 1 min at 72ºC. Ten microliters of each
reaction product were loaded in a horizontal 1.5% agarose
gel and electrophoresed at 5V/cm. The images obtained
by each gel were captured using a video-documentation
system and analyzed with Image Master 1D software (Total
Lab, Amersham Pharmacia Biotech, USA).
A total of 40 primers were tested to select those
with the best amplification pattern. The presence of a
determined locus
was confirmed by the software Master
1 D (Total Lab, Amersham Pharmacia Biotech, USA) by
verifying the peaks of the bands during gel analyses. Loci
with peaks smaller than 20 pixels, after two repetitions,
were excluded from the analyses (Fig. 2).
After this initial evaluation, eigth primers
(Tab. III)
were used in the analysis of DNA polymorphism between
and among populations. The eigth RAPD primers
produced a total of 82 distinct, reproducible bands that
Fig. 1. Map of the State of Goiás, showing the nine sample sites of
Base Pairs
Pixel
Intensity
comprised the complete data set. A binary matrix was
constructed from the gel readings, where the individuals
were genotypically characterized for presence (1) and
absence (0) of bands.
Statistical analysis.
To determine the degree of
morphological differentiation between and among
populations, and to identify which biometric parameter
most contributed for the variation in morphology,
analyses of variance (ANOVA) were performed.
Components of variance of ANOVA model II permitted
the estabilishment of the variation between and among
local populations, for each trait. Patterns of morphometric
Table I. Geographical and environmental data for the sampling sites of Eupemphix nattereri Steindachner, 1863 populations in CentralBrazil (1, Mambaí; 2, Morrinhos; 3, Aporé; 4, Palmeiras de Goiás; 5, Cristianópolis; 6, Alto Paraíso; 7, Quirinópolis; 8, Cocalzinho de Goiás; 9, Goiás).
Municipalities N Latitude Longitude Air temperature (oC) Humidity (%) Elevation(m)
1 2 0 14º29’16’’ 46º06’47’’ 3 2 5 1 709
2 2 4 17º43’54’’ 49º06’03’’ 2 4 8 0 771
3 1 3 18º57’55’’ 51º55’35’’ 2 5 6 0 538
4 1 0 16º48’18’’ 49º55’33’’ 2 8 8 4 596
5 1 3 17º11’96’’ 48º42’14’’ 2 0 7 0 802
6 2 1 14º07’57’’ 47º30’36’’ 2 5 6 7 1186
7 1 3 18º26’54’’ 50º27’06’’ 2 7 6 3 541
8 1 2 15º47’40’’ 48º46’33’’ 2 5 8 5 1152
9 0 8 15º56’04’’ 50º08’’25’’ 2 4 7 3 802
Table II. Standardized morphometric measurements carried out on specimens of Eupemphix nattereri from central Brazil.
Measurement Abbreviation Description
Snout-vent length SVL From tip of snout to posterior margin of vent
Femur length FL Cloacae to Knee
Head Wide H W Measured between mean edges of head
Anterior interorbital distance AID Distance between anterior edges of eyes
Eye-nostril distance END Distance between anterior edge of eye and posterior edge of nostrils Snout-nostril distance SND Distance between anterior egde of snout and posterior edge of nostrils
Foot length F Tip of longest toe to back of heel
Tibia length T L Knee to heel
Head length HL Distance between anterior and posterior edge of head
Interorbital distance IO Shortest distance between eye sockets
Tympanum diameter T D Maximum distance between rims of tympanum
Fig. 2. Results of the RAPD marker analysis for the primer OPA13, obtained from one individual of Eupemphix nattereri Steindachner,
1863 from Palmeiras municipality, central Brazil, using the software Image Master 1D (Amersham Pharmacia Biotech, USA). The amplicons varied from 1.104 to 3.274 bp and band intensity ranged from 25 to 90 pixels for eleven amplified loci. Peak cut off < 20
pixels (1, locus of 3274 bp; 2, locus of 3041 bp; 3, locus of 2598 bp; 4, locus of 2391 bp; 5, locus of 2159 bp; 6, locus of 2023 bp; 7,
discrimination were examined by canonical analysis or
multiple discriminant analysis (N
EFF& M
ARCUS, 1980).
The eleven morphometric characteristics were
log-transformed, the eigenvalues and eigenvectors were
obtained by the product of the variance-covariance matrix
between and among populations (N
EFF& M
ARCUS, 1980).
The Mahalanobis distance squared (MDS) obtained by
the canonical scores, was used to visualize the pattern of
morphometric differentiation among the nine populations.
All analyses were performed using the software SYSTAT/
SYSGRAPH (B
ROWNE& M
ELS, 2000).
Analysis of molecular variance (AMOVA) of the
genetic matrix was obtained by Euclidean distances
between all pairs of haplotypes (E
XCOFFIERet al
., 1992).
AMOVA was performed by partitioning the total variation
among and within population, using that Euclidean
distances. Total variation was expressed by the
stcoefficient and the significance was tested using 1,000
permutations. All statistical analyses were performed with
WINAMOVA software, from L. Excoffier (University of
Geneva). Genetic similarity dendograms among the nine
populations were constructed by using the
stcoefficients
and the UPGMA grouping method (S
NEATH& S
OKAL,
1973). The significance of the dendogram was tested by
a cophenetic correlation with 5,000 permutations, using
the software NTSYS 1.5 (R
OHLF, 1989).
Mantel test (M
ANLY, 1997) using NTSYS 1.5
(R
OHLF, 1989) was used to determine the significance
of correlations using matrices of pairwise distances
between populations, with 1,000 randomizations.
Microenvironmental variables used in the analyses
included: relative air temperature, air humidity, and
altitude. Macroenvironmental data were obtained from
the Atlas of Biosphere (S
ET, 2002), using a grid formate
of
ArcView
archive. All cells from the grid contained
the coordinates for each municipality.
The following distance matrices were used in these
analyses: (a) the morphological matrix of morphometric
distances (Mahalanobis distances) among populations;
(b) the genetic matrix obtained by AMOVA; (c) the
geographical distance matrix; (d) the matrix of Euclidean
distances among populations, using standardized
macroenviromental data (media=0 and variance=1); and
(e) the matrix of microenviromental data.
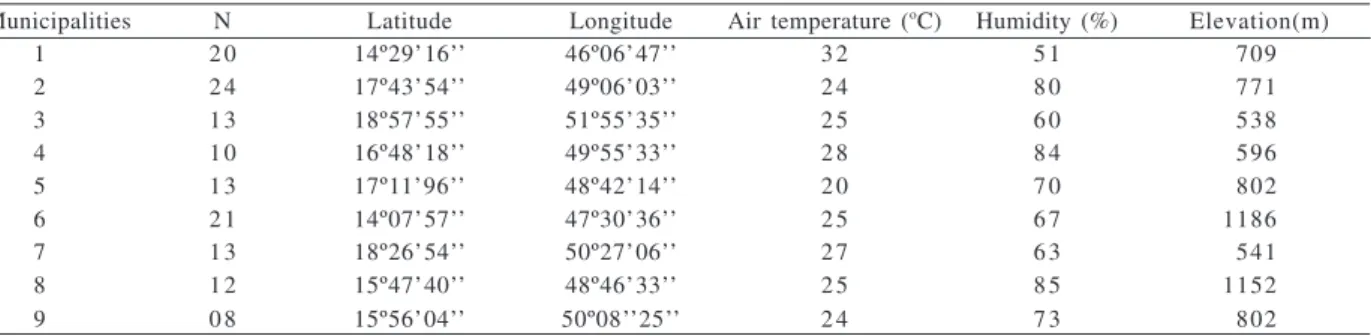
Fig. 3. Results of Canonical Variable Analysis, showing the relative position of each population of Eupemphix nattereri Steindachner, 1863. Numbers 1 to 9 refer to the populations listed on table I.
RESULTS
ANOVA detected differences among populations
(Tab. IV) related to the 11 morphometric characteristics.
Canonical Variates Analysis confirmed the significant
difference among populations (
λ
de Wilks= 0.17; P= 0).
The first canonical variable (VC1) detected differences
among the nine populations mainly for SVL, HW and HL.
The second canonical variables (CV2) which indicate limb
measurements, such as FL, F and TL, exhibited positive
correlations, demonstrating morphometric variation
among anuran populations (Tab. V). The scores of the
two canonical variables for each population are shown
in Fig. 3.
The size of the amplicons varied from 100 to 2,000
base pairs. The number of RAPD fragments by primer
varied from 6 to 14 (Tab. III). AMOVA indicated a variation
of 70% between populations and 30% among populations
(Tab.VI). The
stcoefficient indicated a significant
difference among populations, suggesting low gene flow
among individuals and high fidelity to the breeding site.
UPGMA showed genetic distances among the nine
populations (Fig. 4) and the cophenetic correlation
coefficient was r=0.80.
Macroenviromental data had mean pluviometric
indexes of 91.9 (SD=+6.8), annual temperatures of 23
oC
(SD= +0.7), and relative air humidity of 68.5%
Table III. Selected primers, primers sequences, and the number of polymorphic loci used in the population study of Eupemphix nattereri Steindachner, 1863 from central Brazil.
Primers Primers sequences 5´→3´ Polymorphic loci
OPA13 CAGCACCCCAC 1 4
OPB04 GGACTGGAGT 7
OPB06 TGCTCTGCCC 7
OPB07 GGTGACGCAG 1 3
OPB10 CTGCTGGGAC 1 0
OPB11 GTAGACCCGT 1 2
OPB18 CCACAGCAGT 6
OPC20 ACTTCGCCAC 1 2
Total 8 1
Table IV. Results of Analysis of Variance (ANOVA) for 11 morphometric traits of Eupemphix nattereri Steindachner, 1863,
including variance components among populations (V%) and the levels of significance at 95% and 99% (*, P<0.05; **, P<0.01; ***, NS=non significant).
Morphometric variables F V(%)
SVL 8.7** 35.8
H W 6.8** 30.2
FL 4.1** 20.9
F 5.0** 24.1
T L 3.0** 16.3
IO 2.9** 15.7
T D 3.4** 7.9
SND 4.0** 20.4
END 2.0* 11.4
HL 4.7** 23.2
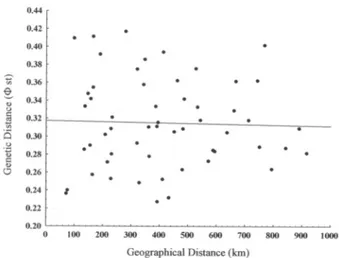
significant statistical correlation (r=0.75; P=0.001)
between geographical and macroenvironmental
matrixes (pluviometric indexes, mean temperature, and
air humidity). A marginally positive correlation (P=0.08)
was found between morphometric and genetic variation
(Fig. 6), which could be explained by evolutionary
forces, selecting the genetic make up responsible for
morphological traits in
E. nattereri
. No correlation was
observed between morphometric variation and
Fig. 5. Resume of Mantel test performed among geographical (GEO), genetic (GENET), morphometrical (MORPH), microenvironmental (MICRO) and macroenvironmental (MACRO) data.
Fig. 4. Dendogram of genetic distance among nine populations of
Eupemphix nattereri Steindachner, 1863, defined by UPGMA
clustering method, based on genetic divergence ( st).
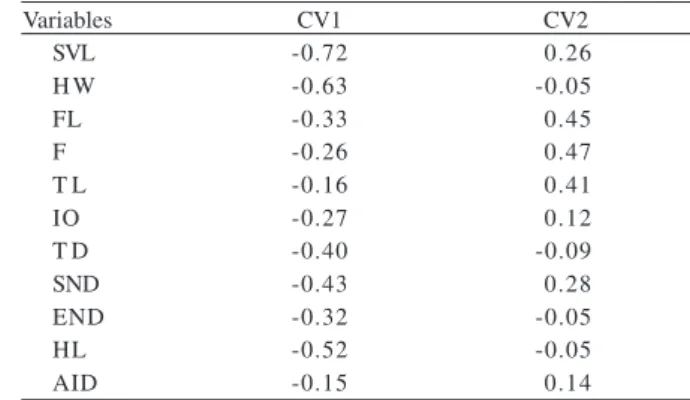
Table V. Canonical coefficientes of original morphometric traits of Eupemphix nattereri Steindachner, 1863 logarithmized at the first two axes.
Variables CV1 CV2
SVL -0.72 0.26
H W -0.63 -0.05
FL -0.33 0.45
F -0.26 0.47
T L -0.16 0.41
IO -0.27 0.12
T D -0.40 -0.09
SND -0.43 0.28
END -0.32 -0.05
HL -0.52 -0.05
AID -0.15 0.14
Table VI. Analysis of Molecular Variance (AMOVA) based on 82 polymorphic RAPD loci for nine populations of Eupemphix nattereri
Steindachner, 1863 from Central Brazil (DF, degree of freedom).
Source of DF Sum of squares Mean Square Variance Total P st coefficient Bartlet´s
variation variance (%) statistics
Population 8 777.1 97.1 5.8 29.9% <0.001 0.29 0.8
Individual 123 1665.9 13.5 13.5 70.1%
(SD=+2.0). Mean Air temperatures, humidity, and
altitude were 25.5
oC (SD=+3.3), 70% (SD=+11), and 789 m
(SD=+239), respectively.
microenviromental data. Although significant correlations
were not obtained between morphometric distance and
macroenviromental data, all nine populations of
E.
nattereri
reported here did not present a spatial pattern
with respect to genetic and geographical distances.
DISCUSSION
Body size and head length were the two variables
that mostly contributed for significant differences related
to morphometric traits, as observed for other groups
(C
ASTELLANO& G
IACOMA, 1998; C
ASTELLANOet al
., 1999;
B
ABIK& R
AFINSKI, 2000; C
ASTELLANOet al.,
2000; M
ÉNDEZet al
., 2004, R
OSSOet al
., 2004). According to our results,
the variation in morphological traits did not present a
spatial pattern, showing a substantial overlap in overall
morhometric variables of the studied populations.
In a study performed with 22 populations of
Physalaemus cuvieri
Fitzinger, 1826 also from the
Cerrado, showed that individuals located in dryer sites
in the north of State of Goiás had larger sizes (Juliano
& Bastos, unpublished data). However, the difference
in body size along a latitudinal gradient of humidity
could happen because animals from wet climates
reproduce earlier than populations in dryer climates;
thus, size is only a consequence of climate-driven
reproductive activity (C
ASTELLANOet al
., 2000). Other
component that may influence morphological variation
in amphibians is the specific vegetation at each area.
Most morphological traits correlates with one another,
either body shape or body size varies according to
their habitat (R
OSSOet al
., 2004). In our study, all
populations of
E. nattereri
were sampled in areas of
Cerrado. It is known that this vegetation is a mosaic,
and even in the closest areas there is a wide variation
in the kind of vegetation throughout Cerrado
ecossystems (B
RASILEIROet al
., 2005).
In anuran amphibians, adult body sizes depend on
many factors including time of metamorphosis, growth
rate before and after maturity, age of maturity, and
longevity (R
OSSOet al
., 2004). Moreover, genetic and
environmental differences can cause diversity in
ontogenetic development, resulting in body size variation.
Thus, besides ecological factors, genetic, physiological
and ontogenetic factors may also explain the wide range
of trait variations found in
E. nattereri
. Our data suggest
that ecological and genetic factors act in synergism to
increase specimen’s variation. Because of the complex
patterns of morphometric traits, the environmental
variables used in this study could not account for the
intricate steps beyond the evolutionary mechanisms of
Cerrado’s anurans. Consequently, the correlation
observed between phenotypic and environmental
matrixes of distances was only marginal.
It must be consider that other factor in local scales,
not analyzed in this study, such as pond temperatures
and pH, during the development of tadpoles could
influence morphometric traits, as described to
Rana
arvalis
(R
ÄSÄNENet al
., 2003). The water has a potential
effect on morphology and larval development and,
therefore, is a relevant factor affecting body size in
ectotherms (Atkinson, 1996).
With respect to the genetic differentiation, high
level of diversity was found (
st=0.3) among the studied
populations. There was not a statistically significant
correlation between genetic and geographical distances,
indicating that sites geographically close were not
genetically similar. Many studies of intraspecific genetic
variation in anurans have been conducted along extended
scales, of many kilometers, and their results show a
substantial variation among populations (L
AMPERTet al.
,
2003; T
RAKIMASet al
., 2003; Z
EISSET& B
EEBEE, 2003; P
ALOet al
., 2004; T
ELLES, 2005). Thus, our data pointed out a
strong evidence to support the previous statement even
for places situated as close as 50 km.
According to N
EWMAN& S
QUIRE(2001), there are
explanations, other than just limited gene flow, both
genetic and evolutive for local differentiation in neutral
markers. At fine spatial and temporal scales, where
mutation is less likely to be an important factor,
population genetic structure depends on the relative rates
of gene flow and dynamics of population size, which
determine the rate of genetic drift and turnover of local
populations. Even when there is some exchange of
individuals among populations, if effective population
size is small, fine-scale differentiation may result from
high rates of drift and that may be the case for the
populations used in this study.
Therefore, a statistical significant correlation,
between morphometric and genetic data in the populations
of
Eupemphix nattereri
indicates that the divergence
among populations of this species must follow the model
of isolation by distance, and even morphometric and
genetic variations could be influenced by a spatial
structure, although in a fine scale. The results of the
current study showed no sufficient evidence to provide
no more than a tentative explanation for the spatial
structure of
E. nattereri
population in central Brazil.
However, as genetic variation is probably neutral and
therefore could not be associated to morphometric
variation, the trends for a positive correlation could only
be explained by isolation by distance.
In conclusion, the results of the current study
indicated limited gene flow among the populations of
Fig. 6. Graphical representation of Mantel test between geographicaland genetic distances for Eupemphix nattereri Steindachner, 1863
Eupemphix nattereri
. Several recent studies showed that
amphibians avoid open habitats, as fields and roads,
moving mostly in forest areas (M
ADISON& F
ARRAND,
1998; R
OTHERMEL& S
MELISTCH, 2002). This peculiar
behaviour occurs because of increased risks of
desiccation and predation in open areas (S
PEARet al
.,
2005). As the sample sites were representative of Cerrado
biome, characterized by open areas, amphibian behaviour
could be responsible for the reduced gene flow, causing
simultaneously genetic and morphological differentiation
among populations.
Acknowledgments. The authors thank L. D. Guimarães and W. V. Silva for their support during field collections and F. Lobo for the map. We also thank S. Quail for proofreading this manuscript. To IBAMA for the sample license number 017/05. To CNPq (proc. 520804/99-6, 465137/00-8 and 474.189/03-1) and PRONEX (SECTEC-GO proc. 23234156) for their support. To CNPq, for J. A. F. Diniz-Filho, R. P. Bastos and M. P. C. Telles fellowships, and to Pró-Reitoria de Pesquisa e Pós-Graduação from Universidade Católica de Goiás for financial support.
REFERENCES
ATCHLEY, W. R.; RUTLEDGE, J. J. & COWLEY, D. E. 1982. A multivariate
statistical analysis of direct and correlated response to selection in the rat. Evolution 36:677-698.
ATKINSON, D. 1996. Ectotherm life-history responses to
developmental temperature. In: JOHNSTON, I. A. & BENNETT, A.
F. eds. Animals and temperature: phenotypic and evolutionary adaptation. Cambridge, Cambridge University. p.183-204.
BABIK, W. & RAFINSKI, J. 2000. Morphometric differentiation of
the moor frog (Rana arvalis Nilss.) in Central Europe.
Journal of Zoology and Systematic Evolutionary Research 38:239-24.
BLAUSTEIN, A. R.; WAKE, D. B. & SOUSA, W. P. 1994. Amphibian
declines: judging stability, persistence, and susceptibility of populations to local and global extinctons. Conservation Biology 8:60-71.
BLOUIN, M. S. & BROWN, S. T. 2000. Effects of
temperature-induced variation in anuran larval growth rate on head width and leg length at metamorphosis. Oecologia 125:358-361. BOS, D. H. & SITES-JR, J. W. 2001. Phylogeography and
conservation genetics of the Columbia spotted frog (Rana luteiventris; Amphibia, Ranidae). Molecular Ecology 10:
1499-1513.
BRANDÃO, R. A. & ARAÚJO, A. F. B. 1998. A herpetofauna da
Estação Ecológica de Águas Emendadas. In: MARINHO-FILHO,
RODRIGUES F. & GUIMARÃES M. eds. Vertebrados da Estação
Ecológica de Águas Emendadas. História Natural e Ecologia em um fragmento de cerrado do Brasil Central. Brasília, SEMATEC/IEMA. p.9-21.
BRASILEIRO, C. A.; SAWAYA, R. J.; KIEFER, M. C. & MARTINS, M. 2005.
Amphibians of an open cerrado fragment in southeastern Brazil. Biota Neotropica 5(2):1-17. Available at: <http:// www.biotaneotropica.org.br/v5n2/pt/abstract?article+ BN0040522005> Access on: 20.02.2006.
BROWNE, M. & MELS, G. 2000. SYSTAT 10- Statistics 10 –
Statistics II. SPSS Inc., Chicago.
BUSKIRK, V. & ARIOLI, M. 2005. Habitat specialization and adaptive
phenotypic divergence of anuran populations. Molecular Biology 18:596-608.
CAMP, C.; MARSHALL, J. L. & AUSTIN, R. M. 2000. The evolution of
adult body size in black-bellied salamanders (Desmognathus quadramaculatus complex). Canadian Journal of Zoology
78:1712-1722.
CASTELLANO, S. & GIACOMA, C. 1998. Morphological variation of
the green toad, Bufo viridis, in Italy: A Test of Causation.
Journal of Herpetology 32(4):540-550.
CASTELLANO, S.; ROSSO, A.; DOGLIO, S. & GIACOMA, C. 1999. Body size
and calling variation in the green toad Bufo viridis. Journal
of Zoology 248:83-90.
CASTELLANO, S.; GIACOMA, C. & DUJSEBAYEVA, T. 2000.
Morphometrical and advertisement call geographic variation in polyploid green toads. Biological Journal of the Linnean Society 70:341-360.
CEI, J. M. 1980. Amphibians of Argentina. Italian Journal of
Zoology 2:1-690.
CUSHWA, W. T. & MEDRANO, J. F. 1996. Applications of the
random amplified polymorphic DNA (RAPD) assay for genetic analysis of livestock species. Animal Biotechnology 7:11-31.
DUELLMAN, W. E. 1988. Patterns of species diversity in anuran
amphibians in the American Tropics. Annals of the Missouri Botanical Garden 75:79-104.
ETEROVICK, P. C.; CARNAVAL, A. C. O. Q.; BORGES-NOJOSA, D. M.;
SILVANO, D. L. & SEGALLA, M. V. 2005. Amphibian Declines in
Brazil: An Overview. Biotropica 37:166-179.
EXCOFFIER, L., SMOUSE, P. E. & QUATTRO, J. M. 1992. Analysis of
molecular variance inferred from metric distances among DNA haplotypes: application to human mitochondrial DNA restriction data. Genetics 131:479-491.
FROST, D. R. 2004. Amphibian Species of the World: An
Online Reference. American Museum of Natural History, USA. Available at: <http://research.amnh.org/herpetology/ amphibia/index.html>. Access on: 31.01.2006.
FROST, D. R.; GRANT, T.; FAIVOVICH, J.; BAIN, R. H.; HAAS, A.;
HADDAD, C. F. B.; DE SA, R. O.; CHANNING, A.;WILKINSON, M.;
DONNELLAN, S. C.; RAXWORTHY, C. J.; CAMPBELL, J. A.; BLOTTO, B.
L.; MOLER, P.; DREWES, R. C.; NUSSBAUM, R. A.; LYNCH, J. D.;
GREEN, D. M. & WHEELER, W. C. 2006. The amphibian tree of
life. Bulletin of the American Museum of Natural History 297:1-371. Available at: <http://hdl.handle.net/2246/ 5781>. Access on: 22.07.2007.
FUNK, W. C.; GREENE, A. E.; CORN, P. S. & ALLENDOR, F. W. 2005.
High dispersal in a frog species suggests that it is vulnerable to habitat fragmentation. Biological Letters 1-4. Available at: <http://www.royalsoc.ac.uk>. Access on: 12.12.2005. HASSANIEN, H. A.; ELNADY, M.; OBEIDA, A. & ITRIBY, H. 2004.
Genetic diversity of Nile tilapia populations revealed by randomly amplified polymorphic DNA (RAPD).
Aquaculture Research 35:587-593.
IUCN. 2004. Conservation International and Nature Serve. Global Amphibian Assessment. Available at: <http:// www.globalamphibians.org>. Access on: 31.01.2006. JULIANO, R. F. 2003. Variação geográfica, morfométrica e
acústica em Physalaemus cuvieri FITZINGER, 1826
(Amphibia:Anura:Leptodactylidae) no Cerrado do Brasil Central. Dissertação de Mestrado, Universidade Federal de Goiás, Goiânia.
LAMPERT, K. P.; RAND, A. S.; MUELLER, U. G. & RYAN, M. J. 2003.
Fine-scale genetic pattern and evidence for sex-biased dispersal in the túngara-frog, Physalaemus pustulosus. Molecular
Ecology 12:3325-3334.
LENZI-MATTOS, R., ANTONIAZZI, M. M.; HADDAD, C. F. B.; TAMBOURGI,
D. V.; RODRIGUES, M. T. & JARED, C. 2005. The inguinal
macroglands of the frog Physalaemus nattereri
(Leptodactylidae): structure, toxic secretion and relationship with deimatic behaviour. Journal of Zoological 266:385-394. LYNCH, M & MILLINGAN, B. G. 1994. Analysis of population
genetic structure with RAPD markers. Molecular Ecology 3:91-99.
MADISON, D. M. & FARRAND, L. 1998. Habitat use during breeding
and emigration in radio implanted tiger salamanders,
Ambystoma tigrinum. Copeia 1998:402-410.
MANLY, B. F. J. 1997. Randomization, Bootstrap and Monte
Carlo methods in biology. London, Chapman & Hall. 428p. MÉNDEZ, M. A.; SOTO, E. R.; CORREA, C.; VELOSO, A.; VERGARA, E.;
SALLABERRY, M. & ITURRA, P. 2004. Morphological and genetic
differentiation among Chilean populations of Bufo spinulosus
(Anura: Bufonidae). Revista Chilena de História Natural 77:559-567.
MONTEIRO, L. R. & REIS, S. F. 1999. Princípios de Morfometria
Geométrica. Ribeirão Preto, Holos. 188p.
MUELLER, U. G. & WOLFENBARGER, L. L. 1999. AFLP genotyping
Recebido em abril de 2006. Aceito em novembro de 2008. ISSN 0073-4721 Artigo disponível em: www.scielo.br/isz
MYERS, N.; MITTERMEIER, R. A.; MITTERMEIER, C. G.; FONSECA, G. A. B.
& KENT, J. 2000. Biodiversity hotspots for conservation
priorities. Nature 403:853-858.
NASCIMENTO, L. B.; CARAMASCHI, U. & CRUZ, C. A. G. 2005.
Taxonomic Review of the Species Groups of the Genus
Physalaemus Fitzinger, 1826. Arquivos do Museu Nacional 63:297-320.
NEFF, N. A. & MARCUS, L. F. 1980. A Survey of Multivariate
Methods for Systematics. New York, privately published. 234p.
NEWMAN, R. A. & SQUIRE, T. 2001. Microsatellite variation and
fine-scale population structure in the wood frog (Rana sylvatica). Molecular Ecology 10:1087-1100.
PALO, J. U.; SCHMELLER, D. S.; LAURILA, A.; PRIMMER, C. R.; KUZMIN, S.
L. & MERILA, J. 2004. High degree of population subdivision in a
widespread amphibian. Molecular Ecology 13(9):2631-2644. RABOUAM, C.; COMES, A. M.; BRETAGNOLLE V.; HUMBERT, J-F.; PERIQUETS,
G. & BIGOT, Y. 1999. Features of DNA fragments obtained by
random amplified polymorphic DNA (RAPD) assays.
Molecular Ecology 8:493-503.
RAFINSKI, J. & BABIK, W. 2000. Genetic differentiation among
nothern and southern populations of the moor frog Rana arvalis Nilsson in Central Europe. Heredity 84:610-618.
RÄSÄNEN, K.; LAURILA, A. & MERILÄ, J. 2003. Geographic variation
in acid tolerance of the moor frog, Rana arvalis in local
adaptation. Evolution 57:352-362.
RATTER, J. A.; RIBEIRO, J. F. & BRIDGEWATER, S. 1998. The Brazilian
Cerrado vegetation and threats to its biodiversity. Annals of Botany 80:223-230.
ROHLF, F. J. 1989. NTSYSpc: Numerical Taxonomy and
Multivariate Analysis System. New York, Exeter. 800p. ROSSO, A.; CASTELLANO, S. & GIACOMA, C. 2004. Ecogeographic
analysis of morphological and life-history variation in the Italian frog. Evolutionary Ecology Research 18:303-321. ROTHERMEL, B. B. & SEMLISTSCH, R. D. 2002. An experimental
investigation of landscape resistance of forest versus old-field habitats to emigrating juvenile amphibians. Conservation Biology 16:1324-1332.
SAZIMA, I. & CARAMASCHI, U. 1986. Descrição de Physalaemus deimaticus, sp. n., e observações sobre comportamento deimático em Physalameus nattereri (Steindachner) – Anura,
Leptodactylidae. Revista de Biologia 13:91-101. SBH. SOCIEDADE BRASILEIRADE HERPETOLOGIA. 2005. Lista de espécies
de anfíbios do Brasil. Sociedade Brasileira de Herpetologia (SBH). Available at: <http://www.sbherpetologia.org.br/ checklist/anfibios.htm>. Access on: 31.01.2006.
SEPPÃ, P. & LAURILLA, A. 1999. Genetic structure of island
populations of the anurans Rana temporaria and Bufo bufo.
Heredity 82:309-317.
SET, P. 2002. Atlas of Biosphere. Available at:: <http://
www.sage.wisc.edu/atlas/index.php>. Access on: 10.01.2008. SHAFFER, H. B.; FELLERS, G. M.; MAGEE, A. & VOSS, S. R. 2000. The
genetics of amphibian declines: population substructure and molecular differentiation in the Yosemite toad, Bufo canourus
(Anura, Bufonidae) based on single strand conformation polymorphism analysis (SSCP) and mithocondrial DNA sequence data. Molecular Ecology 9:245-257.
SNEATH, P. H. A. & SOKAL, R. R. 1973. Numerical Taxonomy:
The Principles and Pratice of Numerical Classification. San Francisco, W. H. Freeman. 573p.
SPEAR, S. F.; PETERSON, C. R.; MATOCQ, M. D. & STORFER, A. 2005.
Landscape genetics of the blotched tiger salamander (Ambystoma tigrinum melanostictum). Molecular Ecology
14:2553-2564.
TRAKIMAS, G.; MATSUI, M.; NISHIKAWA, K. & KASUGAI, K. 2003.
Allozyme variation among Populations of Rana pirica
(Amphibia: Anura). Journal of Zoology Systematic Evolutionary Research 41:73-79.
TELLES, M. P. C.; DINIZ, J. A. F.; BASTOS, R.P.; SOARES, T.N.; GUIMARÃES,
L. D. & LIMA, L. P. 2007. Landscape genetics of Physalaemus cuvieri in Brazilian Cerrado: Correspondence between
population structure and patterns of human occupation and habitat loss. Biological Conservation 139:37-46. VON EGGELING, F. V. & SPIELVOGEL, H. 1995. Applications of random
PCR. Celular and Molecular Biology 41:653-670. WELLS, K. D. 1977. The social behaviour of anuran amphibians.
Animal Behaviour 25:666-693.
WILBUR, H. M. 1997. Experimental ecology of food webs: complex
systems in temporary ponds. Ecology 78:2279-2302. WILCZYNSKY, W. & RYAN, M. J. 1999. Geographic variation in
animal communication systems. In: FOSTER, A. & ENDLER, J.
eds. Geographic Variation in Behavior-Perspectives on Evolutionary Mechanisms. Oxford & New York, Oxford University. p.231-234.
YOUNG, B.; LIPS, K. R.; REASER, J. K.; IBÁÑEZ, R.; SALAS, A. W.;
CREDEÑO, J. R.; COLOMA, L. A.; RON, S.; LA MARCA, E.; MEYER, J.
R.; MUÑOZ, A.; BOLAÑOS, F.; CHAVES, G. & ROMO, D. 2001.
Population declines and priorities for Amphibian conservation in Latin America. Conservation Biology 15:1213-1223. ZEISSET, I. & BEEBEE, T. J. C. 2003. Population genetics of a
successful invader: the marsh frog Rana ridibunda in Britain.