Association between genetic distances in wheat (
Triticum aestivum
L.)
as estimated by AFLP and morphological markers
Eduardo Alano Vieira
1, Fernando Irajá Félix de Carvalho
2, Ivandro Bertan
2, Mauricio Marini Kopp
2,
Paulo Dejalma Zimmer
2, Giovani Benin
3, José Antônio Gonzalez da Silva
2, Irineu Hartwig
2,
Gaspar Malone
2and Antônio Costa de Oliveira
2 1Empresa Brasileira de Pesquisa Agropecuária, Embrapa Cerrados, Planaltina, DF, Brazil.
2Faculdade de Agronomia Eliseu Maciel, Universidade Federal de Pelotas, Pelotas, RS, Brazil.
3Faculdade de Agronomia, Universidade Tecnológica Federal do Paraná, Pato Branco, PR, Brazil.
Abstract
Molecular and morphological data analyses matrices are very informative tools for the estimation of genetic dis-tances. We used AFLP markers, morphological traits and combined analysis to estimate the genetic distances be-tween wheat genotypes and ascertain any associations bebe-tween the two techneques. Nineteen wheat (Triticum aestivum L.) genotypes were analyzed using amplified fragment length polymorphism (AFLP) markers and field evaluated for two years. The matrices obtained by morphological and molecular marker data analyses revealed a significant but moderate correlation (r = 0.47), indicating that such techniques sample distinct genome regions. The combined analysis was found to be highly correlated with AFLP (r = 0.97) and moderately correlated with morpholog-ical (r = 0.59) markers. A possible explanation for such results is a bias caused by the much higher number of AFLP (229) than morphological (17) markers. Thus, it is evident that the combined analysis is not efficient when a very dis-similar number of markers are used in each isolated technique. Therefore, to obtain a better knowledge of the degree of divergence among genotypes it is necessary to consider each analysis separately.
Key words:reeding, genetic divergence, molecular markers, morphological traits.
Received: November 28, 2005; Accepted: October 3, 2006.
Introduction
The analysis of genetic distance is an auxiliary tool of great use in breeding programs and an important link be-tween the conservation and use of available genetic re-sources (Mahammadi and Prasanna, 2003). A knowledge of genetic distance not only produces a better understand-ing of germplasm organization and higher efficiency dur-ing genotype sampldur-ing but also results in the biologically oriented choice of crosses and gene introgression from ex-otic germplasm, and can also be used to recommend cultivars when the goal is to increase the genetic basis of commercial cultivars for a given region.
In a breeding program, the genetic gain achieved through artificial selection is directly related to the amount of variability and gene quality present in the segregating population. Thus, the correct choice of parents employed in the development of the basic population can influence the final result of the artificial selection and promote a better
al-location of financial resources during the whole process of adjusting genotypes to a given environment (Nienhuiset al., 1993; Bohnet al., 1999). However, to confirm such ex-pectations, it is necessary that the parents combine high means with an increase in variability for the characters un-der selection.
Molecular and morphological analyses are among the most used tools for the estimation of genetic distances within a group of genotypes. Molecular markers provide an excellent tool for obtaining genetic information and their use in the assessment of genetic divergence in wheat (Triticum aestivumL.) has increased in the last few years (Manifestoet al., 2001; Corbelliniet al., 2002; Almanza-Pizónet al., 2003; Máricet al., 2004; Royet al., 2004). Also, because molecular markers are not subject to envi-ronmental influence they are considered superior to mor-phological markers (Máric et al., 2004). Amplified fragment length polymorphism (AFLP) markers are the preferred type of molecular markers because of their multi-plex power, their efficiency in detecting genetic variability and the robustness of AFLP assays (Voset al., 1995).
Genetics and Molecular Biology, 30, 2, 392-399 (2007) Copyright by the Brazilian Society of Genetics. Printed in Brazil www.sbg.org.br
Send correspondence to Eduardo Alano Vieira. Embrapa Cer-rados, Caixa Postal 8223, 73310-970 Planaltina, DF, Brazil. E-mail: [email protected].
Morphological characters, in association with multi-variate techniques, have been employed in quantifying ge-netic distance in wheat (Zeven and Schachl, 1989; Van Beuningen and Bush, 1997; Máricet al., 2004; Royet al., 2004). However, phenotype expression is influenced by ge-notypevs.year and genotypevs.location interactions, lead-ing to a low accuracy of quantitative genetic parameter estimates.
Nevertheless, the effectiveness of the simultaneous use of AFLP and morphological markers to measure geno-type relationships, as well as the magnitude of association between these methods, is not yet fully understood. Thus, the objective of the work presented in this paper was to use AFLP, morphological and combined markers to estimate the genetic distance between wheat (Triticum aestivumL.) genotypes and to establish the degree of association be-tween these techniques.
Materials and Methods
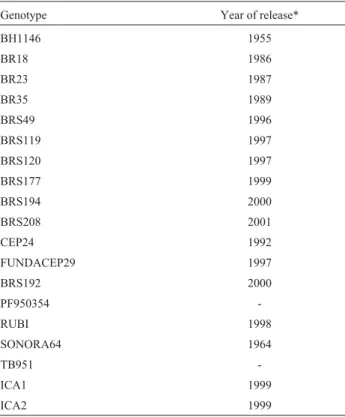
The 19 wheat genotypes used in our study are listed in Table 1, two genotypes, the aluminum-tolerant BH1146 and the aluminum-sensitive Sonora64 genotypes (Bertanet al., 2006) being included due to their well known responses to excess aluminum. To measure the morphological charac-ters, experiments were conducted during the 2003 and 2004 cropping seasons in an experimental field belonging to the Genomic and Plant-improvement Center of the Federal University of Pelotas (Centro de Genômica e
Fitomelho-ramento/Universidade Federal de Pelotas – CGF/UFPEL), in the municipality of Capão do Leão (31°52’00” S, 52°21’2” W, altitude = 13.24 m) in the southern Brazilian state of Rio Grande do Sul. The experimental design was completely randomized blocks with three replications, and the plots were composed of five 5 m rows spaced 0.2 m apart. It were disregarded the 2 outer rows and 0,5 m on the end of each of the 3 left inner rows, thus the useful area of each plot consisted of 4 m length of each three inner row. Each plot was base-fertilized with the equivalent of 300 kg ha-1 of 5-20-20 NPK fertilizer and top-dressed with the equivalent of 60 kg ha-1 N at tilling. Weeding was per-formed manually and ants were controlled using granulated baits, other pest and disease control measures being carried out according to the recommendations of the Southern Bra-zilian Wheat Research Committee (Comissão Sul Brasi-leira de Pesquisa de Trigo, 2002).
A total of 17 morphological characters were deter-mined, according to procedures presented by Scheeren (1984): i) days from emergence to flowering (DEF); ii) days from emergence to maturation (DEM); iii) days from flowering to maturation (DFM); iv) plant stature in cm (PS); v) number of fertile tillers per linear meter (FTLM); vi) weight of a thousand grains (WTG); vii) hectoliter weight in kg hL-1(HW); viii) grain yield in kg ha-1(GY). The following morphological characters were measured on a sample of 25 plants per plot: ix) flag leaf blade width in cm (LBW); x) flag leaf blade length in cm (FLL); xi) leaf sheath length in cm (LSL); xii) peduncle length in cm (PL). In addition, the following characters were determined on a sample of 25 spikes per plot: xiii) spike length in cm (SL); xiv) number of spikelets per spike (NS); xv) spike weight in g (SW); xvi) number of grains per spike (NG) and xvii) number of grains per spikelet (NG/NS).
Morphological character data were subjected to anal-ysis of variance (ANOVAR), considering the effects of ge-notypes and years as fixed. The character means, based on two years, were compared using the least significant differ-ences (LSD) method (Steel and Torrie, 1980) at the 5% probability level (p = 0.05) and the generalized Mahala-nobis distance (D2) was obtained for all genotype pairs, based on two years of evaluation, using the Genes software (Cruz, 2001). From the genetic distance matrix, a dendro-gram was constructed using the unweighted pair group method with arithmetic means (UPGMA) method. The ad-justment between the distance matrix and the dendrogram was estimated by the cophenetic correlation coefficient (r; Sokal and Rolf, 1962) using the NTSYS pc 2.1 software (Rolf, 2000).
The DNA used in the AFLP analyses was extracted according to the protocol described in Saghai-Maroofet al.
(1984). The analyses of AFLP markers were performed ac-cording to the protocol described by Voset al.(1995). The six primer combinations used wereM-CTA/E-ACT (C1),
M-CAA/E-AGC (C2), M-CAG/E-AGC (C3), M-CAC/E
-Table 1- Wheat genotypes used.
Genotype Year of release*
BH1146 1955
BR18 1986
BR23 1987
BR35 1989
BRS49 1996
BRS119 1997
BRS120 1997
BRS177 1999
BRS194 2000
BRS208 2001
CEP24 1992
FUNDACEP29 1997
BRS192 2000
PF950354
-RUBI 1998
SONORA64 1964
TB951
-ICA1 1999
ICA2 1999
ACA (C4),M-CAA/E-ACA (C5) andM-CAG/E-ACT (C6),
where Cirepresents theithprimer combination andEandM
represent theEcoRI andMseI restriction enzymes. The am-plified fragments were electrophoresed in (w/v) 6% dena-turing polyacrylamide gels and stained using silver nitrate (Creste et al., 2001). Bands were scored as binary data (1 = presence and 0 = absence) and the average polymor-phic information content (PIC) was calculated for each primer combination by applying the formula PIC = 1 -Σpi2,
wherepiis the frequency of the ith allele (Powell et al.,
1996). The marker index (MI) was calculated for each primer combination as MI = PIC xnpi, werenpiis the
num-ber of polymorphic bands (Powellet al., 1996).
A genetic similarity calculation was performed using the software NTSYS pc 2.1. The genetic similarity (Sij) was
measured using the Dice coefficient (Dice, 1945) according to the equationSij= 2Nij/(Ni+Nj), whereNijis the number
of bands present in both genotypesiandj,Niis the number
of bands present in genotypei, and Njis the number of
bands present in genotypej. The genetic similarity was con-verted to genetic dissimilarity according to the equationDij
= 1 –Sij, in whichDijis the genetic dissimilarity in each pair
ofiandjgenotypes, andSijis the genetic similarity between
each pair ofiandjgenotypes. The dissimilarity matrix pro-duce was used to generate an UPGMA dendrogram, the adjustment between the dissimilarity matrix and the den-drogram being estimated from the cophenetic correlation coefficient (r) using the NTSYS pc 2.1 software. Cluster stability was measured by bootstrap analysis with 1,000 replications using the Winboot software (Yap and Nelson, 1996). The Genes software (Cruz, 2001) was used to mate the minimum number of markers needed for the esti-mation of genetic distance with a correlation coefficient (r) of at least 0.95.
Genetic similarity was also estimated between all ge-notype pairs using the similarity index proposed by Gower (1971) which uses both binary and quantitative morpholog-ical data to estimate a unique similarity index ranging from 0 to 1, calculated as
S
t h h h
p
h j
p
αβ
αβ αβ
αβ
δ
δ = =
=
∑
∑
11
wheretαβhis adjusted for the type of variable (h) and where
ifhis binary (as in AFLP analysis) thentαβhequals 0 and δabh= 1 ifhfor each genotypes is different while bothtαβh
andδabhequal 1 ifhis present in both genotypes or 0 ifhis
absent from both genotypes but ifhis a quantitative vari-able, such as is the case for some morphological parame-ters, then
t
x x
x x
h
h h
h h
αβ
α β
= −
−
−
1
(max min )
andδabhequals 1, whereδabhis the variable value (h) for
ge-notypeαandxβhis the value for the same variable in
geno-type β. The genetic similarity was estimated using the Multiv v. 2.3 software (Pillar, 1997), was converted into genetic dissimilarity according to the equationDαβ= 1 –Sij
in whichDαβis genetic dissimilarity between each pair ofα
andβgenotypes whileSαβis the genetic similarity between
each pair ofα andβgenotypes. The dissimilarity matrix generated was used to construct an UPGMA dendrogram, the adjustment between the dissimilarity matrix and the dendrogram being estimated from the cophenetic correla-tion coefficient (r) using the NTSYS pc 2.1 software.
Mantel test (Mantel, 1967) with 1,000 permutations was used to estimate the correlation (association) signifi-cance between the distance matrices resulting from mor-phological, AFLP and combined analyses, the test being calculated using the NTSYS pc 2.1 software.
Results and Discussion
The analysis of variance indicated that for all the characters evaluated there were statistically significant dif-ferences (p = 0.05) between the genotypes studied and, for most of the characters evaluated, for years and the genotype times year interaction, justifying the need for evaluating ge-notypes for more than one year in order to obtain a reliable estimate of individual means for the majority of characters evaluated (Table 2). The coefficients of variation for the data shown in Table 2 were low (2 to 13%), indicating high experimental accuracy for the study.
Examination of maximum and minimum values for each of the characters measured showed that some geno-types presented means located at the top and bottom limits for a large number of characters. For example, the Sonora 64 genotype showed mean values at the bottom limit of the range for seven (DEF, DEM, LBW, LSL, GY, HW and NG/NS) out of the 17 measured characters (Table 2) while for genotype TB 951 a total of six characters had mean val-ues located at the top (characters LBW, FLL, NE and SL) or bottom (characters PS and PL) limits (Table 2), indicating that these genotypes have very different morphological characters compared to the other genotypes. According to the LSD test, only the DEF characteristic showed no geno-types with means significantly below the overall mean while only the NG/NE characteristic showed no genotypes with means significantly above the overall mean (Table 2).
The overall Mahalanobis distance (D2) estimated us-ing morphological characters revealed that the most distant genotypes were TB 951 and BRS 194 while the closest were BRS 119 and BRS 208. The dendrogram showed that the most distinct genotypes were Sonora 64, TB 951 and BR 18 (Figure 1). The large distance found between the
al.
395
weight (HW), number of spikelets per spike (NS), spike length (SL), spike weight (SW), number of grains per spike (NG), number of grains per spikelet (NG/NS) and weight of a thousand grains (WTG) evaluated in 19 wheat genotypes.
Characters‡
Genotypes† DEF
(days) DEM (days)
DFM (days)
EP (cm)
FTLM (unit.)
LBW (cm)
FLL (cm)
LSL (cm)
PL (cm)
GY (kg ha-1)
HW (kg hL-1)
NS (unit.)
SL (cm)
SW (g)
NG (unit.)
NG/NS (unit.)
WTG (g)
BH1146 71.83 128.67S 56.83S 103.33S 84.33 1.26 19.06I 19.80S 20.07 2418.52I 72.43I 14.97 8.99 1.74 32.97 2.20 41.43
BR18 72.00 112.83 40.83 79.17I 75.67 1.45 24.03S 17.20 16.09 2311.11I 70.90I 14.76I 9.01 2.00 31.95I 2.18 44.06S
BR23 75.83S 122.33S 46.50 95.83 82.50 1.33 21.95 17.34 21.02S 3682.41S 76.67 17.13 10.15S 2.15 39.90 2.33 40.21
BR35 79.67S 116.67S 37.00 96.67 81.00 1.39 20.80 20.16S 16.22 3347.22 74.53 16.54 8.65 2.09 39.11 2.35 40.74
BRS49 72.33 113.67 41.33 103.33S 87.67 1.45 19.82 18.39 17.92 2911.11 73.00 17.65S 8.43 2.05 41.33 2.36 36.39
BRS119 70.83 114.17 43.33 90.83 83.17 1.24 24.85S 18.77 18.21 3072.22 76.20 17.20 9.03 2.23 44.50 2.59 38.13
BRS120 72.83 116.33S 43.50 96.67 114.33S 1.46 24.33S 18.02 18.99 3324.08 76.73 16.00 8.90 1.95 34.70 2.16 41.03
BRS177 73.17S 118.67S 45.50 95.00 109.33S 1.30 23.13 18.32 18.24 4159.19S 77.77S 15.77 9.25 1.88 40.67 2.58 35.37
BRS194 68.50 114.67 46.17 100.00 104.17 1.24 16.28I 15.82I 20.04 3690.67S 72.70I 17.27 7.83I 2.09 39.30 2.28 40.21
BRS208 66.67 110.17 43.50 90.83 86.50 1.20 22.22 18.14 18.17 3271.30 75.47 15.93 8.18 2.08 39.57 2.48 40.65
CEP24 65.17 107.83 42.67 109.17S 91.83 1.37 24.46S 21.17S 24.21S 3230.56 76.60 15.48 8.98 2.01 33.80 2.18 46.64S
CEP29 59.83 108.33 48.50 85.83I 82.83 1.50S 20.51 16.83 22.79S 3166.67 74.97 16.03 9.18 2.30 42.83 2.67 40.67
BRS192 65.17 111.00 45.83 87.50 74.67 1.47 22.73 17.74 14.86I 3225.87 77.90S 15.87 8.62 2.26 41.93 2.64 35.20
PF950354 63.00 100.00I 37.00 107.50S 85.50 1.26 19.78 17.43 20.05 2944.45 76.00 17.50 10.68S 2.25 41.47 2.38 39.88
RUBI 63.17 102.33I 39.17 92.50 115.83S 1.25 19.92 16.18I 15.48I 3938.89S 79.50S 14.93 8.11 1.85 35.23 2.36 37.14
SONORA64 44.83I 86.50I 41.67 82.50I 80.83 1.01I 19.08I 15.39I 15.78I 1697.22I 69.90I 14.90 8.30 1.48I 29.41I 1.98I 36.23
TB951 58.50I 98.33I 39.83 69.17I 77.17 1.71S 24.78S 16.18I 12.39I 2404.54I 75.80 18.73 S 11.70S 2.48S 49.57S 2.64 35.70
ICA1 56.17I 100.50I 44.33 105.83S 97.17 1.31 23.48S 18.61 25.92S 2956.48 76.10 15.77 8.14 1.81 37.22 2.35 34.63
ICA2 53.33I 108.50 55.17S 84.17I 67.67I 1.27 15.84I 15.41I 13.51I 2557.41I 73.70 16.18 8.64 1.93 40.38 2.49 33.69I
SV (DF)
MS genotypes (18) 447* 556* 163* 658* 1114* 0.13* 48* 15* 74* 2195747* 36* 7* 5* 0.32* 141* 0.22* 70*
MS years (1) 26163* 22709* 122 3427* 10827* 0.09 50* 86* 272* 18101066* 24* 13 3 1* 597* 0.88* 4
MS G x Y (18) 407* 699* 159* 56* 252* 0.03* 7* 2* 10* 604834* 15* 1 0.28 0.16* 52* 0.17* 27*
MS residue (72) 19 11 22 17 142 0.01 2 0.50 2 84168 2 0.70 0.33 0.07 17 0.05 8
CV (%) 7 3 11 4 13 7 6 4 8 9 2 5 6 13 11 9 7
Mean 65.94 110.10 44.14 93.46 88.53 1.34 21.42 17.73 18.41 3068.94 75.10 16.24 8.99 2.03 38.73 2.38 38.84
Amplitude 34.84 42.17 19.83 40 48.16 0.7 8.94 5.78 13.53 2461.97 9.6 3.97 3.87 1 20.16 0.69 10.37
LSD (5%) 7.00 5.30 7.55 6.73 19.33 0.15 2.04 1.12 2.39 471.40 2.37 1.36 0.93 0.43 6.67 0.36 4.49
†Abbreviations: CV = coefficient of variation; DF = degrees of freedom; MS = mean square; LSD = least square difference; SV = source of variation. ‡
Sonora 64 and TB 951 genotypes and the other genotypes in the dendrogram generated by morphological characters was expected, since their means were located at the top or bottom limits for a large number of phenotypic characters. The cophenetic correlation coefficient (r = 0.80) showed a fair degree of agreement between the graphical representa-tion of distances and the original matrix, supporting the vi-sual inferences drawn from Figure 1.
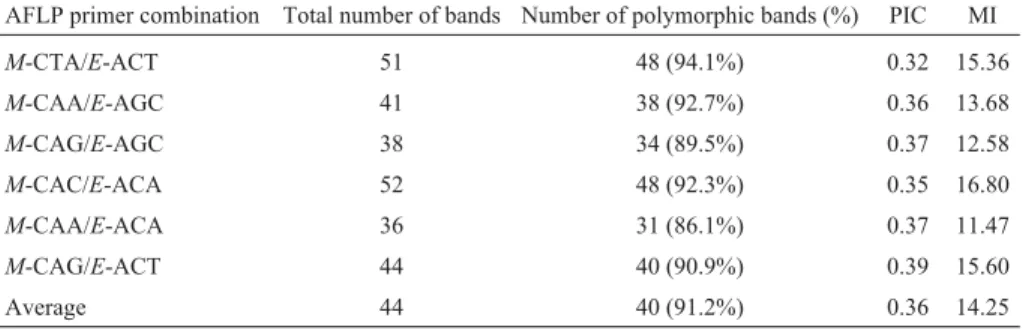
The six AFLP primer combinations used generated a total of 262 bands, of which 239 (91.2%) were polymorphic among the 19 genotypes studied. Analysis of the minimum number of informative markers revealed that among all the markers obtained at least 200 were required for the com-bined analysis to have a correlation coefficient of 0.95. Since the minimum number of informative markers was very close to the number of polymorphic markers evaluated (239) subsequent analyses were performed with all mark-ers.
The PIC values were very close for the primer combi-nations used, so that the higher MI values were detected for combinations presenting the higher number of polymorphic bands (Table 3). The combinations producing the highest number of polymorphic bands (48) wereM-CTA/E-ACT andM-CAC/E-ACA while the combination producing the
lowest number of polymorphic bands (31) was
M-CAA/E-ACA. The low number of monomorphic bands (23) obtained by using all primer combinations demon-strated that AFLP analysis has a high potential for detecting the genetic variability present in these wheat genotypes. A similar scenario was reported by Corbelliniet al.(2002) who analyzed 40 wheat genotypes from Central and South-ern Europe using five AFLP primer combinations and ob-tained an average of 40 polymorphic bands per primer combination and a total of 200 polymorphic bands. Slightly lower levels of polymorphism have also been detected in wheat, such as the 59% reported by Almanzá-Pizonet al.
(2003) and the 47% reported by Royet al.(2004). Taken to-gether, these results indicate that AFLP markers are effi-cient in detecting genetic variability in wheat.
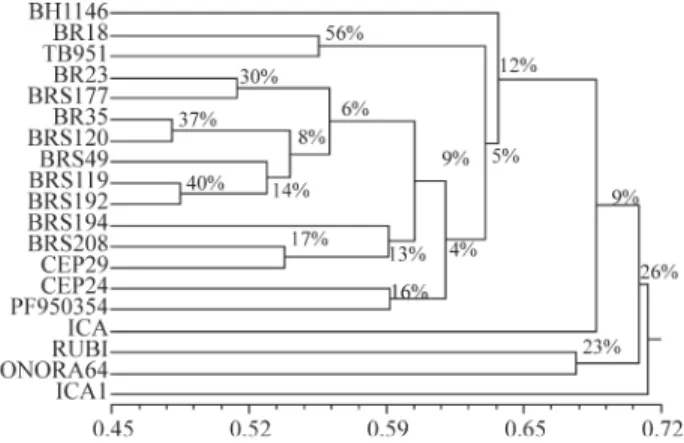
The genetic dissimilarity estimated using AFLP markers showed that the most similar genotypes were BR 35 and BRS 120 and the most dissimilar were TB 951 and ICA 1. Clustering percentage values above 30% for 1,000 bootstrap cycles occurred in only four groups (BR 18 and TB 951 (57%), BRS 119 and BRS 192 (40%), BRS 35 and BRS 120 (37%) and BR 23 and BRS 177 (30%)), revealing that such clusters are the most consistent (Figure 2). The cophenetic correlation coefficient for the dendrogram (r = 0.85) indicated good agreement between the graphical display of distances and the original matrix, supporting the visual inferences suggested in Figure 2.
Of the four most consistent AFLP analysis clusters, three (BR 18 and TB 951; BR 23 and BRS 177; BRS 119 and BRS 192) were consistent with the distance estimated using morphological characters (Figures 1 and 2). A certain agreement between the distances estimated through these two techniques was found, as evidenced by a moderate but significant correlation (r = 0.47) between the morphologi-cal genetic distance matrix and the AFLP marker matrix (Table 4). Previous studies have reported that small genetic distances as estimated by molecular markers were consis-tently associated with small phenotypic distances (Dillmannet al., 1997; Lefebvreet al., 2001) while large molecular distances can either be associated with large or small phenotypic distances (Dillmann et al., 1997; Lefebvreet al., 2001).
396 Genetic distances in wheat
Table 3- Amplified fragment length polymorphism (AFLP) primer combinations, total number of bands, number and percentage of polymorphic bands,
average polymorphic information (PIC) and marker index (MI) per primer combination for 19 wheat genotypes.
AFLP primer combination Total number of bands Number of polymorphic bands (%) PIC MI
M-CTA/E-ACT 51 48 (94.1%) 0.32 15.36
M-CAA/E-AGC 41 38 (92.7%) 0.36 13.68
M-CAG/E-AGC 38 34 (89.5%) 0.37 12.58
M-CAC/E-ACA 52 48 (92.3%) 0.35 16.80
M-CAA/E-ACA 36 31 (86.1%) 0.37 11.47
M-CAG/E-ACT 44 40 (90.9%) 0.39 15.60
Average 44 40 (91.2%) 0.36 14.25
Figure 1- Morphological character unweighted pair group method with
The moderate association between genetic distances estimated using molecular and phenotypic markers can be explained by a range of factors. Molecular analysis pro-vides a wider genome sampling than the morphological analysis, since a study comparing both techniques rarely evaluates the same, or even a similar, number of morpho-logical and molecular markers. The association between es-timates is also influenced by the fact that a large portion of the variation detected by molecular markers is non adaptive and, therefore, not subject to either natural or artificial se-lection. On the other hand, the phenotypic characters are subject to both natural and artificial selection, aside from their high environmental dependence. Moreover, it is not always the case that two identical phenotypes are deter-mined by the same genes,i.e., distinct genes may lead to similar phenotypes. Thus, it is clear that such estimates are closer when there is an association between the loci con-trolling the targeted morphological traits (quantitative trait loci, or QTLs) and the evaluated bands and when a large number of morphological traits are evaluated (Dillmannet al., 1997; Schutet al., 1997; Lefebvreet al., 2001; Máricet al., 2004; Royet al., 2004).
Máricet al. (2004) investigated wheat and reported an r = 0.12 correlation between distances estimated using random amplified polymorphic DNA (RAPD) markers and 12 morphological characters. This was lower than the r = 0.47 correlation detected by us, possibly because we used a larger number of morphological characters (17) and hence a larger sample of the wheat genome. In another study of wheat, Royet al.(2004) reported that the correla-tion between genetic distances estimated in wheat using AFLP markers and 14 morphological characters was r = 0.072, indicating an association close to null. However, although the morphological measurements conducted by Royet al.(2004) were also performed in two years the
ge-notypes were evaluated under spaced-plant conditions, like in our study in which the genotypes were evaluated un-der full-row conditions. Taken together, these studies may indicate that under full-row conditions genetic distances tend to be closer than under spaced-plant conditions in which genotypes can express their phenotype without fac-ing competition for space and nutrients.
Dreisigacker et al. (2004) analyzed 68 advanced wheat lines using 99 simple sequence repeat (micro-satellite) (SSR) markers but did not differentiate the lines regarding the five distinct mega-environments in which they were selected. According to Dreisigackeret al.(2004) there may be three possible reasons for unsuccessful sepa-ration: i) selection based on mega-environment adaptation has not been practiced long enough to differentiate the germplasm; ii) genes conferring fitness to one mega-environment are not unique to that mega-mega-environment and may confer fitness to several other mega-environments; and iii) adaptation to a mega-environments is not based on accretion of random genes but rather on a limited set of spe-cific genes.
In our study, genetic dissimilarity as estimated through the combined analysis of AFLP and morphological characters showed that the most similar genotypes were BR 35 and BRS 120 and that the most dissimilar were TB 951 and ICA 1. The most distinct genotypes in the collection used in this study were ICA 2 and Sonora 64 (Figure 3). The cophenetic correlation coefficient of the dendrogram (r = 0.81) showed good agreement between the graphical representation of the distances and the original matrices, which enabled more accurate visual inferences to be drawn using Figure 3.
We also found a higher correlation (r = 0.97) between the combined and molecular matrices than between the combined and morphological matrices (r = 0.59), with both correlations being significant at p = 0.05 by the Mantel test
Figure 3- Combined morphological character and amplified fragment
length polymorphism (AFLP) marker unweighted pair group method with arithmetic means (UPGMA) dendrogram resulting from the analysis of 19 wheat genotypes using the complement of the similarity index of Gower (1971) obtained from the combined analysis of phenotypic and AFLP markers as a measure of genetic dissimilarity. The value of the cophenetic correlation coefficient (r) was 0.81.
Figure 2 - Amplified fragment length polymorphism (AFLP) marker
with 1,000 permutations (Table 4). Such difference in asso-ciation between matrices could be based on the different number of data points for AFLP markers (229) and phenotypic characters (17). The results obtained in our study suggests that to obtain a more complete understand-ing of the degree of genotype divergence it is necessary to consider the molecular and morphological data separately. Francoet al.(2001) have suggested that better genotype discrimination is obtained by the combined molecular and morphological data when one determines,a priori, the min-imum number of markers that will lead to the same results as the combination of all markers. However, Warburtonet al.(2002) has pointed out that this strategy may lead to er-rors because the presence of translocated segments on chro-mosomes within the studied genotypes can lead to overestimation of genetic distances, especially when there is no information available about the presence or absence of the translocated segments concerned. Warburton et al.
(2002) also showed that only four AFLP markers, located on translocated wheat segments, out of 40 polymorphic markers were sufficient to mistakenly cluster 101 sister lines only as function of the presence of translocated seg-ments and that separation of the 101 sister lines as a func-tion of their pedigrees was achieved only when these four markers were eliminated from the analyses.
In our study, the morphological and molecular marker analyses showed that the most divergent genotype is Sonora 64 (Figures 1 and 2). However, this genotype should not be prioritized in crosses, because it presents the lowest grain yield value (Table 2). Among the characters most targeted in plant breeding are those related to produc-tivity (GY and HW) which determine the ultimate genotype performance. For such characters, the choice of cross aim-ing to increase the productivity plateau should include ge-notypes with high GY, however divergent for the pool of evaluated characters. Genotypes that are high yielding and also divergent probably have different QTLs controlling GY and these QTLs could be combined into a new geno-type superior to both parents (transgressive segregant). In this sense, BR 23 and/or RUBI are promising genotypes, since they fulfill the requirements of being high yielding (Table 2) and divergent as indicated by both morphological and molecular data (Figures 1 and 2). Among the possible
crossing combinations, special attention should be drawn to the promising cross between BRS 177 and Rubi, which was high yielding, divergent and demonstrated high HW (Table 2, Figures 1 and 2).
Acknowledgments
The authors are grateful to the Brazilian agencies FAPERGS, CNPq and CAPES for grants and graduate re-search and rere-search productivity fellowships. The authors also thank Dr. Ana Pontaroli and Dr. Shavanor Smith from the Bennetzen’s laboratory at the University of Georgia for kindly revising this manuscript.
References
Almanza-Pinzón MI, Hairallah M, Fox PN and Walburton ML (2003) Comparison of molecular markers and coefficients of parentage for the analysis of genetic diversity among spring bread wheat accessions. Euphytica 130:77-86.
Bertan I, Carvalho FIF, Oliveira AC, Silva JAG, Benin G, Vieira EA, Silva GO, Hartwig I, Valério IP and Finatto T (2006) Dissimilaridade genética entre genótipos de trigo avaliados em cultivo hidropônico sob estresse por alumínio. Bragantia 65:55-63 (abstract in English).
Bohn M, Friedrich H and Melchinger AE (1999) Genetic similari-ties among Winter wheat cultivars determined on basis of RFLPs, AFLPs, SSRs and their use for predicting variance. Crop Sci 39:228-237.
Comissão Sul Brasileira de Pesquisa de Trigo (2002) Indicações Técnicas da Comissão Sul-Brasileira de Pesquisa de Trigo. Embrapa Trigo, Passo Fundo, 74 pp.
Corbellini M, Perenzin M, Accerbi M, Vaccino P and Borghi B (2002) Genetic diversity in bread wheat, as revealed by coef-ficient of parentage and molecular markers, and its relation-ship to hybrid performance. Euphytica 123:273-285. Creste S, Tulmann-Neto A and Figueira A (2001) Detection of
single sequence repeat polymorphism in denaturing poly-acrylamide sequencing gels by silver staining. Plant Mol Biol Rep 4:1-8.
Cruz CD (2001) Programa Genes: Aplicativo Computacional em Genética e Estatística. UFV, Viçosa, 648 pp.
Dice LR (1945) Measures of the amount of ecological association between species. Ecology 26:297-307.
Dillmann C, Bar-Hen A, Guérin D, Charcosset A and Murigneux A (1997) Comparison of RFLP and morphological distances between maizeZea maysL. inbred lines. Consequences for germplasm protection purposes. Theor Appl Genet 95:92-102.
Dreisigacker S, Zhang P, Warburton ML, Van Ginkel M, Hoisington D, Bohn M and Melchinger AE (2004) SSR and pedigree analyses of genetic diversity among CIMMYT wheat lines targeted to defferent megaenvironments. Crop Sci 44:381-388.
Franco J, Crossa J, Ribaut JM, Bertran J, Warburton ML and Khairallah M (2001) A method for combining molecular markers and phenotypic attributes for classifying plant ge-notypes. Theor Appl Genet 103:944-952.
Gower JC (1971) A general coefficient of similarity and some of its properties. Biometrics 27:857-874.
398 Genetic distances in wheat
Table 4 - Correlation between genetic distance matrices estimated
through the analyses of phenotypic characters (MDP), amplified fragment
length polymorphism (AFLP) markers (MDAFLP) and combined analysis
(MDP+AFLP) for 19 wheat genotypes.
MDP MDAFLP MDP+AFLP
MDP 1 0.47* 0.59*
MDAFLP 1 0.97*
MDP+AFLP 1
Lefebvre V, Goffinet B, Chauvet JC, Caromel B, Signoret P, Brand R and Palloix A (2001) Evaluation of genetic dis-tances between pepper inbred lines for cultivar protection purposes: Comparison of AFLP, RAPD, and phenotypic data. Theor Appl Genet 102:741-750.
Manifesto MM, Schlatter AR, Hopp HE, Suárez EY and Dubcovsky J (2001) Quantitative evaluation of genetic di-versity in wheat germplasm using molecular markers. Crop Sci 41:682-690.
Mantel N (1967) The detection of disease clustering and a gener-alized regression approach. Cancer Res 27:209-220. Máric S, Laríc S, Artincic J, Pejíc I and Kozumplink V (2004)
Ge-netic diversity of hexaploid wheat cultivars estimated by RAPD markers, morphological traits and coefficients of par-entage. Plant Breed 123:366-369.
Mohammadi SA and Prasanna BM (2003) Analyses of genetic di-versity in crop plants – Salient statistics tools and consider-ations. Crop Sci 43:1235-1248.
Nienhuis J, Slocum MK, Devos DA and Muren R (1993) Genetic similarity amongBrassica oleraceagenotypes as measured by restriction fragment length polymorphisms. J Am Hort Sci 118:298-303.
Pillar VP (1997) Multivariate exploratory analysis and random-ization testing using Multiv. Coenoses 12:145-148. Powell W, Morgante M, Andre C, Hanafey M, Vogel J, Tingey S
and Rafalski A (1996) The comparison of RFLP, RAPD, AFLP and SSR (microsatellite) markers for germplasm analysis. Mol Breed 2:225-238.
Rohlf FJ (2000) NTSYS-pc: Numerical Taxonomy and Multi-variate Analysis System, version 2.1. Exeter Software, New York, 83 pp.
Roy JK, Lakshmikumaran MS, Balyan HS and Gupta PK (2004) AFLP-based genetic diversity and its comparison with di-versity based on SSR, SAMPL, and phenotypic traits in bread wheat. Bioc Gen 42:43-59.
Saghai-Maroof MA, Soliman KM, Jorgensen RA and Allard RW (1984) Ribosomal DNA spacer length polymorphism in bar-ley: Mendelian inheritance, chromosome location and popu-lation dynamics. Proc Nat Acad Sci USA 89:1477-1481. Scheeren PL (1984) Instruções para Utilização de Descritores de
Trigo (Triticumsp.) e Triticale (Triticunsp.). Embrapa Tri-go, Passo Fundo, 32 pp.
Schut JW, Qi X and Stam P (1997) Association between relation-ship measures based on AFLP markers, pedigree data and morphological traits in barley. Theor Appl Genet 95:1161-1168.
Sokal RR and Rohlf FJ (1962) The comparison of dendrograms by objective methods. Taxon 11:30-40.
Steel RGD and Torrie JH (1980) Principles and Procedures of Sta-tistics: A Biometrical Approach. McGraw-Hill Book Com-pany, New York, 633 pp.
Van Beuningen LT and Bush RH (1997) Genetic diversity among North American spring wheat cultivars: III. Cluster analysis based on quantitative morphological traits. Crop Sci 37:981-988.
Vos P, Hogers R, Bleeker M, Reijans M, Van de Lee T, Hornes M, Fritjers A, Pot J, Peleman J, Kuiper M and Zabeau M (1995) AFLP: A new technique for DNA fingerprinting. Nuc Acids Res 23:4407-4414.
Warburton ML, Skovmand B and Mujeeb-Kazi (2002) The mo-lecular genetic characterization of the ‘Bobwhite’ bread wheat family using AFLPs and the effect of the T1BL.1RS translocation. Theor Appl Genet 104:868-873.
Yap IV and Nelson RJ (1996) Winboot: A program for perform-ing bootstrap analysis of binary data to determine the confi-dence limits of UPGMA-based dendrograms. IRRI, Manila, 22 pp.
Zeven AC and Schachl R (1989) Groups of bread wheat landraces in the Australian Alps. Euphytica 41:235-246.