Genetic diversity in Brazilian soybean
germplasm
Raoni Gwinner
1*, Tesfahun Alemu Setotaw
1, Moacir Pasqual
1,
Joao Bosco dos Santos
2, Alan Mario Zuffo
1, Everton Vinicius
Zambiazzi
1and Adriano Teodoro Bruzi
1Abstract: Genetic diversity is an essential factor for the success of any plant breeding program and should be considered to ensure genetic gain through breeding. In Brazil, research on the genetic diversity and population structure of soybean is required since the species is an important commodity of the country. The study addressed the genetic diversity and population structure of 77 soybean genotypes using 35 SSR markers. The estimate of the diversity index showed that the level of genetic diversity in the soybean collection is low. Similarly, the Jac
-card coefficient and Bayesian model based on clustering analysis confirmed the low diversity among soybean genotypes, providing evidence for the assumption of a genetic bottleneck effect on Brazilian soybean genotypes. The results also reinforced the importance of finding and incorporating new genetic resources of soybean in the genetic pool of Brazilian soybean to warrant genetic gain in soybean breeding in the future.
Key words: Glycine max, molecular markers, SSR, plant breeding.
Crop Breeding and Applied Biotechnology 17: 373-381, 2017 Brazilian Society of Plant Breeding. Printed in Brazil
http://dx.doi.org/10.1590/1984-70332017v17n4a56 ARTICLE
*Corresponding author:
E-mail: [email protected]
Received: 15 August 2016 Accepted: 22 February 2017
1 Universidade Federal de Lavras (UFLA), Departamento de Agricultura, 37.200-000, Lavras, Minas Gerais, Brazil 2 UFLA, Departamento de Biologia INTRODUCTION
The expansion of soybean (Glycine max [L.] Merr.) around the world is remarkable. Over the past few decades, the soybean acreage increased drastically, making this crop one of the most widely cultivated worldwide (Phalan et al. 2013), mainly due to its outstanding role as protein and oil source (Clemente and Cahoon 2009). In Brazil, the increase in cultivated area was closely associated with management innovation. As a result, yield rates increased in most cultivated areas (Ray et al. 2012), and the country became the second largest producer in the world (USDA 2017).
With regard to innovation, the development of new crop management technologies and the release of better-adapted genotypes can be considered key factors for the establishment of soybean as one of the major crops in Brazil (Sediyama et al. 2012). Generally, plant breeding has contributed markedly to gains in crop yields, including of soybean. In Iowa for example, plant breeding obtained a genetic gain of 79% between 1930 and 2011 (Smith et al. 2014). However, the success of breeding programs in any crop species depends on the availability of a genetic pool with adequate diversity and its management.
and reducing the adaptability to environmental changes (Smith et al. 2015). Therefore, breeders should focus on the enrichment of genetic diversity in the breeding population, to ensure continuous increases in genetic gain in the long run. The final goal of genetic diversity studies is the understanding of variation among genotypes or groups of genotypes (Mohammadi and Prasanna 2003). To this end, all types of data can be used, e.g., of genealogy, morphologic traits, the biochemical profile, genotypic data, and many others. Commonly, SSR markers are used in genetic studies, due to their multiallelic nature and repeatability in laboratories (Kaga et al. 2012, Rodrigues et al. 2008). The characterization of plant genotypes by PCR-based DNA markers provides reliable data, for being free of the influence of environmental factors, unlike other methods.
In view of the importance of deepening the understanding on the genetic diversity and population structure of soybean for breeding programs, this study assessed the genetic diversity and population structure of 77 soybean cultivars representative of the genetic resource in Brazil and routinely used in agriculture and research.
MATERIAL AND METHODS
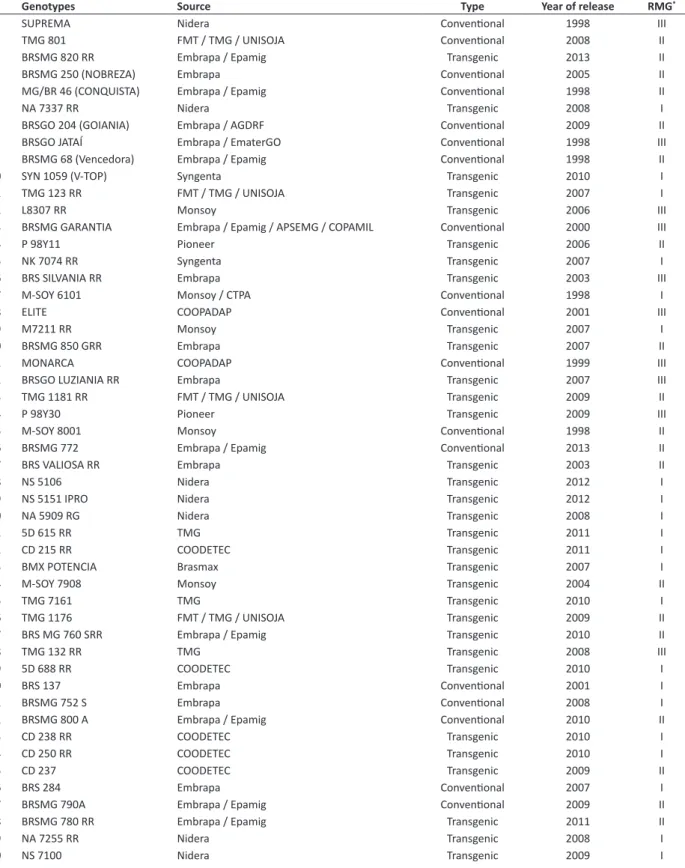
Seventy-seven soybean genotypes, which represent different maturity groups released in Brazil and are part of the breeding program of the Federal University of Lavras (UFLA) were included in this study. The list of the 77 soybean genotypes and their description is shown in Table 1.
The study was carried out in the Laboratory of Molecular Genetics of the Department of Biology (DBI), UFLA. The DNA extraction was performed as described by Pereira et al. (2007). After DNA samples of each genotype were extracted, the genomic DNA was quantified using a NanoVue GE spectrophotometer andstandardized to 30 ng μL-1 for SSR
genotyping. A total of 35 SSR primers were used in this study. The SSR genotyping was realized using the PCR reaction mixture composed of 5.7 µL Milli-Q water, 3 µL 5X buffer (Green GoTaq®Flexi Buffer - Promega), 2 µL MgCl
2 (Promega),
100 µM of each deoxyribonucleotide (dATP, dGTP, dCTP, and dTTP), 0.3 µL Taq (5 U µL-1), and 3 µL of each primer pair.
Amplifications were performed in Eppendorf Mastercycler® Thermal Cyclers, using the following program: an initial denaturation step at 95 °C for 2 min, followed by 32 cycles at 94 °C for 30 sec each for DNA denaturation, 50 sec for primer annealing at 55 ºC, 40 sec for extension at 72 °C, followed by a final extension at 72 °C for 4 min.
The reaction products were maintained at 4°C and electrophoresed on polyacrylamide gel 6% in TBE buffer (0.045 M Tris- borate and 0.001 M EDTA), at 240V for 1 h 15 min. The gel was immersed in a silver nitrate solution (0.2% AgNO3) for 10 min, washed with water and slowly stirred in a NaOH solution (3% NaOH, 0.5% formaldehyde) until clear visualization, and photographed with a digital camera.
The DNA fragments were codified as presence/absence to form the allelic matrix for each SSR primer.
Data analyses
To study the genetic diversity and population structure, the soybean genotypes were clustered according to their maturity group and variety development method (transgenic or conventional). The relative maturity group (RMG) was determined according to the macroregional classification in the state of Minas Gerais, Brazil (Macro Region 3) where: RMG I (RMG< 7.6); RMG II (7.6 < RMG < 8.2) and RMG III (RMG > 8.2).
The genetic distance of Slatkin (Slatkin 1995) among the soybean genotypes was estimated using software PowerMarker V3.25 (Liu and Muse 2005). Furthermore, the Nei diversity index (Nei 1973), Shannon-Weaver index and percentage of polymorphic loci (P%) were estimated with software Popgene V1.32 (Yeh and Boyle 1997). The Jaccard similarity coefficient was estimated using R statistical environment (R Development Core Team 2014), and used to plot a UPGMA dendrogram with software Mega (Tamura et al. 2007). Analysis of molecular variance (AMOVA) was performed using software GenAlEx 6.501 (Peakall and Smouse 2006).
Table 1. Name, source, maturity group, type and year of release of the evaluated soybean genotypes in this study, *RMG – Relative Maturity Group
# Genotypes Source Type Year of release RMG*
1 SUPREMA Nidera Conventional 1998 III
2 TMG 801 FMT / TMG / UNISOJA Conventional 2008 II
3 BRSMG 820 RR Embrapa / Epamig Transgenic 2013 II
4 BRSMG 250 (NOBREZA) Embrapa Conventional 2005 II
5 MG/BR 46 (CONQUISTA) Embrapa / Epamig Conventional 1998 II
6 NA 7337 RR Nidera Transgenic 2008 I
7 BRSGO 204 (GOIANIA) Embrapa / AGDRF Conventional 2009 II
8 BRSGO JATAÍ Embrapa / EmaterGO Conventional 1998 III
9 BRSMG 68 (Vencedora) Embrapa / Epamig Conventional 1998 II
10 SYN 1059 (V-TOP) Syngenta Transgenic 2010 I
11 TMG 123 RR FMT / TMG / UNISOJA Transgenic 2007 I
12 L8307 RR Monsoy Transgenic 2006 III
13 BRSMG GARANTIA Embrapa / Epamig / APSEMG / COPAMIL Conventional 2000 III
14 P 98Y11 Pioneer Transgenic 2006 II
15 NK 7074 RR Syngenta Transgenic 2007 I
16 BRS SILVANIA RR Embrapa Transgenic 2003 III
17 M-SOY 6101 Monsoy / CTPA Conventional 1998 I
18 ELITE COOPADAP Conventional 2001 III
19 M7211 RR Monsoy Transgenic 2007 I
20 BRSMG 850 GRR Embrapa Transgenic 2007 II
21 MONARCA COOPADAP Conventional 1999 III
22 BRSGO LUZIANIA RR Embrapa Transgenic 2007 III
23 TMG 1181 RR FMT / TMG / UNISOJA Transgenic 2009 II
24 P 98Y30 Pioneer Transgenic 2009 III
25 M-SOY 8001 Monsoy Conventional 1998 II
26 BRSMG 772 Embrapa / Epamig Conventional 2013 II
27 BRS VALIOSA RR Embrapa Transgenic 2003 II
28 NS 5106 Nidera Transgenic 2012 I
29 NS 5151 IPRO Nidera Transgenic 2012 I
30 NA 5909 RG Nidera Transgenic 2008 I
31 5D 615 RR TMG Transgenic 2011 I
32 CD 215 RR COODETEC Transgenic 2011 I
33 BMX POTENCIA Brasmax Transgenic 2007 I
34 M-SOY 7908 Monsoy Transgenic 2004 II
35 TMG 7161 TMG Transgenic 2010 I
36 TMG 1176 FMT / TMG / UNISOJA Transgenic 2009 II
37 BRS MG 760 SRR Embrapa / Epamig Transgenic 2010 II
38 TMG 132 RR TMG Transgenic 2008 III
39 5D 688 RR COODETEC Transgenic 2010 I
40 BRS 137 Embrapa Conventional 2001 I
41 BRSMG 752 S Embrapa Conventional 2008 I
42 BRSMG 800 A Embrapa / Epamig Conventional 2010 II
43 CD 238 RR COODETEC Transgenic 2010 I
44 CD 250 RR COODETEC Transgenic 2010 I
45 CD 237 COODETEC Transgenic 2009 II
46 BRS 284 Embrapa Conventional 2007 I
47 BRSMG 790A Embrapa / Epamig Conventional 2009 II
48 BRSMG 780 RR Embrapa / Epamig Transgenic 2011 II
49 NA 7255 RR Nidera Transgenic 2008 I
RESULTS AND DISCUSSION
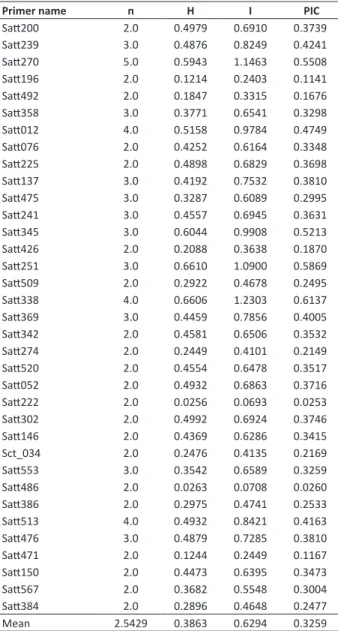
Of the analyzed primers, the lowest value for both genetic diversity indices was found for primer Satt222, and the highest Nei’s genetic diversity index for primer Satt251 (Table 2). Primer Satt338 reached the highest Shannon index. The mean values for the genetic diversity indices were 0.3863 for Nei’s index and 0.6294 for the Shannon index. The highest number of polymorphic alleles was observed at locus Satt270. However, 21 loci had only 2 polymorphic alleles (Table 2).
The polymorphic information content (PIC) was determined for each marker (Table 2), and the mean value was 0.3259. The highest PIC (0.6137) was observed for primer Satt338 and the lowest for Satt222 (0.0253).
A comparison of the soybean varieties obtained by transgenic and conventional breeding indicated slightly higher genetic diversity indices for the varieties derived from conventional breeding (Table 2). The transgenic cultivars had 100% and the conventional group 88.57% polymorphic loci.
Except for RMG III, the number of alleles was similar for all subsets. Subset RMG II had the highest and the RMG I the lowest index for both genetic diversity indices. Moreover, these two contained the highest PIC. For subset RMG III, the smallest number of polymorphic alleles and lowestShannon diversity index were found (Table 3).
For the transgenic and conventional subsets, AMOVA showed that 99% of the total variation was partitioned within the subsets and the remaining 1% among subsets. Similarly, for the maturity groups, 94% of the total variation was partitioned within and 1% among the groups (Table 3).
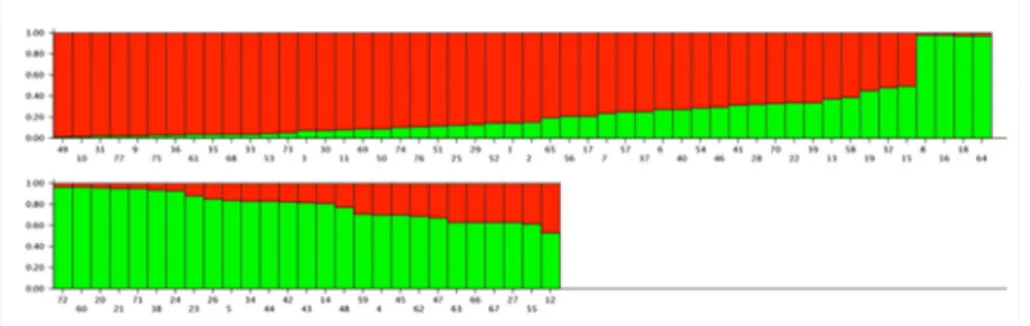
The Bayesian model-based clustering analysis clustered the 77 genotypes in two principal groups (K=2). The first group (red) consisted of mostly short-season or early cultivars, while the second group (green) of mostly long-season or late cultivars. There is certain degree of admixture represented mostly by genotypes with medium cycle, but also by RMG I and III (Figure 1). The formation of only two groups indicated low genetic diversity among the assessed soybean genotypes.
51 CD 202 RR COODETEC Transgenic 2011 I
52 NS 7114 Nidera Transgenic 2012 I
53 5D 711 RR COODETEC Transgenic 2010 I
54 NK 7059 (V-MAX RR) Syngenta Transgenic 2007 I
55 EMGOPA 316 EMATER-GO Transgenic 2007 II
56 IAC 19 IAC Conventional 1998 I
57 TMG 1174 RR FMT / TMG / UNISOJA Transgenic 2011 I
58 TMG 1179 RR FMT / TMG / UNISOJA Transgenic 2009 II
59 TMG 401 FMT / TMG / UNISOJA Conventional 2007 II
60 BRSMG 810 C Embrapa / Epamig Conventional 2007 II
61 TMG 7262 TMG Transgenic 2011 I
62 BRS 255 RR Embrapa Transgenic 2005 I
63 M 9144 RR Monsoy Transgenic 2004 III
64 DM 118 Pioneer Conventional 1998 II
65 5D 690 RR COODETEC Transgenic 2010 I
66 5G 770 RR COODETEC Transgenic 2010 II
67 BRS FAVORITA RR Embrapa Transgenic 2005 II
68 BMX FORÇA RR GDM Transgenic 2008 I
69 NS 7200 Nidera Transgenic 2011 I
70 TMG 127 RR UNISOJA / FMT Transgenic 2007 I
71 MONSOY 8000 RR Monsoy Transgenic 2004 II
72 CAC 1 COOPADAP Conventional 1998 I
73 CD 2737 RR COODETEC Transgenic 2012 I
74 CD 2630 RR COODETEC Transgenic 2011 I
75 BRSMG 750 SRR Embrapa / Epamig Transgenic 2007 I
76 NA 7620 RR Nidera Transgenic 2008 II
Low genetic diversity was observed among the soybean genotypes and in all subsets analyzed in this study. The genetic diversity indices estimated in this study can be considered low when compared to results previously described for this species. In 100 vegetable soybean cultivars, Dong et al. (2014) analyzed the genetic diversity and reported a mean Nei index of 0.6286. In an analysis of the genetic diversity of 10 landrace populations in China, Wang et al. (2014) found a Shannon-Weaver index of 2.038. The high Shannon-Weaver indices observed by the authors in these two studies may be explained by the kind of genotypes used (vegetable and landrace). The selection pressure on vegetable soybean was lower than on the grain-type. Moreover, landrace genotypes are closer relatives of the wild genotypes (G. soja), which naturally have a high level of genetic diversity. Most genotypes included in this study are improved soybean genotypes subjected to a rather high selection pressure.
Low diversity in a germplasm is particularly alarming when we consider the vulnerability of agriculture under the impact of changes in climate patterns. The development of genotypes with better performance at high temperatures, high CO2 concentration, and under water and salt stress has become a challenge that must be met with a certain urgency due to the ongoing climate changes (Ceccarelli et al. 2010). However, facing these challenges and developing soybean cultivars with the desirable traits requires a diversification of the genetic background of the current breeding population by incorporating new genetic backgrounds from other countries.
The genetic base of Brazilian soybean germplasm is known to be narrow (Wysmierski and Vello 2013, Miranda et al. 2001). The frequent use of a small set of genotypes in the breeding process could be considered a key factor for the loss of genetic diversity. Most of the Brazilian soybean germplasm is derived from four genotypes (CNS, S-100, Roanoke and Tokyo), which contribute with more than half of the genetic base to the cultivars released in Brazil.
Table 2. Microsatellite loci, number of alleles (n), Nei’s genetic
diversity index (H), Shannon-Weaver index (I) and Polymorphic Information Content (PIC)
Primer name n H I PIC
Satt200 2.0 0.4979 0.6910 0.3739
Satt239 3.0 0.4876 0.8249 0.4241
Satt270 5.0 0.5943 1.1463 0.5508
Satt196 2.0 0.1214 0.2403 0.1141
Satt492 2.0 0.1847 0.3315 0.1676
Satt358 3.0 0.3771 0.6541 0.3298
Satt012 4.0 0.5158 0.9784 0.4749
Satt076 2.0 0.4252 0.6164 0.3348
Satt225 2.0 0.4898 0.6829 0.3698
Satt137 3.0 0.4192 0.7532 0.3810
Satt475 3.0 0.3287 0.6089 0.2995
Satt241 3.0 0.4557 0.6945 0.3631
Satt345 3.0 0.6044 0.9908 0.5213
Satt426 2.0 0.2088 0.3638 0.1870
Satt251 3.0 0.6610 1.0900 0.5869
Satt509 2.0 0.2922 0.4678 0.2495
Satt338 4.0 0.6606 1.2303 0.6137
Satt369 3.0 0.4459 0.7856 0.4005
Satt342 2.0 0.4581 0.6506 0.3532
Satt274 2.0 0.2449 0.4101 0.2149
Satt520 2.0 0.4554 0.6478 0.3517
Satt052 2.0 0.4932 0.6863 0.3716
Satt222 2.0 0.0256 0.0693 0.0253
Satt302 2.0 0.4992 0.6924 0.3746
Satt146 2.0 0.4369 0.6286 0.3415
Sct_034 2.0 0.2476 0.4135 0.2169
Satt553 3.0 0.3542 0.6589 0.3259
Satt486 2.0 0.0263 0.0708 0.0260
Satt386 2.0 0.2975 0.4741 0.2533
Satt513 4.0 0.4932 0.8421 0.4163
Satt476 3.0 0.4879 0.7285 0.3810
Satt471 2.0 0.1244 0.2449 0.1167
Satt150 2.0 0.4473 0.6395 0.3473
Satt567 2.0 0.3682 0.5548 0.3004
Satt384 2.0 0.2896 0.4648 0.2477
Mean 2.5429 0.3863 0.6294 0.3259
Table 3. Evaluated soybean subsets (Subsets), number of genotypes per subset (#), mean of observed alleles (n), Shannon-Weaver
diversity index (I), Nei diversity index (H), polymorphism percentage (PP)
AMOVA
Subsets # n I H PP(%) Among (%) Within (%)
Conventional 23 2.4 0.6198 0.3817 88.57
1 99
Transgenic 54 2.4857 0.6102 0.3761 100
RMG I 38 2.4286 0.5611 0.3426 97.14
6 94
RMG II 28 2.4571 0.6230 0.3823 97.14
RMG III 11 2.0571 0.5532 0.3583 80
If we consider the 14 soybean genotypes used in the breeding program, their contribution to the genetic base can reach up to 92.4% (Wysmierski and Vello 2013). This conclusion is supported by the result of this study, where 77 soybean cultivars clustered into only two groups, with a high fixation index in each cluster. In summary, the soybean genetic base used in the breeding program of Brazil was constructed from a small number of genotypes. Our data confirmed this pattern and reinforced the results described by Wysmierski and Vello (2013). In addition, the methods of soybean breeding contribute to aggravate the genetic bottleneck, since backcrossing is a routinely applied method to introduce qualitative traits into an elite cultivar, particularly in the case of transgenic lines. The genetic diversity indices of the subset of transgenic cultivars in this study were lower than those of traditional genotypes, despite the higher number of genotypes included in this group (Table 3).
The development of transgenic cultivars by backcrossing can lead to a reduction in the genetic richness since a low number of recurrent parents and a few donor parents carrying the transgenic segment are used in the process. Furthermore, the small number of transformed lines reduces the range of genetic variation available for selection by the plant breeder (Sneller 2003).
Considering the rising demand for transgenic and early cultivars in the seed market, we can assume that the man-made genetic bottleneck is currently still an ongoing process that should be mitigated. The concern about genetic diversity resulting in efforts to enrich the soybean genetic pool can be helpful to preserve long-term performance increments by means of plant breeding.
The result of AMOVA showed that the absence of a clear differentiation among the groups of soybean genotypes indicates a narrow genetic base of the soybean cultivars grown in Brazil (Table 3). Therefore, soybean breeders should follow a strategy of broadening the genetic base of different groups by the incorporation of new genetic bases, particularly from landraces.
Most of the soybean cultivars analyzed in this study are early genotypes (RMG I). Nowadays, early cultivars have become rather popular among Brazilian farmers who use a production system based on crop succession, with an early-maturing cultivar in the summer followed by second-season crop after a short time gap. This widely applied system is called “safrinha” or late growing season in Brazil, and aims at a maximized land use in relation to time. Thus, this production model drives the seed companies to focus on an accelerated development of early cultivars, which may be another factor squeezing the geneticbottleneck.
The lowest Nei diversity index (H=0.3426) was observed in the early group (RMG I), suggesting low genetic diversity within this group. The subset RMG III obtained the lowest Shannon-Weaver index, suggesting low diversity as well. Nevertheless, RMG III is composed of a smaller number of genotypes, which can result in an underestimation of its diversity range (Table 3).
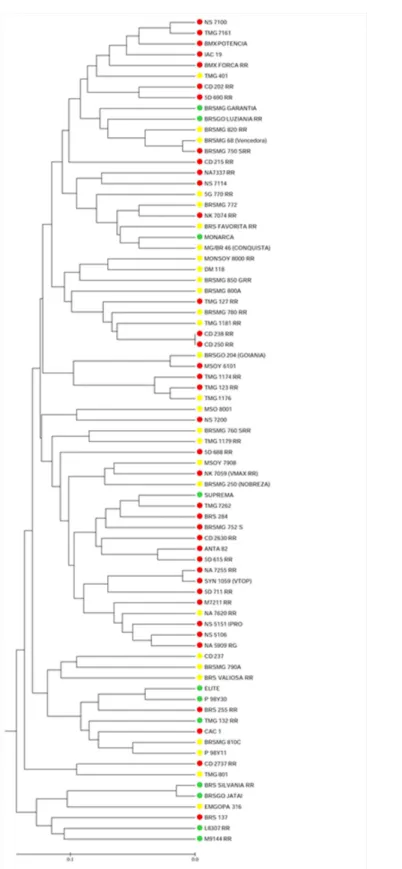
In our results, the absence of a clear clustering pattern in the dendrogram regarding relative maturity groups, and the short distance between clusters (Figure 2) suggested that the early and late cultivars may share common alleles obtained from the same parents used in the breeding process.
A pattern was observed in the population structure, where two groups were formed. The first group consisted of
Figure 1. Two subgroups inferred from STRUCTURE analysis. The vertical coordinate indicates the membership coefficients for each
Figure 2. Dendrogram based on Jaccard’s similarity coefficient, showing soybean genotypes of different maturity groups: RMG I (red),
73.9% plants from subset RMG I and the second group of 61.3% plants from subset RMG II and 25.8% from RMG III, indicating a higher allele frequency of alleles associated to early genotypes in the first group and in the second group a higher frequency of alleles associated to late genotypes (Figure 1).
In general, the result evidenced low genetic variability among soybean cultivars, reinforcing previous results. The popularization in the development and use of early transgenic cultivars should be followed by mitigating measures to alleviate the human-made bottleneck. In this context, the soybean breeding programs need to consider the genetic diversity issue as an important factor instead of focusing exclusively on yield and other agronomic traits.
In this regard, wild soybean species such as Glycine soja Seib. and Zucc. can be considered to increase genetic variation and used as an important source of alleles, despite their undomesticated characteristics (Akpertey et al. 2014). Interspecific crosses are commonly used in several crop species with the objective of introducing new alleles to overcome biotic and abiotic stress and increase the genetic diversity (Haussmann et al. 2004). Unfortunately, there is a lack of availability of this genetic material in the Brazilian germplasm (Carter et al. 2004).
Efforts for an international cooperation of sharing and exchanging soybean germplasm should be considered to avoid the surge of a genetic bottleneck in many countries of the world and to enrich the Brazilian soybean germplasm pool. In Brazil, attention must be paid to the threat of this bottleneck effect looming over the development of soybean breeding programs in the future.
An expansion of the soybean genetic base is fundamental to ensure the future progress of genetic gains by plant breeding. A more diverse genetic pool and germplasm set can facilitate the development of new varieties capable to overcome a hostile environment.
The analyzed soybean genotypes contain low genetic diversity, indicating the need to increase the variability in the genetic pool of the soybean breeding program of the Federal University of Lavras.
ACKNOWLEDGEMENTS
We would like to thank CNPq (Brazilian National Council for Scientific and Technological Development), CAPES (Brazilian Federal Agency for Support and Evaluation of Graduate Education), FAPEMIG (Minas Gerais State Foundation for Research Development), and the Federal University of Lavras for financial support.
REFERENCES
Akpertey A, Belaffif M, Graef GL, Mian R, Grover Shannon J, Cregan PB, Hudson ME, Diers BW and Nelson RL (2014) Effects of selective genetic introgression from wild soybean to soybean. Crop Science 54: 2683-2695.
Carter TE, Nelson RL, Sneller CH and Cui Z (2004) Genetic diversity in soybean. In Boerma H and Specht J (eds) Soybeans: Improvement,
production, and uses. American Society of Agronomy, Madison, p. 303-450. (Soybean monograph).
Ceccarelli S, Grando S, Maatougui M, Michael M, Slash M, Haghparast R, Rahmanian M, Taheri A, Al-Yassin A, Benbelkacem A, Labdi M, Mimoun H and Nachit M (2010) Plant breeding and climate changes. The Journal of Agricultural Science148: 627-637.
Clemente TE and Cahoon EB (2009) Soybean oil: genetic approaches for modification of functionality and total content. Plant physiology 151:1030-1040.
Dong D, Fu X, Yuan F, Chen P, Zhu S, Li B, Yang Q, Yu X and Zhu D (2014) Genetic diversity and population structure of vegetable soybean (Glycine max (L.) Merr.) in China as revealed by SSR markers. Genetic resources and crop evolution 61: 173-183.
Earl DA and von Holdt BM (2012) Structure harvester: a website and program for visualizing Structure output and implementing the Evanno method. Conservation Genetics Resources 4: 359-361. Evanno G, Regnaut S and Goudet J (2005) Detecting the number of
clusters of individuals using the software Structure: A simulation study. Molecular Ecology14: 2611-2620.
Haussmann B, Parzies H, Presterl T, Susic Z and Miedaner T (2004) Plant genetic resources in crop improvement. Plant Genetic Resources
2: 3-21.
Kaga A, Shimizu T, Watanabe S, Tsubokura Y, Katayose Y, Harada K, Vaughan DA and Tomooka N (2012) Evaluation of soybean germplasm conserved in NIAS genebank and development of mini core collections. Breeding Science 61: 566-592.
Liu K and Muse SV (2005) PowerMarker: an integrated analysis environment for genetic marker analysis. Bioinformatics21:
2128-2129.
Miranda GV, Sediyama CS, Reis MS and Cruz CD (2001) Genetic diversity among elite Brazilian soybean cultivars with narrow genetic base.
Mohammadi SA and Prasanna BM (2003) Analysis of genetic diversity in crop plants—salient statistical tools and considerations. Crop Science43: 1235-1248.
Nei M (1973) Analysis of gene diversity in subdivided populations. Proceedings of the National Academy of Sciences70: 3321-3323.
Peakall R and Smouse PE (2006) Genalex 6: genetic analysis in Excel. Population genetic software for teaching and research. Molecular Ecology Notes6: 288-295.
Pereira HS, Santos JD, Abreu ADF and Couto KR (2007) Informações fenotípicas e marcadores microssatélites de QTL na escolha de populações segregantes de feijoeiro. Pesquisa Agropecuária Brasileira 42: 707-713.
Phalan B, Bertzky M, Butchart SH, Donald PF, Scharlemann JP, Stattersfield AJ and Balmford A (2013) Crop expansion and conservation priorities in tropical countries. PloS one 8: e51759.
Pritchard JK, Stephens M and Donnelly P (2000) Inference of population structure using multilocus genotype data. Genetics155: 945-959.
R Core Team (2014) R: A language and environment for statistical computing. R Foundation for Statistical Computing, Vienna. Available at <http://www.R-project.org>. Accessed on February 2, 2015. Ray DK, Ramankutty N, Mueller ND, West PC and Foley JA (2012)
Recent patterns of crop yield growth and stagnation. Nature
Communications3:1293.
Rodrigues DH, Alcântara Neto F and Schuster I (2008) Identification of essentially derived soybean cultivars using microsatellite markers.
Crop Breeding and Applied Technology8: 74-78.
Sediyama CS, Carneiro JEDS, Fritsche-Neto R, Sediyama T, Barbosa MHP, Galvão JCC and Souza MAD (2012) Contribution of the universities to the development of field crop cultivars. Crop Breeding and Applied Biotechnology12: 121-130.
Slatkin M (1995) A measure of population subdivision based on microsatellite allele frequencies. Genetics139: 457-462.
Smith JSC, Diers BW, Specht JE and Carver BF (2014) Yield gains in major
US field crops. Crop Science Society of America. ASA, CSSA, and SSSA, Madison, 488p.
Smith S, Bubeck D, Nelson B, Stanek J and Gerke J (2015) Genetic diversity and modern plant breeding. In Ahuja MR and Jain SM (eds) Genetic
diversity and erosion in plants. Springer International Publishing,
Switzerland, p. 55-88.
Sneller CH (2003) Impact of transgenic genotypes and subdivision on diversity within elite North American soybean germplasm. Crop Science43: 409-414.
Tamura K, Dudley J, Nei M and Kumar S (2007) Mega4: molecular evolutionary genetics analysis (MEGA) software version 4.0. Molecular
Biology and Evolution24: 1596-1599.
USDA - United States Department of Agriculture (2017) World agricultural supply and demand estimates: WASDE – 562. Avaliable at <https:// www.usda.gov/oce/commodity/wasde/latest.pdf>. Accessed on August 10, 2017.
Wang KJ, Li XH and Yan MF (2014) Microsatellite markers reveal genetic diversity of wild soybean in different habitats and implications for conservation strategies (Glycine soja) in China. Conservation genetics
15: 605-618.
Wysmierski PT and Vello NA (2013) The genetic base of Brazilian soybean cultivars: evolution over time and breeding implications. Genetics
and Molecular Biology36: 547-555.