Objective: To describe the socioeconomic and nutritional characteristics of children and adolescents with sickle cell anemia.
Data sources: The present study is a systematic literature review based on published scientific articles. The searches were carried out using the electronic database of the National Library of Medicine, National Institutes of Health – PubMed. Two searches of articles published in the last 20 years and without limitation of language were carried out. The first one started from the Medical Subject Headings term “Anemia, Sickle Cell” associated with “Socioeconomic Factors”; and the second started from the term “Anemia, Sickle Cell” associated with “Anthropometry”. The searches were directed to research conducted on humans in the age group from 0 to 18 years.
Data synthesis: The final selection was composed by 11 articles on socioeconomic characteristics and 21 articles on nutritional characteristics. All studies included children and adolescents with sickle cells disease (age range 0‑18 years), both genders, and most of them of black ethnicity. Families of children and adolescents with sickle cell anemia were of predominantly low socioeconomic status. Parents had lower educational levels when compared to parents of healthy children and adolescents. Body measurements (weight and height) and anthropometric indicators of children with sickle cell anemia were often lower when compared to healthy groups or reference populations.
Conclusions: Children and adolescents with sickle cell anemia have socioeconomic limitations and worse nutritional conditions, when compared to reference populations. These limitations may lead to worse growth and greater occurrence of possible complications that can impair their quality of life.
Keywords: Sickle cell anemia; Child; Adolescent; Social class; Anthropometry.
Objetivo: Descrever as características socioeconômicas e nutricionais de crianças e adolescentes com anemia falciforme.
Fonte de dados: Estudo de revisão sistemática da literatura baseado em artigos publicados em revistas científicas. As buscas foram realizadas na base de dados eletrônica da National Library of Medicine, National Institutes of Health – PubMed. Foram realizadas duas buscas de artigos publicados nos últimos 20 anos e sem limitação de idioma. A primeira partiu do Descritor em Ciências da Saúde “Anemia Falciforme” associado com “Fatores Socioeconômicos”; e a segunda partiu do descritor “Anemia Falciforme” associado com “Antropometria”. As buscas foram direcionadas para pesquisas realizadas em seres humanos na faixa etária de 0 a 18 anos.
Síntese dos dados: A seleção final foi composta por 11 artigos referentes às características socioeconômicas e 21 referentes às características nutricionais. As amostras estudadas foram de crianças e adolescentes de ambos os sexos, com idade de 0 a 18 anos e com predomínio de populações negras. Famílias de crianças e adolescentes com anemia falciforme eram predominantemente de baixo nível socioeconômico. Os pais apresentaram níveis educacionais inferiores, quando comparados a pais de crianças e adolescentes saudáveis. As medidas corporais (peso e estatura) e os indicadores antropométricos de crianças com anemia falciforme foram frequentemente menores, quando comparados com os dos grupos saudáveis ou das populações de referência.
Conclusão: Crianças e adolescentes com anemia falciforme apresentam limitações socioeconômicas e piores condições nutricionais, quando comparados às populações de referência. Essas limitações podem implicar pior crescimento e maior ocorrência de possíveis complicações, que podem prejudicar sua qualidade de vida. Palavras‑chave: Anemia falciforme; Criança; Adolescente; Classe social; Antropometria.
ABSTRACT
RESUMO
*Corresponding author. E‑mail: [email protected] (T. Konstantyner).
aDepartment of Pediatrics, Universidade Federal de São Paulo, São Paulo, SP, Brazil.
Received on May 30, 2017; approved on September 22, 2017; available online on November 27, 2018.
SOCIOECONOMIC AND NUTRITIONAL
CHARACTERISTICS OF CHILDREN AND ADOLESCENTS
WITH SICKLE CELL ANEMIA: A SYSTEMATIC REVIEW
Características socioeconômicas e nutricionais de crianças
e adolescentes com anemia falciforme: uma revisão sistemática
Amanda Cristina da Silva de Jesus
a, Tulio Konstantyner
a,*,
Children and adolescents with sickle cell anemia
492
Rev Paul Pediatr. 2018;36(4):491‑499
INTRODUCTION
Sickle cell disease (SCD) occurs due to a genetic muta‑ tion — replacement of the nitrogen base thymine with adenine, which results in the substitution of glutamic acid with valine at the sixth position of the β chain on the short arm of chromosome 11. This change leads to formation of structurally abnormal hemoglobin, called hemoglobin S (HbS), and, consequently, deformation and stiffening of the red cell membrane.
In Brazil, an estimated 3,000 children are born with SCD annually. The term “sickle cell anemia” (SCA) is used for its form of homozygotes SS, being characterized as one of the most common hereditary diseases in different populations.1‑3 SCD is considered a public health problem with a high prev‑ alence among people of black ethnicity, who in many cases make up the poorest groups in society, live in peripheral regions of large urban centers and have less access to health and education.4,5
In most cases, clinical manifestations of SCA begin in early childhood with significant nutritional and psychosocial impact.2 The growth and development patterns present differ‑ ences in children and adolescents with and without SCA in all age groups. Often, the weight and height of children and ado‑ lescents with SCA are lower when compared to children and adolescents without the disease. These differences have been associated with higher total energy expenditure, lower circu‑ lating hemoglobin levels, and higher frequency of hospitaliza‑ tions of patients with SCA.2,3,6
As in other chronic diseases, low socioeconomic and edu‑ cational levels directly affect the quality of life of these children and adolescents with SCA. These characteristics are associated with a worse prognosis, since its impact is multifactorial and directly interferes with nutrition and health care.3,7,8
The difficulty of parents and children with SCA in dealing with the need imposed by the consequences of the disease, such as repetitive infections, pain, blood transfusions and frequent hospitalizations, which result in absenteeism and lower school performance, highlights the importance of ensuring adequate nutritional support and the existence of minimum socioeconomic conditions for clinical and family management. However, there is still a lack of studies that broadly describe the socioeconomic (SC) and nutritional (NC) characteristics of children and adolescents with SCA.4,9
In this context, this study aimed to describe the SC and NC of children and adolescents with SCA in different popula‑ tions, offering a broad epidemiological scenario to contribute to the elaboration and execution of management and control strategies for the clinical consequences of the disease.
METHOD
The present study is a systematic literature review based on articles published in scientific journals. The searches were conducted in the electronic database of the National Center for Biotechnology Information Advances Science and Health – National Library of Medicine – National Institutes of Health – PubMed,10 in March 24th 2017.
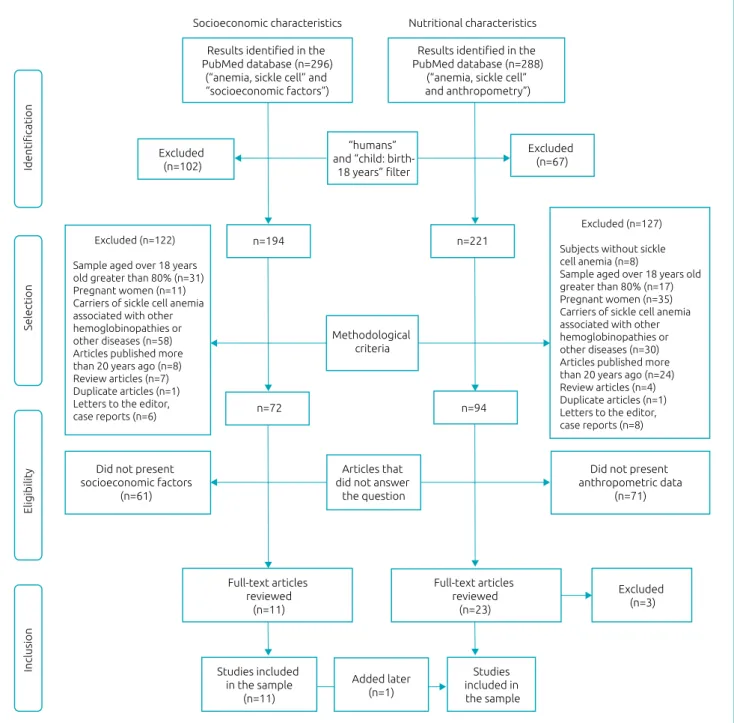
Two searches were carried out to meet the proposed objec‑ tives without limitation of language. The health descriptors were chosen by consulting Medical Subject Headings (MesH). The search for SC came from the descriptor “anemia, sickle cell” associated (and) with “socioeconomic factors”, which resulted in 296 articles. The search for NC was based on the descrip‑ tor “anemia, sickle cell” associated (and) with “anthropometry”, which resulted in 288 articles. In both searches, filters were added for research done on humans (humans) and on children and adolescents (child: birth 18 years).
After applying the filters, the search for SC resulted in 194 articles, and that for NC resulted in 221 articles. These articles were evaluated for their methodological characteris‑ tics, excluding those which studied subjects without SCA, studies conducted predominantly with adults (sample of individuals aged over 18 years greater than 80%), studies with samples composed of pregnant women or patients with SCA associated with other hemoglobinopathies or other dis‑ eases, articles published over than 20 years ago, review arti‑ cles, duplicate articles, letters to the editor, and case reports. Thus, 72 articles on SC and 94 on NC remained. Given the changes in disease control related to better resources for early diagnosis and targeted care, articles published over than 20 years ago were excluded, as it was considered that the results possibly found would not reflect the nutritional and social reality of children and adolescents with SCA receiving care in today’s world.
The abstracts of these articles were read independently by two researchers, who excluded those who did not present information to answer the research questions (socioeconomic factors and anthropometric data with a sample of children and adolescents with SCA).
After this stage, the researchers gathered in a panel for dis‑ cussing the eligibility criteria, observing agreements and dis‑ agreements in the choices. Thus, agreeing options on inclusion or exclusion were maintained, and disagreements were re‑eval‑ uated together in the presence of a third investigator, resulting in 11 articles from the search for SC and 23 for NC.
At the same time, the NCs found were weight (W), height (H), absolute body mass index (BMI) and anthro‑ pometric indicators of weight/age (W/A), weight/height (W/H), height/age (H/A) and body mass index/age (BMI/A). The population reference standards considered were: World Health Organization (WHO),11 Centers for Disease Control and Prevention (CDC)12 and National Center for Health Statistics (NCHS).13 In addition, healthy control group stud‑ ies were also included.
Subsequently, 3 of the 23 articles selected in the NC group were excluded because they did not present consistent informa‑ tion on the nutritional status of the children and adolescents studied. In addition, an article from the SC search that went through this stage also contained nutritional information, and was therefore included in the NC search.
Finally, 11 articles on SC and 21 on NC were selected and analyzed in the present study. The selection process of the arti‑ cles is presented in Figure 1.
Figure 1 Selection process of studies on socioeconomic and nutritional characteristics of children and adolescents
with sickle cell anemia (aged 0 to 18 years), 1996 to 2017.
Results identified in the
PubMed database (n=296) (“anemia, sickle cell” and “socioeconomic factors”)
Excluded (n=102)
Results identified in the
PubMed database (n=288) (“anemia, sickle cell”
and anthropometry”)
“humans” and “child: birth‑
18 years” filter
Excluded (n=67)
n=194 n=221
n=72 n=94
Methodological
criteria
Articles that
did not answer
the question
Full‑text articles
reviewed (n=11)
Full‑text articles
reviewed (n=23)
Excluded (n=3)
Studies included
in the sample
(n=11)
Added later (n=1)
Studies included in
the sample
Did not present anthropometric data
(n=71)
Did not present
socioeconomic factors (n=61)
Excluded (n=122)
Sample aged over 18 years old greater than 80% (n=31) Pregnant women (n=11)
Carriers of sickle cell anemia
associated with other hemoglobinopathies or other diseases (n=58) Articles published more than 20 years ago (n=8)
Review articles (n=7)
Duplicate articles (n=1) Letters to the editor,
case reports (n=6)
Excluded (n=127)
Subjects without sickle
cell anemia (n=8)
Sample aged over 18 years old greater than 80% (n=17) Pregnant women (n=35)
Carriers of sickle cell anemia
associated with other hemoglobinopathies or other diseases (n=30) Articles published more than 20 years ago (n=24)
Review articles (n=4)
Duplicate articles (n=1) Letters to the editor,
case reports (n=8)
Identification
Selection
Eligibility
Inclusion
Children and adolescents with sickle cell anemia
494
Rev Paul Pediatr. 2018;36(4):491‑499
RESULTS
The methodology used to search for information resulted in the selection of 11 articles referring to SC and 21 referring to NC, most of which were carried out in clinics and hospitals from reference centers and in universities in cities of the United States and Nigeria. The samples studied were children and ado‑ lescents with SCA of both sexes, aged between 0 and 18 years and with predominance of black populations.
In all studies, interviews were conducted with parents or guardians. The SCs were evaluated by the parents’ schooling and their occupations, the family income and the application of specific indexes and classifications. On the other hand, NCs were evaluated by W, H, and anthropometric indices, com‑ pared with the study’s own control groups or with population reference standards (Tables 1 and 2).
In the studies that presented the SCs, the children and ado‑ lescents with SCA belonged to families with socioeconomic conditions between middle and low level, and most of the parents had some type of schooling, predominating between primary and secondary education. Although the SCs of the group of children and adolescents with SCA presented lower levels, only one study compared them with the control group, showing, in a significant way, that children with SCA belonged to families of lower income and with greater need of use of the public health care network (Table 1).
In relation to NCs, the measurements and the anthropo‑ metric indexes of children and adolescents with SCA showed statistically significant lower values for the control and/or ref‑ erence populations in 5 of the 21 selected studies (Table 2).
DISCUSSION
The results show that children and adolescents with SCA pre‑ dominantly belong to families from the less favored socioeco‑ nomic classes, whose parents have greater difficulty to achieve higher educational levels when compared to parents of healthy children and adolescents.
Socioeconomic status is a factor that directly affects treat‑ ment and access to health care. Adherence and attendance to follow‑up visits are often affected by the low family income, especially by the distance between the home and the special‑ ized services facilities. This phenomenon is aggravated when it comes to patients with chronic disease in a situation of depen‑ dence, as is the case of children with SCA.19
Because it is a hereditary disease, descended from sub‑Sa‑ haran African populations,5 SCA is embedded in a context of social inequality in the world. The selected studies, for the most part, were performed in samples exclusively composed or with a large percentage of black population.
According to the Brazilian Institute of Geography and Statistics (IBGE),45 the majority of the Brazilian population (53.9%) declared to be of black or brown color/race, and this characteristic is higher in the age group from 10 to 19 years (values greater than 58.0% in both sexes). In addition, data show that, in relation to food unsafety (mild, moderate and severe), black children are the most exposed to this nutritional risk (43.1%). Access to basic sanitation services (water supply by general network, sanitary sewage by collecting or rainwa‑ ter network, and direct or indirect garbage collection) is also lower in the black population, with only 55.3% of households in this group presenting this characteristic, different from the white population (71.9%).
Historically, the black population became enslaved in Brazil and, even after the abolition of slavery, their descendants had few opportunities for social and economic entry into the coun‑ try. An improvement can be observed in the living conditions of black populations in Brazil, but this socioeconomic struc‑ tural problem remains today.46
The sum of these problems implies worse socioeconomic situations. An example of this is the low level of education of children’s guardians, which makes it difficult to get a formal job. Thus, families are more inclined to work with informal and uncertain services, without the security of a monthly income.47 This aspect is also reflected in the schooling of children with SCA from families with low socioeconomic status, who have lower school performance, with little possibility of access to reinforcement activities or other type of support that contrib‑ utes to performance improvement.16
Thus, children with SCA, which predominantly comprise the black population by the disease’s inheritance character‑ istic, are more likely to live in worse socioeconomic con‑ ditions. In this sense, it seems plausible that the Brazilian data can be extrapolated to countries with similar ethnic characteristics, which present different degrees of misce‑ genation, but which predominantly have the worse living conditions among the black population, when compared to the white population.
At the same time, it was possible to identify in the articles selected in the present review that the body measurements (W and H) and the anthropometric indicators of children with SCA were often lower when compared with reference popu‑ lations (WHO, CDC and NCHS) and with control groups consisting of children and adolescents.
Je
sus A
C
S
et
al.
495
Rev P
aul P
ediatr
. 2018;36(4):491‑499
T: transversal; CC: case-control; Co: cohort; y: years; SS: children with sickle cell anemia; AA: healthy children; SC: socioeconomic condition; SL: socioeconomic level; BMW: Brazilian minimum
wage; : average; FI: Family income; NHIS: National Health Interview Survey ; I: illiterate; L: literate (out of school); IPE: incomplete primary education; CPE: complete primary education; ISE:
incomplete secondary education; CSE: complete secondary education; HE: higher education; ND: not declared; FPI: federal poverty index; Medicait/SCHIP: health care program for families with lower income in the USA; CSI: Community Stress Index (poverty, schooling, ≥ 16 years of age who cannot work, ≥ 16 years of age who are unemployed and income — scoring ranges from
1 to 18 points; stress levels are high ≥ 14, average from 9 to 13 and low from 0 to 8); †measured by the number and types of household appliances, water source and type of sanitation (scale
Author (year)
Methodology
Results Design Sample
Place (city/state/
county)
Evaluation criteria*
Fernandes
et al. (2015)14 T
n=106 (45 ♀/61 ♂)
8-14 y
Minas Gerais, Brazil
Parental schooling
(≤8 years of schooling) annual FI (in thousands of USD)
by age group and home ownership
Maternal schooling (74.2%); paternal schooling (75.4%) Annual FI:8‑10 (7.0); 11‑14 (17.5%)
Home ownership:No (68.5%)
King et al.
(2014)15 T
n=107 SS/43 AA
5-15 y USA
Schooling of the head of the family
and annual FI (in thousands of USD)
Some schooling or more: SS (57.0%); AA (60.5%) Annual FI:SS (8.4); AA (11.0)
Ezenwosu
et al. (2013)16 CC
n=90 SS/90 AA (35
♀/55 ♂) 5‑11 y Enugu, Nigeria SC (parental/guardians’ occupation and schooling) AA SC: high (23.3%); average (27.8%); low (48.6%)SS SC: high (30%); average (23.3%); low (46.7%)
Akodu et al.
(2012)17 T
n=80 SS/80 AA
2-15 y Lagos, Nigeria SL and socioeconomic stratum
SS SL: I‑II (36.3%); III‑IV (62.5%); V (1.2%) AA SL: I‑II (51.3%); III‑IV (48.7%); V (0%) SS stratum: high (36.2%); average (45%); low (18.8%) AA stratum: high (51.2%); average (38.8%); low (10%)
Luna et al.
(2012)18 T n=160; 3‑12 y
Pernambuco,
Brazil
Parents’ combined educational level and FI (BMW)
Schooling: I‑L (5%); IPE (56.3%); CPE (18.1%); CSE (18.1%); HE (2.5%) FI: <1 BMW (15%); 1‑2 BMW (76.9%);
>2 BMW (7.5%); ND (0.6%)
Boulet et al.
(2010)19 T
n=192 SS/19,335 AA
0-17 y NHIS – USA
Maternal schooling (ISE, CSE
and HE), FI (below the FPI) and insurance (health insurance –
Medicait/SCHIP)
SS schooling: ISE (28%); CSE (32.4%); HE (39.6%) AA schooling: ISE (19%); CSE (33%); HE (48%)FI<FPI: SS (47.8%);
AA (34.7%); p<0.05
Insurance: SS (56.2%); AA (39.7%); p<0.05
Brown et al.
(2010)20 T
n=67 (24 ♀/43 ♂)
0-18 y Ibadan, Nigeria Maternal schooling Maternal schooling: ≥SE (50.7%); <SE (49.3%)
Uchendu
et al. (2010)21 CC n=100 (♂); 6‑18 y Enugu, Nigeria
SC (parental/guardians’ occupation
and schooling) SC: high (19%); average (30%); low (51%) Panepinto
et al. (2009)22 T n=104; 2-18 y Wisconsin, USA FI (in thousands of USD) FI: >40 (21.2%); >20 to ≤40 (25%); ≤20 (34.6%); ND (19.2%)
Telfair et al.
(2003)23 T n=662 Alabama, USA CSI CSI: urban (11.97); rural (13.9)
Singhal et al.
(1996)24 Co
n=219 (106 ♀/113
♂) 0‑9 y
Kingston,
Childr
en and adole
scent
s
with
sickle cell anemia
496
Rev P
aul P
ediatr
. 2018;36(4):491‑499
Table 2 Nutritional characteristics of children and adolescents (aged 0 to 18 years) with sickle cell anemia, based on studies published between 1996 and 2017.
T: transversal; CC: case-control; Co: cohort; m: XXXXX; y: years; : mean; Me: median; W: weight; H: height; A: age (months); BMI: body mass index; Z: z score; SS: children with sickle cell anemia;
AA: healthy children; WHO: World Health Organization; CDC: Centers for Disease Control and Prevention; NCHS: National Center for Health Statistics; *p>0.05; 95%CI: 95% confidence interval.
Author (year) Methodology Results
Design Sample Place Evaluation criteria
Orimadegun & Onazi
(2015)25 T n=208 (76 ♀/132 ♂); 9 m‑15 y Zamfara, Nigeria
W (kg), BMI (kg/m²) and
W/H (Z<‑2) (WHO) W=9.0±7.2; BMI=14.3±2.2; W/H=24.5%
Akoduet al. (2014)26 CC n=50 SS/50 AA (50 ♀/50 ♂); 9 m‑15 y Lagos, Nigeria H (cm) H: SS 113.3/AA 115.4*
Salleset al. (2014)27 Co n=76 (non‑apneic); =9±3 y Salvador, Brazil H/A and BMI/A (Z/CDC) H/A=‑0.7 (‑1.4/‑0.1); BMI/A=‑1.0 (‑2.2/‑0.2)
Akodu et al. (2012)17 CC n=40 SS/40 AA; 2‑15 y Lagos, Nigeria BMI/A (Z‑WHO) ♀ SS ‑1.72/AA 0.03; p<0.001; ♂ SS ‑1.1/AA ‑1.01*
Animasahun et al.
(2011)28 CC n=100 SS/100 AA; 1‑10 y Lagos, Nigeria H (m), W (kg) and BMI (kg/m²)
H: SS 1.13/AA 1.25*;W: SS 18.8/AA 21.3; p<0.001 BMI: SS 14.6/AA 15.1*
Wali & Moheeb (2011)29 CC n=41 SS/50 AA (♂); 10‑14 y Muscat, Oman W (kg) and H (cm) W: SS 31.7/AA 33.6*; H: SS 142.2/AA 144.6*
Al-Saqladiet al. (2010)30 T n=102 Aden, Yemen H/A, W/A, W/H and BMI/A (Z‑WHO) ≤5y: H/A=‑2.16; W/A=‑2.17; BMI/A=‑1.21
>5y: H/A=‑2.24; W/A=‑2.68; BMI/A=‑1.84 Sadarangani et al.
(2009)31 Co n=124 (56 ♀/68 ♂); 0‑18 y Kilifi, Kenya Me H/A, W/A and W/H (Z‑NCHS) H/A=‑1.90; W/A=‑2.00; W/H=‑1.50
Fung et al. (2008)32 Co n=80 (40 ♀/40 ♂); 4‑19 y Philadelphia, USA H/A, W/A and BMI/A (Z‑WHO) ♀ H/A=‑0.1; W/A=‑0.5; BMI/A=‑0.6
♂ H/A=‑0.9; W/A=‑1.2; BMI/A=‑0.9
Koumbourlis & Lee
(2007)33 Co n=45 (25 ♀/20 ♂); 10.6±3.5 Colombia & USA
H/A, W/A and BMI/A
(percentile‑NCHS) H/A=35; W/A=40; BMI/A=45
Kwachaket al. (2007)34 Co n=97 (53 ♀/44 ♂); 1‑18 y Philadelphia, USA H/A, W/A and BMI/A (Z‑CDC) H/A=‑0.5; W/A=‑0.8; BMI/A=‑0.7
Zemel et al. (2007)35 Co n=578 (278 ♀/300 ♂); =9.1±4.7y Philadelphia, USA W/A, BMI/A (Z‑CDC) W/A=‑0.7*; BMI/A=‑0.7*
Buison et al. (2005)36 T n=90 SS/198 AA; 4‑19 y Philadelphia, USA H/A, W/A and BMI/A (Z‑CDC)
H/A: SS ‑0.46/AA 0.27;p<0.001
W/A: SS 0.80/AA 0.39;p<0.001
BMI/A: SS ‑0.77/AA 0.29;p<0.001
Barden et al. (2002)37 CC n=36 SS/30 AA; 5‑18 y Philadelphia, USA H/A, W/A (Z‑NCHS) H/A: SS ‑0.4/AA 0.5;p<0.01; W/A: SS ‑0.8/AA 0.3; p<0.01
Buchowski et al. (2002)38 CC n=37 SS/23 AA; 14‑18 y Tennessee, USA H (cm) and H (kg) ♀ H: SS 154.4/AA 163.8*; W: SS 50.8/AA 59.2*
♂ H: SS 167.0/AA 163.8*; W: SS 55.8/AA 53.1*
Oredugba et al. (2002)39 CC n=117 SS/122 AA; 10±4.7 y Lagos, Nigeria H (m) and W (kg)
<6 y H: SS 0.94/AA 0.98*; W: SS 13.8/AA 15.6* 6‑12 y H: SS 1.46/AA 1.50*; W: SS 31.0/AA 35.3* >12 y H: SS 1.64/AA 1.62*; W: SS 47.2/AA 55.1;p<0.01
Singhal et al. (2002)40 CC n=41 SS/31 AA; 3‑6 y Kingston, Jamaica H (cm), W (kg), BMI (kg/m²)
♀ H: SS 107.9/AA 109.8*; W: SS 16.6/AA 17.6* BMI: SS 14.2/AA 14.5*
♂ H: SS 105.8/AA 107.9*; W: SS 16.3/AA 17.2* BMI: SS 14.5/AA 14.7*
Cipolotti et al. (2000)41 T n=76 (42 ♀/34 ♂) Sergipe, Brazil H/A and W/A (Z‑NCHS) <15 y H/A‑W/A=NCHS*; ≥15 y H/A‑W/A <NCHS (95%CI)
Thomaset al. (2000)42 Co n=315; 0-18 y Kingston, Jamaica H/A and W/A (Z‑NCHS) ♀ H/A=‑1.4; W/A=‑1.7
♂ H/A=‑1.7; W/A=‑1.7 Kopp‑Hoolihan et al.
(1999)43 T n=8 (3 ♀/5 ♂); 11‑18 y California, USA H/A, W/A (Z‑NCHS) and BMI E/I=‑1.5; W/A=1.3; BMI/A=17.9
clinical complications to children with this disease, negatively affecting the individual’s health and nutrition, resulting in an unwanted cycle of health problems.48
In fact, there were statistically significant differences in W when children with SCA were compared to children in the con‑ trol groups. Such difference was not evidenced in the compar‑ ison of H. However, the mean H of these children was lower when compared to the population reference curves. This can be explained by the fact that the indicators adopted were devel‑ oped based on different populations, including several races, social classes and living conditions, which present higher means when compared to other less favored populations such as chil‑ dren with SCA in Nigeria and Jamaica.28
Low H and the slower growth rate of children with SCA have been associated with delayed epiphyseal fusion of long bones, due to late puberty, and the lower concentration of cir‑ culating hemoglobin. Although the end of the growth period of these children occurs somewhat later than with healthy chil‑ dren, the final H cannot compensate for the previous delay and therefore is compromised, not reaching the expected height for a healthy individual.41,49 Another review of the growth and nutritional status of children and adolescents with SCA, pub‑ lished in 2008, selected 46 studies, but with large variations in sample size and reference standards, which reduced the ability to compare them. However, as demonstrated in the present study, there was a consistent pattern of growth failure among affected children in all geographic areas, with good evidence linking growth failure to endocrine dysfunction, metabolic disorders, and specific nutrient deficiencies.50
On the other hand, recent studies have identified an increase in the prevalence of excess W in children with SCA. Such evidence may be associated with better control of the disease and the period of nutritional transition observed worldwide in the last years with the exposure of children to a large obesogenic environment. Akodu et al.,17 in a study with 80 children with SCA, showed that 2.5% were obese, an estimate that had not been identified until that date in the global society. This finding raises the possibility of the begin‑ ning of a period of changes in the anthropometric pattern of children and adolescents with SCA in the world, who would be closely related to the populations’ socioeconomic and cul‑ tural characteristics, which, in turn, correlate directly with nutritional status, since they are determinants of adequate physical growth, especially for children and adolescents with this chronic disease.28
It should be noted that the systematic review carried out in this study was based on a rigorous research methodology in the scientific literature, which minimizes the loss of infor‑ mation on the two topics studied. However, it was decided to
use articles only from the last 20 years, considering that older articles would not bring real data on the current situation of the SC and NC of children with SCA.
In the context of SCs and NCs, children and adolescents with SCA and their families seem to depend on improved access conditions to specialized health centers, especially those residing in remote areas, to receive adequate care and treatment. Access to health guidance and resources for nutritional support and disease management is paramount for proper physical devel‑ opment and maintenance of health status.
However, hereditary hemoglobin disorders, such as SCA, have become an increasingly neglected global health burden and a challenge for health managers and professionals. Babies who had previously died of this disease, before being recog‑ nized, began to live to diagnosis and treatment as developing countries undergo the epidemiological transition and improve the living conditions of their populations.51,52 Especially in developing countries, one of the major challenges is the scar‑ city of laboratory infrastructure to test SCA. For the ade‑ quate control of the socioeconomic impact and the clinical and nutritional consequences, a cheap and rapid diagnostic test that can identify the disease early in environments with few resources is necessary.53,54 In this context, the results of this study suggest that children and adolescents with SCA present socioeconomic limitations and worse anthropomet‑ ric and nutritional conditions when compared to reference populations. Such evidence is aggravated by the direct asso‑ ciation between socioeconomic and nutritional conditions, which implies a worse growth of these children and a higher occurrence of possible complications that may impair their quality of life.
Thus, health strategies directed at children and adoles‑ cents with SCA should include monitoring of growth and nutritional status as an essential requirement for comprehen‑ sive care, facilitating the diagnosis of growth failure and early nutritional intervention. Such strategies should consider the socioeconomic status of their families as an alternative to con‑ trol and prevent unwanted clinical consequences.
Finally, it is recommended that randomized controlled clinical trials be conducted to evaluate the potential benefits of nutritional interventions in relation to physical growth, nutritional status and SC in the families of children and ado‑ lescents with SCA.
Funding
The study did not receive funding.
Conflict of interests
Children and adolescents with sickle cell anemia
498
Rev Paul Pediatr. 2018;36(4):491‑499
REFERENCES
1. Brazil - Ministério da Saúde. Secretaria de Atenção à Saúde. Departamento de Atenção Especializada. Manual de Educação em Saúde. Brasília: Ministério da Saúde; 2008.
2. Adeyemo TA, Ojewunmi OO, Diaku-Akinwumi IN, Ayinde OC, Akanmu AS. Health related quality of life and perception of stigmatisation in adolescents living with sickle cell disease in Nigeria: A cross sectional study. Pediatr Blood Cancer. 2015;62:1245‑51.
3. Brazil ‑ Ministério da Saúde. Agência Nacional de Vigilância Sanitária (ANVISA). Manual de Diagnóstico e Tratamento de Doenças Falciformes. Brasília: ANVISA; 2002.
4. Brazil ‑ Ministério da Saúde. Secretaria de Políticas de Saúde. Manual de doenças mais importantes, por razões étnicas, na população brasileira afro-descendente. Brasília: Ministério da Saúde; 2001.
5. Organização Mundial da Saúde. Sickle-cell anemia: report by Secretariat. Fifty-Ninth World Health Assembly. Geneva: WHO; 2006.
6. Rhodes M, Akohoue SA, Shankar SM, Fleming I, Qi An A, Yu C, et al. Growth patterns in children with sickle cell anemia during puberty. Pediatr Blood Cancer. 2009;53:635‑41.
7. Robinson MR, Daniel LC, O’Hara EA, Szabo MM, Barakat LP. Insurance status as a sociodemographic risk factor for functional outcomes and health-related quality of life among youth with sickle cell disease. J Pediatr Hematol Oncol. 2014;36:51‑6.
8. Fernandes TA, Medeiros TM, Alves JJ, Bezerra CM, Fernandes JV, Serafim ES, et al. Socioeconomic and demographic characteristics of sickle cell disease patients from a low-income region of northeastern Brazil. Rev Bras Hematol Hemoter. 2015;37:172-7.
9. Segava NB, Cavalcanti A. Análise do desempenho ocupacional de crianças e adolescentes com anemia falciforme. Rev Ter Ocup. 2011;22:279-88.
10. ncbi.nlm.nih.gov/pubmed [homepage on the Internet]. National Center for Biotechnology Information Advances Science and Health - National Library of Medicine - National Institutes of Health ‑ PubMed [cited 2017 Mar 24]. Available from: https://www.ncbi.nlm.nih.gov/pubmed
11. World Health Organization. WHO Child Growth Standards: Length/height‑for‑age, weight‑for‑age, weight‑for‑length, weight-for-height and body mass index-for-age: Methods and development. Geneva: WHO; 2006.
12. Kuczmarski RJ, Ogden CL, Guo SS, Grummer-Strawn LM, Flegal KM, Mei Z, et al. 2000 CDC Growth Charts for the United States: methods and development. Vital Health Stat 11. 2000:1-190.
13. Hamill PV, Drizd TA, Johnson CL, Reed RB, Roche AF. NCHS growth curves for children birth‑18 years. Washington (DC): Department of Health Education and Welfare Washington DC; 1977.
14. Fernandes ML, Kawachi I, Corrêa‑Faria P, Pattusi MP, Paiva SM, Pordeus IA. Caries prevalence and impact on oral health-related quality of life in children with sickle cell disease: cross-sectional study. BMC Oral Health. 2015;15:68.
15. King AA, Strouse JJ, Rodeghier MJ, Compas BE, Casella JF, McKinstry RC, et al. Parent education and biologic factors influence on cognition in sickle cell anemia. Am J Hematol. 2014;89:162‑7.
16. Ezenwosu OU, Emodi IJ, Ikefuna AN, Chukwu BF, Osuorah CD. Determinants of academic performance in children with sickle cell anemia. BMC Pediatr. 2013;13:189.
17. Akodu SO, Diaku-Akinwumi IN, Njokanma OF. Obesity-does it occur in Nigerian children with sickle cell anemia. Pediatr Hematol Oncol. 2012;29:358‑64.
18. Luna AC, Rodrigues MJ, Menezes VA, Marques KM, Santos FA. Caries prevalence and socioeconomic factors in children with sickle cell anemia. Braz Oral Res. 2012;26:43‑9.
19. Boulet SL, Yanni EA, Creary MS, Olney RS. Health status and healthcare use in a national sample of children with sickle cell disease. Am J Prev Med. 2010;38:S528‑35.
20. Brown BJ, Okereke JO, Lagunju IA, Orimadegun AE, Ohaeri JU, Akinyinka OO. Burden of health‑care of carers of children with sickle cell disease in Nigeria. Health Soc Care Community. 2010;18:289-95.
21. Uchendu UO, Ikefuna AN, Nwokocha AR, Emodi IJ. Impact of socioeconomic status on sexual maturation of Nigerian boys living with sickle cell anemia. Hematology. 2010;15:414-21.
22. Panepinto JA, Pajewski NM, Foerster LM, Sabnis S, Hoffmann RG. Impact of family income and sickle cell disease on the health-related quality of life of children. Qual Life Res. 2009;18:5-13.
23. Telfair J, Haque A, Etienne M, Tang S, Strasser S. Rural/ urban differences in access to and utilization of services among people in Alabama with sickle cell disease. Public Health Rep. 2003;118:27‑36.
24. Singhal A, Morris J, Thomas P, Dover G, Higgs D, Serjeant G. Factors affecting prepubertal growth in homozygous sickle cell disease. Arch Dis Child. 1996;74:502‑6.
25. Orimadegun AE, Alohan AO, Onazi S. Predictors of hypoxaemia during steady-state among children with Sickle Cell Anemia in North-Western Nigeria. Afr J Med Med Sci. 2015;44:243-50.
26. Akodu SO, Diaku-Akinwumi IN, Kehinde OA, Njokanma OF. Evaluation of arm span and sitting height as proxy for height in children with sickle cell anemia in Lagos, Nigeria. J Am Coll Nutr. 2014;33:437-41.
27. Salles C, Bispo M, Trindade-Ramos RT. Association between morphometric variables and nocturnal desaturation in sickle‑cell anemia. J Pediatr (Rio J). 2014;90:420‑5.
28. Animasahun BA, Temiye EO, Ogunkunle OO, Izuora, AN, Njokanma OF. The influence of socioeconomic status on the hemoglobin level and anthropometry of sickle cell anemia patients in steady state at the Lagos University Teaching Hospital. Niger J Clin Pract. 2011;14:422‑7.
29. Wali YA, Moheeb H. Effect of hydroxyurea on physical fitness indices in children with sickle cell anemia. Pediatr Hematol Oncol. 2011;28:43-50.
31. Sadarangani M, Makani J, Komba AN, Ajala-Agbo T, Newton CR, Marsh K, et al. An observational study of children with sickle cell disease in Kilifi, Kenya. Br J Haematol. 2009;146:675‑82.
32. Fung EB, Kawchak DA, Zemel BS, Rovner AJ, Ohene‑Frempong K, Stallings VA. Markers of bone turnover are associated with growth and development in young subjects with sickle cell anemia. Pediatr Blood Cancer. 2008;50:620‑3.
33. Koumbourlis AC, Lee DJ, Lee A. Longitudinal changes in lung function and somatic growth in children with sickle cell disease. Pediatr Pulmonol. 2007;42:483‑8.
34. Kawchak DA, Schall JI, Zemel BS, Ohene‑Frempong K, Stallings VA. Adequacy of dietary intake declines with age in children with sickle cell disease. J Am Diet Assoc. 2007;107:843-8.
35. Zemel BS, Kawchak DA, Ohene‑Frempong K, Schall JI, Stallings VA. Effects of delayed pubertal development, nutritional status, and disease severity on longitudinal patterns of growth failure in children with sickle cell disease. Pediatr Res. 2007;61:607‑13.
36. Buison AM, Kawchak DA, Schall JI, Ohene-Frempong K, Stallings VA, Leonard MB, et al. Bone area and bone mineral content deficits in children with sickle cell disease. Pediatrics. 2005;116:943‑9.
37. Barden EM, Kawchak DA, Ohene-Frempong K, Stallings VA, Zemel BS. Body composition in children with sickle cell disease. Am J Clin Nutr. 2002;76:218‑25.
38. Buchowski MS, Chen KY, Byrne D, Wang WC. Equation to estimate resting energy expenditure in adolescents with sickle cell anemia. Am J Clin Nutr. 2002;76:1335‑44.
39. Oredugba, FA, Savage KO. Anthropometric findings in Nigerian children with sickle cell disease. Pediatr Dent. 2002;24:321-5.
40. Singhal A, Parker S, Linsell L, Serjeant G. Energy intake and resting metabolic rate in preschool Jamaican children with homozygous sickle cell disease. Am J Clin Nutr. 2002;75:1093-7.
41. Cipolotti R, Caskey MF, Franco RP, Mello EV, Fabbro AD, Gurgel RQ, et al. Childhood and adolescent growth of patients with sickle cell disease in Aracaju, Sergipe, north-east Brazil. Ann Trop Paediatr. 2000;20:109‑13.
42. Thomas PW, Singhal A, Hemmings‑Kelly M, Serjeant GR. Height and weight reference curves for homozygous sickle cell disease. Arch Dis Child. 2000;82:204-8.
43. Kopp-Hoolihan LE, Loan MD, Mentzer WC, Heyman MB. Elevated resting energy expenditure in adolescents with sickle cell anemia. J Am Diet Assoc. 1999;99:195-9.
44. Soliman AT, Bererhi H, Darwish A, Alzalabani MM, Wali Y, Ansari B. Decreased bone mineral density in prepubertal children with sickle cell disease: correlation with growth parameters, degree of siderosis and secretion of growth factors. J Trop Pediatr. 1998;44:194‑8.
45. Brazil ‑ Ministério do Planejamento, Desenvolvimento e Gestão. Instituto Brasileiro de Geografia e Estatística (IBGE). Síntese de indicadores sociais: uma análise das condições de vida da população brasileira 2016. Rio de Janeiro: IBGE; 2016.
46. Naoum PC. Interferentes eritrocitários e ambientais na anemia falciforme. Rev Bras Hematol Hemoter. 2000;22:5-22.
47. Marques LN, Cavalcanti A, Ruzzi‑Pereira A. O viver com a doença falciforme: percepção de adolescentes. Rev Ter Ocup Univ São Paulo. 2015;26:109‑17.
48. Prefeitura Municipal de Salvador. Secretaria Municipal da Saúde (SMS). Coordenação de Atenção e Promoção da Saúde. Programa de Atenção às Pessoas com Doença Falciforme. Doença falciforme: manual para população. Salvador: SMS; 2009.
49. Phebus CK, Gloninger MF, Maciak BJ. Growth patterns by age and sex in children with sickle cell disease. J Pediatr. 1984;105:28-33.
50. Al-Saqladi AW, Cipolotti R, Fijnvandraat K, Brabin BJ. Growth and nutritional status of children with homozygous sickle cell disease. Ann Trop Paediatr. 2008;28:165‑89.
51. Weatherall D. The inherited disorders of haemoglobin: an increasingly neglected global health burden. Indian J Med Res. 2011;134:493-7.
52. World Health Organization. Sickle-cell disease: a strategy for the WHO African region. Geneva: WHO; 2010.
53. Rahimy MC, Gangbo A, Ahouignan G, Alihonou E. Newborn screening for sickle cell disease in the Republic of Benin. J Clin Pathol. 2009;62:46‑8.
54. Howitt P, Darzi A, Yang GZ, Ashrafian H, Atun R, Barlow J, et al. Technologies for global health. Lancet. 2012;380:507-35.