A Work Project, presented as part of the requirements for the Award of a Master Degree in Economics / Finance / Management from the NOVA – School of Business and Economics.
Forest Fires in Portugal:
A study on determinants and the role of Firefighters
Paulo Matos, 26196
A Project carried out on the Master in Economics Program, under the supervision
of:
Professor Susana Peralta
and co-supervision of:
Professor Marta C. Lopes
Abstract
This paper takes a chance at analyzing firefighters with a causal aim. We start by analyze deter-minants on the number of ignitions, area burnt, time to extinction and firefighters’ response time on Forest Fires in continental Portugal, using fixed-effects estimation. We later focus our analy-sis on the importance of firefighters by studying the impact of a large decrease in the number of the firefighters in 2007 on the aforementioned variables, using difference-in-differences estimation. We find that firefighters have a negative impact on the number of ignitions and area burnt, and for smaller fires in time to extinction.
(JEL: O13 P48 Q58 R11)
Keywords
Forest Fires, Firefighters, Fixed-Effects, Difference-in-differences
This work used infrastructure and resources funded by Fundac¸˜ao para a Ciˆencia e a Tecnolo-gia (UID/ECO/00124/2013, UID/ECO/00124/2019 and Social Sciences DataLab, Project 22209), POR Lisboa (LISBOA-01-0145-FEDER-007722 and Social Sciences DataLab, Project 22209) and POR Norte (Social Sciences DataLab, Project 22209).
A raging wildfire ripping through central Portugal has killed at least 62 people and injured dozens more in what officials there described as the “greatest wildfire tragedy of recent years.” Julia Jones, Nicole Chavez and Chandrika Narayan, CNN, 2017
1
Introduction
Portugal had in 2017 its the deadliest forest fire ever (R´adio Renascenc¸a, 2017), the 11th deadli-est recorded in the world since 1900 (Barros, 2017), with over 60 deaths and 200 injured people (Vitorino, 2017). But this is no single case to Portugal’s record. An European Commission report (Rego et al., 2018) compares France, Greece, Italy, Portugal and Spain (who total 85% of total burnt area in Europe), and shows that every country but Portugal has been able to reduce average burnt area per forest fire in the last 4 decades. Instead, Portugal’s average area burnt has been increasing every decade. Despite the current decade not being over yet and not taking into account the 2017 forest fires, Portugal is yet the country with the largest average area burnt among the five countries in study. And the prospects for the future are no brighter, as Camia et al. (2017) shows, using the best available data and predictions, even under the most conservative simulations Portugal will experience a strong increase in fire danger, as “climate change will alter fire regimes bringing more severe burning conditions and more frequent wildfires”.
The literature often focuses on creating and assessing predictive models on where there will be ignitions and how they will spread, rather than infer causality. These predictive models are impor-tant as they allow for a better and more efficient management of combating instruments. However “fire managers agree than preventing fires would be more cost-effective that putting them out, and would cause less damage to lives, personal properties and the environment” (Mart´ınez et al., 2009). Such analysis on the effectiveness of current preventive and fighting measures/policies is lacking. Furthermore, a large portion of forest fires in Portugal are human-caused (Levin et al., 2016; Catry et al., 2009), and due to the unpredictability of human actions an analysis about policies that either make harder an ignition or its spread reinforces the interest of the present paper.
Using a dataset on every fire ignition in Portugal for the period 2001-2015, and meteorological, policy, forest policy, market and demographic data, the analysis was divided into two parts. The
first is an analysis of the determinants of the number of ignitions and the area burnt, aggregated at a daily municipality level. In the second we take advantage of a sharp decrease in the number of firefighters in 2007, and perform difference-in-differences regressions to evaluate the impact it had on the number of ignitions and area burnt on the municipalities.
The structure of the paper is as follows: 2. Literature Review, where we briefly go over the pur-pose of the existing literature, the variables it uses and the methods; 3. Data, where we describe the variables used, its sources, basic statistics, and how we treated and structured them; 4. The Determinants of Forest Fires in Portugal, where we explore which variables determine the number of ignitions, area burnt, the time to response and time to extinction; 5. Firefighters Decrease in 2007, where we look at the impact of a large asymmetric decrease in the number of firefighters in Portugal on the number of ignitions, area burnt, the time to response and time to extinction; 6. Conclusions, where we compare and discuss all the results.
2
Literature Review
While there is a large body of literature about the best predictive models of forest fires, there are fewer studies on the determinants of forest fires, or, even less, on causal relationships that may guide policy. They can as well be broadly split into predicting ignition occurrence and predicting the size an ignition takes, as according to Levin et al. (2016) “the variables controlling fire ignition (e.g., lightning strikes, controlled burns, arson, negligence) are not necessarily the same as the ones favoring fire spread, which include fuel type and availability, weather conditions, topography, and fire suppression capabilities”. But for a better understanding of the effectiveness of prevention and the role each factor plays, the determinants study appears rather more relevant.1
An European Commission publication (Rego et al., 2018) states that Fire Risk is determined by factors such as “vegetation, climate, forest management practices and other socioeconomic param-1A common feature of all the henceforth mentioned papers, is the use of spatial analysis. This is done by gridding
the studied map into squares of constant side length. A set of one square (or land location) and a time value is called a voxel (x, y, t). This is useful as geographical explanatory variables are often stored in these types of formats, such as geospatial vector data for Geographic Information System software - this is a file format that stores geometric location and variables’ values for each subdivision, such as altitude or the meteorologic variables.
eter”.2
On Vegetation, Preisler et al. (2004) shows that fuel moisture reduces Fire Risk.3 The type of vegetation is as well important, as Penman et al. (2013) shows that around Sydney dry sclerophyll forests are more susceptible to catch and spread lightening fires than the remaining types of vege-tation. It also shows, by separating fires by its cause into arson (human caused) and lighting (not human caused) ignitions, that the age of the vegetation matters, as lightening fires are more likely to ignite in older fuels, and arson fires are more likely to ignite in younger fuels. Pernas et al. (2011) shows that percentage cultivated area per region has a negative impact on burnt area.
On Forest Management Practices, Beighley and Hyde (2018) clearly points out that forest policy should incentivize decrease in fuel loads, by cultivating more land, cutting trees, cleaning wildland, reducing vegetation, etc. This is highly related to the aforementioned vegetation factors, as these will have an impact on moisture and the other factors relating to vegetation.
On Climate, higher values for Air Temperature, Drought Level and Wind Velocity are associated with an increase in Forest Fire Danger Index, while Relative Humidity and Rainfall are associated with a decrease in Forest Fire Danger Index (Penman et al., 2013; Garcia et al., 1995).4 Extreme climate events may also affect ignition probability, as in Preisler et al. (2004), where it is found that fire occurrence probability is almost 20 times larger for days with lighting activity than clear sky days. On the fire spread analysis, Maingi and Henry (2007) using the Palmer Drought Severity Index (”a standard for measuring meteorological drought in the United States”), finds that higher drought is positively correlated with total area burned for the periods of October–December and January–March, but not correlated the remaining trimesters.
On the last factor, the socioeconomic parameter, Mart´ınez et al. (2009) on a similar logic separates it into 7 risk factors, among which: “Socioeconomic transformations in rural areas”, where Catry 2Food and Agriculture Organization (1986) defines Fire Risk as “(1) The chance of fire starting, as affected by the
nature and the chance of fire starting, as affected by the nature and incidence of causative agencies; an element of the fire danger in any area; (2) a causative agent”
3Should be noted literature often estimates fuel moisture based on previous weather conditions, as in Van Wagner
(1987). However, in the mentioned paper the variable was retrieved from a weather station.
4The cited papers use Noble et al. (1980)’s methodology to compute Forest Fire Danger Index and then evaluate
the impact of meteorological variables on Fire Occurrence. The usage of indexes instead of meteorological variables separately is common in forest fire literature.
et al. (2009) ranks land cover probability of ignition occurrence by urban–rural, obtaining from higher to lower agriculture, shrubs, sparsely vegetated, forests and wetlands; “Human presence and socioeconomic transformations in urban areas”, where higher urban area (Mart´ınez et al., 2009), population increase have a positive impact on ignition risk (Mart´ınez et al., 2009; Catry et al., 2009). On the fire spread analysis, higher population density has a positive impact on total area burnt Pernas et al. (2011); “Persistence or transformation of traditional activities linked to fire in rural areas”, where higher density of agricultural machinery, density of livestock in extensive regime on forests and a decrease in the number of owners of agrarian holdings have a positive impact on ignition risk (Mart´ınez et al., 2009); “Landscape structure and housing patterns”: where higher density of agricultural plots (Mart´ınez et al., 2009) has a positive impact on ignition risk. On the fire spread analyses; “Indirect factors of intentional fires (declaration of protected areas, land use regulations, property conflicts, ’fire industry’ to obtain jobs or subsides in extinction and site-restoration work, etc.)”, where higher unemployment rate has a positive impact on ignition risk (Mart´ınez et al., 2009); “Forest policy”, where Pernas et al. (2011) finds a negative correlation on prevention expenditure and burnt area.
In what regards the methodologies used, logistic regression is among the most used models, as in Catry et al. (2009) and Preisler et al. (2004) by regressing whether there was at least one ignition (1) or not (0) on a set of variable, where the 0’s are chosen by drawing randomly a determined number of voxels where there were no ignitions. But other models have as well been used, such as negative binomial generalized linear model (Levin et al., 2016), artificial neural networks (Vasconcelos et al., 2001), among others. On the fire spread we often find linear models predicting area burnt using, among others, agroforestry, climate, population variables as determinants (Pernas et al., 2011). In this paper we intend to consolidate a causal perspective on the studies on fires, and not purely predictive. We also want to stir the involvement of the firefighters’ role on fires, by using both outcome variables related to them, as by using determinants regarding them, something that has not been done to the best extent of our knowledge. We will also try to evaluate their importance by studying the implications on an abrupt decrease on the number of firefighters.
3
Data
3.1
Data Collection
We collected data from several online resources about fire characteristics, weather conditions, pol-icy levers, market prices of wood, socio-economic and demographic indicators.
A dataset with every ignition in continental Portugal was retrieved from Instituto da Conservac¸˜ao da Natureza e da Floresta (henceforth ICNF), and contains the time and date of the alert, first intervention and extinction (to the minute), the cartesian coordinates, the burnt area in hectares, the type of fire (false alarm, small fires, wildfires, agricultural, fire fallow) and the municipality.567 From Sistema Nacional de Informac¸˜ao de Recursos H´ıdricos (henceforth SNIRH) we retreived data from their 790 weather stations that spawn the whole territory on wind velocity in meters per second, relative humidity in percentage (this is, the quantity of water in the air relative to the quantity of water it would take to saturate the air), precipitation in millimeters (equivalent to liters of water on the surface per square meter), atmospheric pressure in hectopascals, radiation in watt per square meter and air temperature in celsius degrees. Not all stations report data for the whole period nor all variables, as some start operating after 2001 and some closed before 2015. Despite being often computed weather indexes, we used the meteorological variables separately, as this is not only what is present in nature but its interpretation is as well easier.
We retrieved from Instituto Nacional de Estat´ıstica (henceforth INE) at a municipality level the number of firefighters, number of firefighter units, investment in firefighters, costs of firefighters, number of environmental non-governmental organizations, the forest area in km2, area in km2 per tree species, an estimation of the population and the unemployment rate.8
From Quadros de Pessoal, the portion of the labour force working on the “olive trees and forest 5As noted by Catry et al. (2009), “the majority of fire ignition coordinates in Portugal are associated with the nearest
toponymic location, meaning that they do not have totally accurate coordinates”.
6Municipalities correspond to the Local Administrative Unit (LAUs) Code level 1 for Portugal. The terminology is
maintained by Eurostat.
7The original name of the types, in portuguese, by the same order, were falso alarme, fogachos, fogos florestais,
fogos agriculas, queimadas.
exploration” (henceforth labour 1133,2012), “agriculture, animal production, hunting and forestry” (henceforth henceforth labour A), “Primary Sector” (henceforth labour A,B,C), “Secondary Sector” (henceforth labour D,E,F), “Terciary Sector” (henceforth labour rest) at a municipality level. At last, a country wide index of producer prices in wood and cork (except furniture; manufacture of articles of straw and plaiting materials, domestic market) and the area of each municipality were retrieved from Eurostat.
3.2
Sample Selection
Departing from the aforementioned variables, we computed population density (as the quotient between the population and the area), the time to response (as the difference between the extinction and first intervention times), the time to response (as the difference between the first intervention and alert times).
We cleaned the dataset to eliminate observations with coordinates outside Portugal (124 observa-tions), unknown types of fire (1 observations) and ‘false alarm’ fires (81,961 observations).
All alerts’ reported years were correct, and thus we took the alert times as correctly reported. None-the-less we have detected that some instances contained first intervention time before alert time, or end time before first response or alert time. For these instances the time variables, but alert time, have been disregarded, and thus explaining why ahead regressions on time to extinction or time to response will contain less observations.
With the fire-level database, we then aggregated it at a daily municipality-level database. We summed the number of ignitions and area burnt, and averaged the time to response and time to extinction. The determinants where connected by the period that contained the given day for the given municipality.9 The wood price index was assumed to be similar across the country, and the tree type coverage similar across municipalities. A statistical description of the variable set is in Table 1.
9Should be noted it is not the area burnt in a given day, but instead the total burnt area resulting of the ignitions
3.3
Descriptive Statistics
Table 1: Variable Description
N. of obs. Mean Stand. Dev. Min. Max. Unit Geography Frequency Source
Outcome
Number of Ignitions 235358 1.964 2.054087 1 71 municipality daily ICNF Burnt Area 235358 8.675241 171.5344 0 24843 hectares municipality daily ICNF Time to Response 183571 20.30453 1052.968 0 437765 minutes municipality daily ICNF Time to Extinction 232710 157.6461 1859.474 0 437820 minutes municipality daily ICNF
Meteorology
Precipitation 235358 2.71E-05 0.000301 0 0.0247 ’000 mm municipality hourly SNIRH Humidity 235353 0.058063 0.021315 0 0.168 ’000 % municipality hourly SNIRH Atmospheric Pressure 218804 0.099326 0.004893 0.06 0.10382 ’0,000 hPa municipality hourly SNIRH Radiation 235353 0.031208 0.027092 0 0.1977 ’0,000 watt/m2 municipality hourly SNIRH
Air Temperature 235353 0.206545 0.064409 -0.094 0.5 ’00oC municipality hourly SNIRH Wind Velocity 235358 0.013024 0.011344 0 0.348 ’00 m/s municipality hourly SNIRH Maximum Wind Velocity 235358 0.032062 0.020476 0 0.79 ’00 m/s municipality hourly SNIRH
Polic
y Firefighters’ InvestmentFirefighters’ Cost 235358235358 0.0159980.176979 0.0163130.221063 1.00E-050.01839 0.877060.0962 ’00,000’00,000ee municipalitymunicipality yearlyyearly INEINE Number of Firefighters 235358 164.4089 144.4612 0 1498 municipality yearly INE Number of Firefighters’ Units 235358 2.00277 1.590088 0 9 municipality yearly INE Number of NGO 235358 0.486667 1.354141 0 30 municipality yearly INE
F
orest
Polic
y
forest Area 235358 3161.168 686.0432 2130 4290 % municipality every 5 years INE Pine Area 235358 0.006407 0.002577 0.003574 0.010177 % municipality every 5 years INE Brave Pine Area 235358 0.005669 0.003177 0.000597 0.010064 % municipality every 5 years INE Tame Pine Area 235358 0.000739 0.001324 8.97E-06 0.006079 % municipality every 5 years INE Cork Oaks Area 235358 0.002284 0.003757 0.000371 0.01313 % municipality every 5 years INE Eucalyptus Area 235358 0.005438 0.002326 0.002258 0.009624 % municipality every 5 years INE Oaks Area 235358 0.000724 0.000554 0 0.001578 % municipality every 5 years INE Chestnut Area 235358 0.000501 0.000502 0 0.001264 % municipality every 5 years INE Holm Oaks Area 235358 0.000887 0.001939 6.28E-05 0.006701 % municipality every 5 years INE
Dem.
Unemployment Rate 235358 0.090899 0.038473 0.023 0.201 % municipality trimesterly INE Population 235358 54896.12 69274.56 1634 564657 municipality yearly INE
Mark
et
Wood Price Index 235358 1.006016 0.028224 0.96 1.076 % Country monthly EUROSTAT labour 1133,2012 147752 0.003482 0.007873 0 0.078117 municipality yearly Quadros de Pessoal
labour A 147752 0.041619 0.065629 0 0.533835 municipality yearly Quadros de Pessoal labour A,B,C 147752 0.053017 0.069607 0 0.557953 municipality yearly Quadros de Pessoal labour D,E,F 147752 0.451303 0.15402 0.078087 0.837478 municipality yearly Quadros de Pessoal labour rest 147752 0.495679 0.145018 0.159931 0.920586 municipality yearly Quadros de Pessoal Notes: This table presents summary statistics for all retrieved variables. It includes the number of observations, the mean, the standard deviation, the minimum value, the maximum value, the unit, the geographic aggregation, the timely frequency and the source. N = 235358. The time spawn used comprises 2001-2015. The data on the outcome variables was retrieved and calculated from Instituto da Conservac¸˜ao da Natureza e da Floresta. The meteorological data was retrieved from Sistema Nacional de Informac¸˜ao de Recursos H´ıdricos. The policy, forest policy and demographic variables were retrieved from Instituto Nacional de Estat´ıstica. The wood price index was retrieved from EUROSTAT. The remaining market variables were retrieved from Quadros de Pessoal. labour 1133,2012 is labour force working on the “olive trees and forest exploration”. labour A is “agriculture, animal production, hunting and forestry”. labour A,B,C is “Primary Sector”. labour A,B,C is “Secondary Sector”. labour rest is “Terciary Sector”.
For the considered period of 2001-2015, the fire-level database consists of 380,281 instances in continental Portugal, with an overt peak in 2005 (over 40,000 incidents) and a minimum in 2014 (under 10,000 incidents). 66% of the incidents are small fires, 18% are forest fires, 13% are agri-cultural and only 3% fire fallows. The variation (peaks and lows) of number of incidents is similar across districts, being in 2005 the only districts that did not see an increase higher than 25% Beja,
Set´ubal, ´Evora, Lisboa and Braganc¸a.10
The instances are concentrated in northern and seacoast of Portugal in 2001, and until 2009 we observe a steady increase of fires in the rest of the country, despite the northern and sea coast remaining the zones with the most fires. Through this period there is as well an increase in fire activity in the Lisbon area. In 2009 there is a big break in the number of fires in the south of Portugal, even though with more intensity than in 2001, and it stays more or less constant.
Regarding the area burnt forest fires account for about 97% of the total burnt area. There is a peak in area burnt in 2005, driven by the increase in the number of ignitions. Again, the area burnt variation is similar across districts, being Beja, Portalegre, Faro, Set´ubal and ´Evora the districts with distinctively lower area burnt in 2005. But the biggest peak is in 2003, driven instead by an increase in average area burnt per ignition. This is led due to a more right-skewed distribution on area burnt in 2003, this is, there are more big fires and less smaller fires than in the other years. The 5 district observations with the highest burnt area were all recorded in 2003, being the Guarda, Castelo Branco, Santar´em, Portalegre and Faro districts. Interestingly enough, all of these experienced most of its biggest fires in 2003, this is, there is a higher concentration of large fires in 2003 when comparing to the rest of the timeline. When scaling it to the districts’ area or the number of inhabitants the 5 aforementioned districts stand out again.
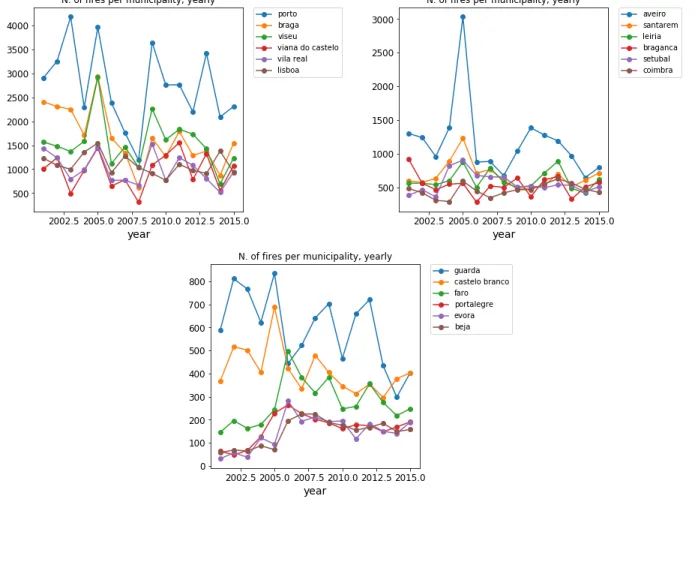
For every year the district of Porto has the highest number of total ignitions, and being among the smallest districts, the number of ignitions per km2 further hints Porto as a problematic district. When scaling the number of incidents per inhabitant, instead of area, being the second most popu-lous district (consistent through time), it no longer stands out, presenting mid-table ratios through all years. On the other hand, Vila Real, Viana do Castelo, Braganc¸a, Guarda and Viseu districts lead in this number of ignitions per inhabitant ratio. Within Porto district, Penafiel, Paredes, Gon-domar, Amarante, Marcos de Canaveses and Vila Nova de Gaia municipalities are often the ones who present higher values, being among the municipalities country-wide that present the highest number of ignitions through the years. But the highest value is recorded in Santa Maria da Feira 10Districts are an administrative and judicial division in Portugal, existing 18 in continental Portugal.
municipality, in Aveiro district in 2005.
June, July, August, September and October compress over 75% of all incidents and 90% of all burnt area. August is often responsible for the month with the most incidents and area burnt. 70% of fires occur between 9h30a.m. and 8h30p.m., being often the most critical hour 3p.m.
4
The Determinants of Forest Fires in Portugal
4.1
Methodology
We start by analyzing the number of ignitions, area burnt, time to response and time to extinction by estimating a fixed effects model with all the variables aggregated at a municipality level. The estimation equation is as follows:
yit= α +β Meteorologyit++θ Forest Policyit+δ Policyit+λ Marketit+γDemographicsit+ρZi+τyeart+εit (1)
where: i is the municipality; t is the day in the period; y is one of the four aforementioned outcome variables; Ziare the municipality fixed effects; yeart are year dummies; εit is the error term. Meteorology includes variables such as Air Temperature or Precipitation. They represent the hourly average for the time comprising the moment the firefighters were alerted for the fire existence. Forest Policy includes the municipality portion of forest area, and portion for some types of trees coverage area. Policy includes variables related to firefighters and the number of environmental NGO. Market includes the variation and 1 month lagged wood price index. Demographics includes yearly population density and trimester unemployment rate of the municipality.
4.2
Results
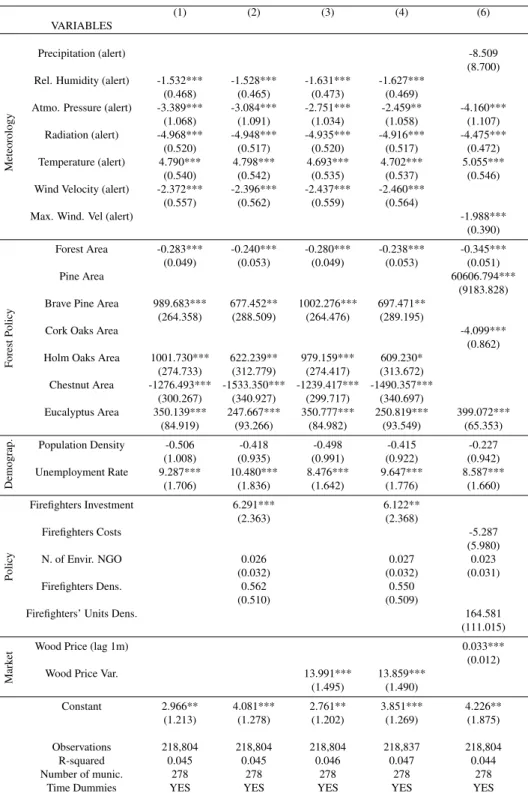
Table 2: Determinants Regression on N. of Ignitions
(1) (2) (3) (4) (6)
VARIABLES
Meteorology
Precipitation (alert) -8.509
(8.700) Rel. Humidity (alert) -1.532*** -1.528*** -1.631*** -1.627***
(0.468) (0.465) (0.473) (0.469)
Atmo. Pressure (alert) -3.389*** -3.084*** -2.751*** -2.459** -4.160*** (1.068) (1.091) (1.034) (1.058) (1.107) Radiation (alert) -4.968*** -4.948*** -4.935*** -4.916*** -4.475***
(0.520) (0.517) (0.520) (0.517) (0.472) Temperature (alert) 4.790*** 4.798*** 4.693*** 4.702*** 5.055***
(0.540) (0.542) (0.535) (0.537) (0.546) Wind Velocity (alert) -2.372*** -2.396*** -2.437*** -2.460***
(0.557) (0.562) (0.559) (0.564)
Max. Wind. Vel (alert) -1.988***
(0.390) F orest Polic y Forest Area -0.283*** -0.240*** -0.280*** -0.238*** -0.345*** (0.049) (0.053) (0.049) (0.053) (0.051) Pine Area 60606.794*** (9183.828) Brave Pine Area 989.683*** 677.452** 1002.276*** 697.471**
(264.358) (288.509) (264.476) (289.195)
Cork Oaks Area -4.099***
(0.862) Holm Oaks Area 1001.730*** 622.239** 979.159*** 609.230*
(274.733) (312.779) (274.417) (313.672) Chestnut Area -1276.493*** -1533.350*** -1239.417*** -1490.357*** (300.267) (340.927) (299.717) (340.697) Eucalyptus Area 350.139*** 247.667*** 350.777*** 250.819*** 399.072*** (84.919) (93.266) (84.982) (93.549) (65.353) Demograp. Population Density -0.506 -0.418 -0.498 -0.415 -0.227 (1.008) (0.935) (0.991) (0.922) (0.942) Unemployment Rate 9.287*** 10.480*** 8.476*** 9.647*** 8.587*** (1.706) (1.836) (1.642) (1.776) (1.660) Polic y Firefighters Investment 6.291*** 6.122** (2.363) (2.368) Firefighters Costs -5.287 (5.980) N. of Envir. NGO 0.026 0.027 0.023 (0.032) (0.032) (0.031) Firefighters Dens. 0.562 0.550 (0.510) (0.509)
Firefighters’ Units Dens. 164.581
(111.015)
Mark
et Wood Price (lag 1m) 0.033***(0.012)
Wood Price Var. 13.991*** 13.859***
(1.495) (1.490) Constant 2.966** 4.081*** 2.761** 3.851*** 4.226** (1.213) (1.278) (1.202) (1.269) (1.875) Observations 218,804 218,804 218,804 218,837 218,804 R-squared 0.045 0.045 0.046 0.047 0.044 Number of munic. 278 278 278 278 278
Time Dummies YES YES YES YES YES
Notes: This table studies the impact of the determinants on the number of ignitions on a municipality in continental Portugal in a given day, using fixed effects estimation. The time spawn used comprises 2001-2015. N = 218,804. N. of municipalities = 278. Time Dummies are yearly dummies. Robust standard errors in parentheses. *** p<0.01, ** p<0.05, * p<0.1
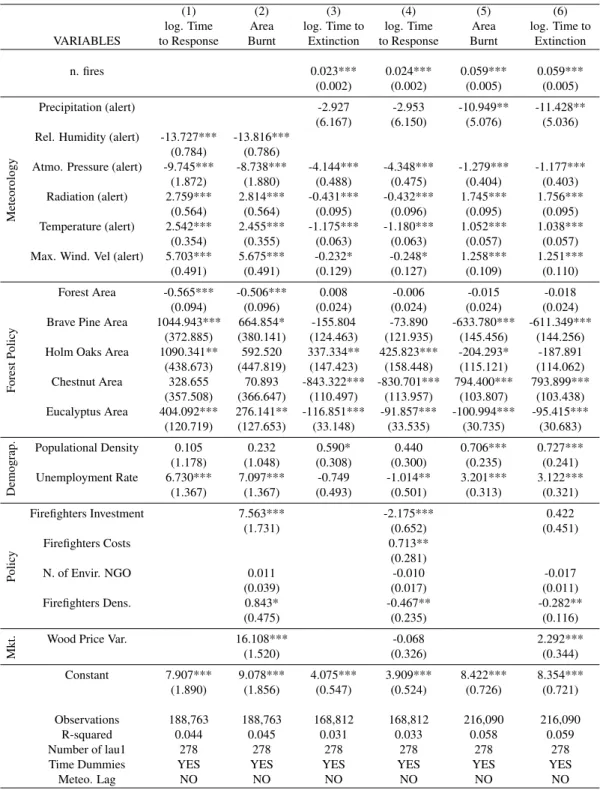
Table 3: Determinants Regression on other relevant outcome variables
(1) (2) (3) (4) (5) (6)
log. Time Area log. Time to log. Time Area log. Time to
VARIABLES to Response Burnt Extinction to Response Burnt Extinction
n. fires 0.023*** 0.024*** 0.059*** 0.059***
(0.002) (0.002) (0.005) (0.005)
Meteorology
Precipitation (alert) -2.927 -2.953 -10.949** -11.428**
(6.167) (6.150) (5.076) (5.036)
Rel. Humidity (alert) -13.727*** -13.816*** (0.784) (0.786)
Atmo. Pressure (alert) -9.745*** -8.738*** -4.144*** -4.348*** -1.279*** -1.177***
(1.872) (1.880) (0.488) (0.475) (0.404) (0.403)
Radiation (alert) 2.759*** 2.814*** -0.431*** -0.432*** 1.745*** 1.756***
(0.564) (0.564) (0.095) (0.096) (0.095) (0.095)
Temperature (alert) 2.542*** 2.455*** -1.175*** -1.180*** 1.052*** 1.038***
(0.354) (0.355) (0.063) (0.063) (0.057) (0.057)
Max. Wind. Vel (alert) 5.703*** 5.675*** -0.232* -0.248* 1.258*** 1.251***
(0.491) (0.491) (0.129) (0.127) (0.109) (0.110) F orest Polic y Forest Area -0.565*** -0.506*** 0.008 -0.006 -0.015 -0.018 (0.094) (0.096) (0.024) (0.024) (0.024) (0.024)
Brave Pine Area 1044.943*** 664.854* -155.804 -73.890 -633.780*** -611.349*** (372.885) (380.141) (124.463) (121.935) (145.456) (144.256) Holm Oaks Area 1090.341** 592.520 337.334** 425.823*** -204.293* -187.891 (438.673) (447.819) (147.423) (158.448) (115.121) (114.062) Chestnut Area 328.655 70.893 -843.322*** -830.701*** 794.400*** 793.899*** (357.508) (366.647) (110.497) (113.957) (103.807) (103.438) Eucalyptus Area 404.092*** 276.141** -116.851*** -91.857*** -100.994*** -95.415*** (120.719) (127.653) (33.148) (33.535) (30.735) (30.683) Demograp. Populational Density 0.105 0.232 0.590* 0.440 0.706*** 0.727*** (1.178) (1.048) (0.308) (0.300) (0.235) (0.241) Unemployment Rate 6.730*** 7.097*** -0.749 -1.014** 3.201*** 3.122*** (1.367) (1.367) (0.493) (0.501) (0.313) (0.321) Polic y Firefighters Investment 7.563*** -2.175*** 0.422 (1.731) (0.652) (0.451) Firefighters Costs 0.713** (0.281) N. of Envir. NGO 0.011 -0.010 -0.017 (0.039) (0.017) (0.011) Firefighters Dens. 0.843* -0.467** -0.282** (0.475) (0.235) (0.116) Mkt.
Wood Price Var. 16.108*** -0.068 2.292***
(1.520) (0.326) (0.344) Constant 7.907*** 9.078*** 4.075*** 3.909*** 8.422*** 8.354*** (1.890) (1.856) (0.547) (0.524) (0.726) (0.721) Observations 188,763 188,763 168,812 168,812 216,090 216,090 R-squared 0.044 0.045 0.031 0.033 0.058 0.059 Number of lau1 278 278 278 278 278 278
Time Dummies YES YES YES YES YES YES
Meteo. Lag NO NO NO NO NO NO
Notes: This table studies the impact of the determinants on the burnt area, time to response and time to extinction of an ignition, on a municipality in continental Portugal in a given day, using fixed effects estimation. The time spawn used comprises 2001-2015. N. of municipalities = 278. Time Dummies are yearly dummies. Robust standard errors in parentheses. *** p<0.01, ** p<0.05, * p<0.1
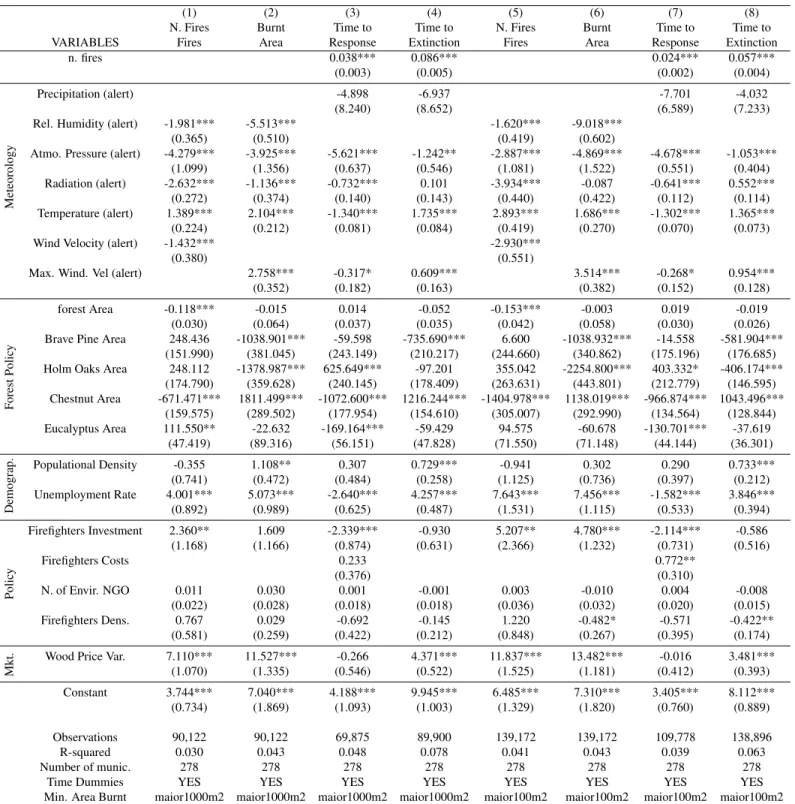
Table 4: Determinants Regression on all relevant outcome variables per minimum area burnt of 100m2and 1000m2
(1) (2) (3) (4) (5) (6) (7) (8)
N. Fires Burnt Time to Time to N. Fires Burnt Time to Time to
VARIABLES Fires Area Response Extinction Fires Area Response Extinction
n. fires 0.038*** 0.086*** 0.024*** 0.057***
(0.003) (0.005) (0.002) (0.004)
Meteorology
Precipitation (alert) -4.898 -6.937 -7.701 -4.032
(8.240) (8.652) (6.589) (7.233)
Rel. Humidity (alert) -1.981*** -5.513*** -1.620*** -9.018***
(0.365) (0.510) (0.419) (0.602)
Atmo. Pressure (alert) -4.279*** -3.925*** -5.621*** -1.242** -2.887*** -4.869*** -4.678*** -1.053***
(1.099) (1.356) (0.637) (0.546) (1.081) (1.522) (0.551) (0.404)
Radiation (alert) -2.632*** -1.136*** -0.732*** 0.101 -3.934*** -0.087 -0.641*** 0.552***
(0.272) (0.374) (0.140) (0.143) (0.440) (0.422) (0.112) (0.114)
Temperature (alert) 1.389*** 2.104*** -1.340*** 1.735*** 2.893*** 1.686*** -1.302*** 1.365***
(0.224) (0.212) (0.081) (0.084) (0.419) (0.270) (0.070) (0.073)
Wind Velocity (alert) -1.432*** -2.930***
(0.380) (0.551)
Max. Wind. Vel (alert) 2.758*** -0.317* 0.609*** 3.514*** -0.268* 0.954***
(0.352) (0.182) (0.163) (0.382) (0.152) (0.128) F orest Polic y forest Area -0.118*** -0.015 0.014 -0.052 -0.153*** -0.003 0.019 -0.019 (0.030) (0.064) (0.037) (0.035) (0.042) (0.058) (0.030) (0.026)
Brave Pine Area 248.436 -1038.901*** -59.598 -735.690*** 6.600 -1038.932*** -14.558 -581.904***
(151.990) (381.045) (243.149) (210.217) (244.660) (340.862) (175.196) (176.685)
Holm Oaks Area 248.112 -1378.987*** 625.649*** -97.201 355.042 -2254.800*** 403.332* -406.174***
(174.790) (359.628) (240.145) (178.409) (263.631) (443.801) (212.779) (146.595) Chestnut Area -671.471*** 1811.499*** -1072.600*** 1216.244*** -1404.978*** 1138.019*** -966.874*** 1043.496*** (159.575) (289.502) (177.954) (154.610) (305.007) (292.990) (134.564) (128.844) Eucalyptus Area 111.550** -22.632 -169.164*** -59.429 94.575 -60.678 -130.701*** -37.619 (47.419) (89.316) (56.151) (47.828) (71.550) (71.148) (44.144) (36.301) Demograp. Populational Density -0.355 1.108** 0.307 0.729*** -0.941 0.302 0.290 0.733*** (0.741) (0.472) (0.484) (0.258) (1.125) (0.736) (0.397) (0.212) Unemployment Rate 4.001*** 5.073*** -2.640*** 4.257*** 7.643*** 7.456*** -1.582*** 3.846*** (0.892) (0.989) (0.625) (0.487) (1.531) (1.115) (0.533) (0.394) Polic y Firefighters Investment 2.360** 1.609 -2.339*** -0.930 5.207** 4.780*** -2.114*** -0.586 (1.168) (1.166) (0.874) (0.631) (2.366) (1.232) (0.731) (0.516) Firefighters Costs 0.233 0.772** (0.376) (0.310) N. of Envir. NGO 0.011 0.030 0.001 -0.001 0.003 -0.010 0.004 -0.008 (0.022) (0.028) (0.018) (0.018) (0.036) (0.032) (0.020) (0.015) Firefighters Dens. 0.767 0.029 -0.692 -0.145 1.220 -0.482* -0.571 -0.422** (0.581) (0.259) (0.422) (0.212) (0.848) (0.267) (0.395) (0.174) Mkt.
Wood Price Var. 7.110*** 11.527*** -0.266 4.371*** 11.837*** 13.482*** -0.016 3.481***
(1.070) (1.335) (0.546) (0.522) (1.525) (1.181) (0.412) (0.393) Constant 3.744*** 7.040*** 4.188*** 9.945*** 6.485*** 7.310*** 3.405*** 8.112*** (0.734) (1.869) (1.093) (1.003) (1.329) (1.820) (0.760) (0.889) Observations 90,122 90,122 69,875 89,900 139,172 139,172 109,778 138,896 R-squared 0.030 0.043 0.048 0.078 0.041 0.043 0.039 0.063 Number of munic. 278 278 278 278 278 278 278 278
Time Dummies YES YES YES YES YES YES YES YES
Min. Area Burnt maior1000m2 maior1000m2 maior1000m2 maior1000m2 maior100m2 maior100m2 maior100m2 maior100m2 Notes: This table studies the impact of the determinants on the number of ignitions, burnt area, time to response and time to extinction of an ignition, on a municipality in continental Portugal in a given day, using fixed effects estimation. The time spawn used comprises 2001-2015. N. of municipalities = 278. Time Dummies are yearly dummies. Robust standard errors in parentheses. *** p<0.01, ** p<0.05, * p<0.1
Our regression (1) of Table 2 is the number of ignitions on a basic set of variables, excluding Policy and Market Variables. We then add these groups of variables up to regression (4). On regression (5) we change some variables for robustness, and to deepen our insights while comparing with the remaining equations. On Table 3 we then reproduce regressions (1) and (4) to the remaining explanatory variables. On Table 4 we reproduced these same regressions for all outcome variables excluding instances with less than 100m2and 1000m2of burnt area, corresponding to the 42% and 68% centiles of the area burnt distribution.
When taking the Meteorologic variables’ coefficients on the number of ignitions, they are highly statistically significant in every regression. Furthermore, the signs of relative humidity and air temperature are in accordance to Penman et al. (2013), but wind velocity’s sign is the opposite. We thus hypothesize that an higher wind velocity makes an ignition less likely, as it might blow out some starting ignitions. We also included atmospheric pressure and radiation, finding a negative impact on the number of ignitions on 2. When regressing on Burnt Area and Time to Extinction similar results hold but wind velocity, which now has a positive estimator. This means that the meteorological variables that prosper an ignition are the same that make it harder to fight it, but for wind velocity, which makes an ignition less likely to start, but makes it harder to put out. When regressing these variables on time to response, all meteorological variables but precipitation and air temperature are not statistically significant. Thus meaning that the meteorology plays little effect on the capacity of the firefighters to respond to a fire.
When it comes to the Forest Policy variables, and with the number of ignitions as the dependent variable, we can observe the forest area playing a highly statistically significant negative role. Meanwhile, types of pine, holm oaks and eucalyptus trees seem to make it less likely for an ignition to happen, and chestnut and cork oaks more likely. For area burnt the signs are similar when considering all ignitions. When considering only the larger fires all the estimators present the opposite sign. The same holds for all regressions on time to extinction. The forest area variable is not hard to understand why, as the lowest the forest area, the highest the urban area, and thus the more people we expect to live in the municipality. As most ignitions are human caused (Catry
et al., 2009), these areas with more people and less forest seem more prosper to ignitions. On the other hand, once an ignition has started, a forest presents not only more fuel to be consumed but harder scenes to fight the fire, and as such an increase in time to extinction in municipalities with larger forest area is normal. When it comes to the changing of the signs of the estimators for the types of trees, it means that the types that make it less prosper to start a fire are the ones that are the hardest to put out. But considering again that most ignitions are human caused, it might point out that humans mostly ignite fire on trees that are less likely to burn otherwise. If driven by economic reasons, humans might be looking to flood the wood market with cheaper wood, mainly of the types that are harder to get burnt. Again when regressing these variables on time to response, we expect it to increase with the density of holm oaks, and decrease with the density of chestnut and eucalyptus.
About the Demographic variables, we can see that the unemployment rate has a positive impact on the number of ignitions, as in Mart´ınez et al. (2009), meanwhile population density’s estimator is never statistically significant on the number of ignitions. For the burnt area both results seem to hold, for the time to response neither seems statistically significant, and for the time to extinction both are positive at highly statistically significant.
On the Market Variables, both wood price variation and the 1 month lagged wood price are expected to have a positive impact on the number of ignitions, burnt area and time to extinction, but are not statistically significant on the time to response.
At last, on the Policy variables, on the number of ignitions only the firefighters’ investment’s esti-mator is statistically significant, and it has a positive sign. This might relate to, even though low profile, the prevention responsibilities of the firefighters. This results still holds when regressing on burnt area and time to extinction, but with firefighter’s investment presenting a negative sign. This might instead be inverse causality, as the firefighters with the worse equipment, and thus who are less effective at fighting fires, might be the ones investing the most. But for time to response both firefighters’ investment and firefighters’ costs are statistically significant. The first is still neg-ative, maybe still showing the inverse causality, and the second might be showing that firefighters
who are able to spend more on a current basis are able to respond faster to fires. The firefighters’ density is statistically significant at a 5% level for time to extinction, indicating that the higher the firefighters’ density, the faster they will be in extinguishing a fire.
5
Firefighters Decrease in 2007
5.1
Preliminary Evidence
We now exploit a sharp decrease in the number of firefighters in 2007, shown in Figure 1a, which was asymmetrically distributed across the country, as shown in Figure 1b.
Figure 1: Time trend of Number of Firefighters
(a) Number of Firefighters in Portugal (b) N. of Firefighters Per District
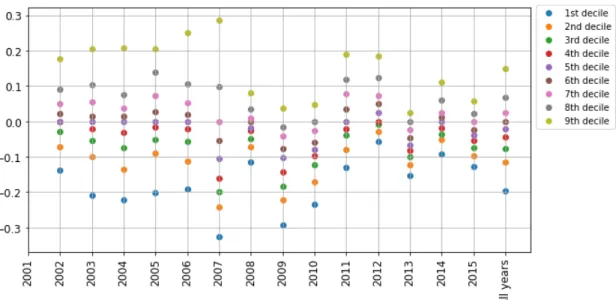
On Figure 2, when plotting the deciles of the relative variation of the number of firefighters at a municipality level through the whole period, we can corroborate that 2007 is the year that the most municipalities saw their number of firefighters shrink by the most, with the lowest 1st, 2nd, 3rd and 4thdeciles of the whole period, and that not all municipalities suffered this shock, as this is as well the year with the highest value for the 9th percentile. In most years, only about 10% of the municipalities lose more than 20% of the firefighters, while in 2007 this figure triples to about 30% of the municipalities.
Figure 2: Deciles of Relative Variation of N. of Firefighters per Municipality
Figure 3: Parallel Trends for the main outcome variables
(a) Parallel Trend: N. of Ignitions (b) Parallel Trend: Area Burnt
We then plotted the average value for each outcome variable in each year for not treated and not treated (in Figure 3), and can observe that for the number of ignitions the trend changes abruptly in 2007, but instead becomes much more similar than before. The same holds for the area burnt, and in more noticeably for time to response and time to extinction. Thus suggesting there might have been an impact provoked by the decrease in firefighters.
5.2
Methodology
We take advantage of the asymmetric decrease across municipalities to create a treated group as follows: municipalities with a relative variation of the number of firefighters lower than -20% in 2007 where considered treated.
To evaluate the impact the decrease of the firefighters had on the number of ignitions, area burnt, time to response and time to extinction, a difference-in-differences estimation was computed as follows:
yit = α + β 1(year > 2006)t+ δ 1(treated)i+ λ 1(year > 2006) × 1(treated)it+ γCovariatesit+ ρyeart+ εit (2)
where: i is the municipality; t is the day in the period; yit is the outcome variable (N. of Fires, Time to Response, Area Burnt, Time to Extinction);1year > 2006 is a dummy equal to one if the observation is after 2006; 1treated is a dummy equal to one if the observation was treated; yeart are year dummies; εit is the error term.
For robustness, and to provide further insights in the conclusions, we also use the thresholds for relative variation of the number of firefighters lower than -15% and -25%. The analysis only takes into account up to the period from 2001 to 2009 to focus on the causal effect of the 2007 decrease. At last, we focused solely on fires larger with burnt area above 100m2and 1000m2.
5.3
Results
On Table 5 we have performed difference-in-differences estimation on the log. of time to response, log. of area burnt and log. of time to extinction. Tables 6 and 7 show the results for the difference-in-differences estimation on the number of ignitions at the 15%, 20% and 25% thresholds. A com-plementary analysis is available in Appendix B, which reproduces the above estimations changing the treatment year from 2007 to 2006 and 2008, to ensure robustness and provide further insights.
Table 5: Difference-in-differences estimation on main outcome variables
(1) (2) (3) (4) (5) (6)
log. Time Area log. Time to log. Time Area log. Time to
VARIABLES to Response Burnt Extinction to Response Burnt Extinction
1(year) 0.736*** -1.337*** -0.247*** 0.962*** -0.973*** -0.208*** (0.038) (0.075) (0.026) (0.047) (0.070) (0.034) 1(treated) -0.027** 0.006 0.013 -0.029** -0.025 -0.003 (0.011) (0.021) (0.008) (0.014) (0.020) (0.010) 1(year>2006) ×1(treated) 0.027* 0.035 0.005 0.030* 0.070** 0.033** (0.014) (0.033) (0.012) (0.018) (0.031) (0.014) Constant 3.512*** 3.384*** 5.735*** 3.682*** 2.642*** 5.249*** (0.306) (0.663) (0.235) (0.415) (0.618) (0.316) Observations 54,634 82,672 82,578 34,688 53,978 53,895 R-squared 0.091 0.085 0.079 0.108 0.060 0.065
Covariates YES YES YES YES YES YES
Municipalities E. YES YES YES YES YES YES
Time Dummies YES YES YES YES YES YES
Burnt Area >100m2 >100m2 >100m2 >1000m2 >1000m2 >1000m2
Notes: This table studies the impact of a large decrease in the number of firefighters in continental Portugal in 2007 on the area burnt, time to response and time to extiction per municipality in continental Portugal in a given day, through difference-in-differences regression. 1(year>2006) is a dummy variable equal to 1 when the year after 2006. 1(treated) is a dummy variable equal to 1 for the municipalities who saw the firefighters decrease by 20% or more in 2007. Covariates include precipitation, atmospheric pressure, air temperature and wind velocity at the hour of alert and relative wood price variation. Municipalities’ Effects include population density, unemployment rate, labour on “agriculture animal production, hunting and forestry”, “Secondary Sector”, “Terciary Sector”, forest density, pine density, cork oak density and eucalyptus density. The time spawn used comprises 2001-2009. N = 94,102. N. of municipalities = 278. Time Dummies are yearly dummies. Robust standard errors in parentheses. *** p<0.01, ** p<0.05, * p<0.1
Table 6: Difference-in-differences estimation on N. of Ignitions, for area burnt larger than 100m2 (1) (2) (3) (4) (5) (6) (7) (8) (9) VARIABLES 1(year>2006) -1.013*** -0.388*** -0.941*** -1.013*** -0.385*** -0.938*** -0.987*** -0.366*** -0.918*** (0.029) (0.031) (0.031) (0.029) (0.030) (0.030) (0.028) (0.029) (0.030) 1(treated) 0.035** -0.072*** 0.034** -0.008 -0.145*** 0.008 0.036* 0.040* 0.038* (0.016) (0.018) (0.017) (0.017) (0.019) (0.018) (0.021) (0.023) (0.022) 1(year>2006) ×1(treated) 0.069*** 0.091*** 0.067*** 0.118*** 0.123*** 0.105*** 0.055* 0.082*** 0.066** (0.022) (0.024) (0.023) (0.023) (0.025) (0.024) (0.029) (0.031) (0.030) Constant 0.403** 1.325*** -0.219 0.457** 1.328*** -0.194 0.406** 1.240*** -0.275 (0.189) (0.300) (0.370) (0.193) (0.300) (0.372) (0.193) (0.298) (0.371) Observations 94,102 82,672 82,672 94,102 82,672 82,672 94,102 82,672 82,672 R-squared 0.101 0.036 0.114 0.101 0.037 0.114 0.101 0.036 0.114
Covariates NO YES YES NO YES YES NO YES YES
Municipalities E. YES NO YES YES NO YES YES NO YES
Time Dummies YES YES YES YES YES YES YES YES YES
Threshold 15 15 15 20 20 20 25 25 25
Notes: This table studies the impact of a large decrease in the number of firefighters in continental Portugal in 2007 on the number of ignitions per municipality in continental Portugal in a given day, through difference-in-differences regression.1(year>2006) is a dummy variable equal to 1 when the year after 2006.1(treated) is a dummy variable equal to 1 for the municipalities who saw their firefighters decrease by threshold or more in 2007. Covariates include precipitation, atmospheric pressure, air temperature and wind velocity at the hour of alert and relative wood price variation. Municipalities’ Effects include population density, unemployment rate, labour on “agriculture animal production, hunting and forestry”, “Secondary Sector”, “Terciary Sector”, forest density, pine density, cork oak density and eucalyptus density. The time spawn used comprises 2001-2009. N = 94,102. N. of municipalities = 278. Time Dummies are yearly dummies. Robust standard errors in parentheses. *** p<0.01, ** p<0.05, * p<0.1
Table 7: Difference-in-differences estimation on N. of Ignitions, for area burnt larger than 1000m2
(1) (2) (3) (4) (5) (6) (7) (8) (9) VARIABLES 1(year>2006) -0.659*** -0.185*** -0.574*** -0.653*** -0.181*** -0.566*** -0.643*** -0.174*** -0.559*** (0.025) (0.025) (0.026) (0.025) (0.024) (0.026) (0.024) (0.023) (0.025) 1(treated) 0.004 -0.059*** 0.004 0.022* -0.054*** 0.029** 0.059*** 0.052*** 0.055*** (0.012) (0.013) (0.013) (0.013) (0.014) (0.014) (0.015) (0.017) (0.017) 1(year>2006) ×1(treated) 0.051*** 0.060*** 0.051*** 0.062*** 0.076*** 0.059*** 0.048* 0.073*** 0.061** (0.019) (0.020) (0.019) (0.020) (0.022) (0.021) (0.025) (0.026) (0.025) Constant 1.640*** 1.123*** 1.758*** 1.624*** 1.095*** 1.709*** 1.570*** 0.995*** 1.620*** (0.162) (0.304) (0.352) (0.163) (0.304) (0.352) (0.162) (0.303) (0.351) Observations 61,966 53,978 53,978 61,966 53,978 53,978 61,966 53,978 53,978 R-squared 0.075 0.030 0.086 0.075 0.030 0.086 0.075 0.030 0.086
Covariates NO YES YES NO YES YES NO YES YES
Municipalities E. YES NO YES YES NO YES YES NO YES
Time Dummies YES YES YES YES YES YES YES YES YES
Threshold 15 15 15 20 20 20 25 25 25
Notes: This table studies the impact of a large decrease in the number of firefighters in continental Portugal in 2007 on the number of ignitions per municipality in continental Portugal in a given day, through difference-in-differences regression.1(year>2006) is a dummy variable equal to 1 when the year after 2006.1(treated) is a dummy variable equal to 1 for the municipalities who saw their firefighters decrease by threshold or more in 2007. Covariates include precipitation, atmospheric pressure, air temperature and wind velocity at the hour of alert and relative wood price variation. Municipalities’ Effects include population density, unemployment rate, labour on “agriculture animal production, hunting and forestry”, “Secondary Sector”, “Terciary Sector”, forest density, pine density, cork oak density and eucalyptus density. The time spawn used comprises 2001-2009. N = 94,102. N. of municipalities = 278. Time Dummies are yearly dummies. Robust standard errors in parentheses. *** p<0.01, ** p<0.05, * p<0.1
Average Treatment Effect (henceforth ATE) is statistically significant at the 15% and 20% olds for the number of ignitions, on both Tables 6 and 7. The larger estimators for the 20% thresh-old points that the most affected municipalities were the ones who saw the largest increase in the number of ignitions.
As for the log. Time to Response the difference-in-differences estimator is not so clearly statisti-cally significant. When comparing with the same estimations but using a different year of treatment, we can observe larger estimators and statistical significances for 2008 and 2006, thus leading us to believe that there is no causal relation in this variable.
Regarding the log. Area Burnt, it is statistically significant at a 5% level when including the co-variates and municipality effects. Its estimator is larger and more significant than when using 2008 as the treatment year, and similar when using 2006, thus hinting at some causal relation.
At last, the coefficient of the log. Time to Extinction is statistically significant at a 5% level when including the covariates and municipality effects. Its estimator is larger and more significant than when using 2008 as the treatment year, but smaller and less significant when using 2006, thus the effect had already started at least the year prior to 2007.
6
Conclusions
Our results start by corroborating some of the previously studied determinants on fire occurrence. They do diverge on what regards wind velocity, having obtained a negative coefficient. We find this result interesting, as all the papers covered in our literature use indices on weather rather than the meteorological variables separately. Even though this might explain why the conclusions diverge, the indices are constructed “without pre-conceived notions of the functional relationships between the variables” Noble et al. (1980). Furthermore Noble et al. (1980) also acknowledges that “wind fluctuates widely even in a single locality within a short time period and thereby alters the index substantially”. Taking into consideration that the value for the wind velocity in out dataset was collected at a weather station and represents an hourly average, rather than an instant
velocity collected at the place the fire started, this might represent an untrustworthy estimation on our part. We have also included atmospheric pressure and radiation, unlike what we have seen in the literature. These variables present similar and highly statistically significant coefficients through the estimations, and as such we encourage future research to include them.
On the forest policy, unlike the present literature, we have used the tree composition present in each region, and the results do indicate that the type of trees present are an interesting determinant of almost all outcome variables. We do emphasize the opposite signs obtained when regressing on the number of ignitions and on burnt area/time to extinction.
On the market variables, our models only have one variable, thus limiting our conclusions, but does open up the doors for a new interest in this research field. Being this variable statistically significant and positive, it means that when price of wood increases, we expect the number of ignitions to increase. We can relate this our results on forest policy, as we hypothesized that people set fire to the types of trees that burn the least. Thus meaning that, arson fire might be market led. To corroborate this theory, more data on both tree composition and wood market variables are need, which were not found.
On the demographic, our signs, when significant, do align with the literature, but more seldom we found significance than stressed as in Mart´ınez et al. (2009).
As for the policy variables, around which we focused most pf the work, we used variables that had not been used before, among which we highlight the number of firefighters. We found the density of the number of firefighters to be statistically significant on area burnt, and on time to extinction for fires larger than 100 m2. This results tells us that the number of firefighters does not affect the ignition, and the time to response. But does play some role for the fire fighting variables. Our coefficients tell us that the more firefighters per m2 we have on a municipality, the shorter and smaller the fire will be.
When performing the second analysis, the difference-in-differences estimation for the firefighters decrease in 2007, we do find some conflicting results. The firefighters do seem to influence the number of ignitions, as these increased. This corroborates the hypotheses that firefighters
preven-tion measures are effective. Regarding the time to response we suggest a causal relapreven-tion, agreeing with the determinants analysis that the number of firefighters does not impact the time they take to get to an ignition after an alert. On the area burnt, the results are not so clear, but do hint at a causal relation, confirming the prior conclusion that the more firefighters the least are burnt we expect. At last, the time to extinction is not affect by the decrease in the firefighters, unlike the relation found in the determinants sections. This last analysis bounds fires to larger than 100m2and 1000m2, and when looking at the determinants regressions on the same conditions (Table 4), we can observe that the coefficient is both less significant and smaller, thus pointing at a diminishing weight of the number of firefighters with the size of the fire. We present as an hypothesis that for larger fires, firefighters from neighboring municipalities might be called to help, or even when fires that start on a given municipality cross borders onto another municipality, more firefighters than the ones on the origin municipality will be fighting the fire.
References
Barros, Rui, “Fogo de Pedr´og˜ao Grande ´e o 11.omais mortal do mundo desde 1900,” 2017.
Beighley, Mark and A C Hyde, “Portugal Wildfire Management in a New Era: Assessing Fire Risks , Resources and Reforms,” 2018.
Camia, Andrea, Giorgio Libert`a, and Jes ´us San-Miguel-Ayanz, “Modeling the impacts of cli-mate change on forest fire danger in Europe: sectorial results of the PESETA II Project,” Tech-nical Report, European Commission JRC 2017.
Catry, Filipe X., Francisco C. Rego, Fernando L. Bac¸˜ao, and Francisco Moreira, “Modeling and mapping wildfire ignition risk in Portugal,” International Journal of Wildland Fire, 2009, 18 (8), 921–931.
Food and Agriculture Organization, Wildland fire management terminology, Vol. 70 1986.
Garcia, C. Vega, P. M. Woodard, S. J. Titus, W. L. Adamowicz, and B. S. Lee, “A logit model for predicting the daily occurrence of human caused forest fires,” International Journal of Wild-land Fire, 1995, 5 (2), 101–111.
Levin, Noam, Naama Tessler, Andrew Smith, and Clive McAlpine, “The Human and Physical Determinants of Wildfires and Burnt Areas in Israel,” Environmental Management, 2016, 58 (3), 549–562.
Maingi, John K. and Mary C. Henry, “Factors influencing wildfire occurrence and distribution in eastern Kentucky, USA,” International Journal of Wildland Fire, 2007, 16 (1), 23–33.
Mart´ınez, Jes ´us, Cristina Vega-Garcia, and Emilio Chuvieco, “Human-caused wildfire risk rat-ing for prevention plannrat-ing in Spain,” Journal of Environmental Management, 2009, 90 (2), 1241–1252.
Noble, I. R., A. M. Gill, and G. A.V. Bary, “McArthur’s fire-danger meters expressed as equa-tions,” Australian Journal of Ecology, 1980, 5 (2), 201–203.
Penman, T. D., R. A. Bradstock, and O. Price, “Modelling the determinants of ignition in the Sydney Basin, Australia: Implications for future management,” International Journal of Wild-land Fire, 2013, 22 (4), 469–478.
Pernas, Jes ´us Barreal, Loureiro Garc´ıa, Mar´ıa, and Juan Picos Mart´ın, “Estudio de la In-cidencia de los incendios en Galicia: Una Perspectiva Sociecoeconomica,” Revista Galega de Econom´ıa, 2011, 20 (1).
Preisler, Haiganoush K., David R. Brillinger, Robert E. Burgan, and J. W. Benoit, “Probability based models for estimation of wildfire risk,” International Journal of Wildland Fire, 2004, 13 (2), 133–142.
R´adio Renascenc¸a, “Grandes incˆendios em Portugal. Uma hist´oria que comec¸ou em 1986,” 2017.
Rego, Francisco, Jose Rodr´ıguez, Victoriano Calzada, and Gavriil Xanthopoulos, “Forest Fires: Sparking firesmart policies in the EU,” 2018.
Van Wagner, C. E., “Development and Structure of the Canadian Forest Fire Weather Index Sys-tem,” Technical Report, Canadian Forestry Service, Ottawa 1987.
Vasconcelos, M. J.P., S. Silva, M. Tom´e, M. Alvim, and J. M.C. Pereira, “Spatial prediction of fire ignition probabilities: Comparing logistic regression and neural networks,” Photogrammetric Engineering and Remote Sensing, 2001, 67 (1), 73–81.
A
Descriptive Statistics
Figure 4: Time trend of number of ignitions on the map of continental Portugal
B
Difference-in-differences estimation on Number of Ignitions,
log. Area Burnt, log. Time to Response and log. Time to
Extinction, taking treated year as 2006 and 2008
Table 8: Difference-in-differences estimation on Number of Ignitions, log. Area Burnt, log. Time to Response and log. Time to Extinction, taking treated year as 2006
(1) (2) (3) (4) (5) (6) (7) (8)
N. of log. Time Area log. Time to N. of log. Time Area log. Time to VARIABLES Ignitions to Response Burnt Extinction Ignitions to Response Burnt Extinction 1(year>2005) -0.482*** 0.736*** -1.337*** -0.252*** -0.321*** 0.960*** -0.974*** -0.215*** (0.042) (0.038) (0.075) (0.026) (0.038) (0.047) (0.070) (0.034) 1(treated) -0.057*** -0.029** 0.002 0.001 -0.006 -0.035** -0.035 -0.020** (0.021) (0.013) (0.023) (0.008) (0.016) (0.017) (0.022) (0.010) 1(year>2005) ×1(treated) 0.114*** 0.025 0.036 0.028** 0.056*** 0.034* 0.078** 0.065*** (0.025) (0.015) (0.033) (0.011) (0.021) (0.019) (0.030) (0.014) Constant -0.318 3.518*** 3.395*** 5.754*** 1.359*** 3.695*** 2.670*** 5.285*** (0.384) (0.307) (0.664) (0.235) (0.360) (0.415) (0.619) (0.316) Observations 82,672 54,634 82,672 82,578 53,978 34,688 53,978 53,895 R-squared 0.127 0.091 0.085 0.079 0.096 0.108 0.060 0.066
Covariates YES YES YES YES YES YES YES YES
Municipalities E. YES YES YES YES YES YES YES YES
Time Dummies YES YES YES YES YES YES YES YES
Min. burnt area 100m2 100m2 100m2 100m2 1000m2 1000m2 1000m2 1000m2
Robust standard errors in parentheses *** p<0.01, ** p<0.05, * p<0.1
Table 9: Difference-in-differences estimation on Number of Ignitions, log. Area Burnt, log. Time to Response and log. Time to Extinction, taking treated year as 2008
(1) (2) (3) (4) (5) (6) (7) (8)
N. of log. Time Area log. Time to N. of log. Time Area log. Time to VARIABLES Ignitions to Response Burnt Extinction Ignitions to Response Burnt Extinction 1(year>2007) -0.473*** 0.734*** -1.336*** -0.248*** -0.315*** 0.956*** -0.970*** -0.208*** (0.042) (0.038) (0.075) (0.026) (0.038) (0.047) (0.070) (0.034) 1(treated) -0.022 -0.029*** 0.011 0.011 0.011 -0.034*** -0.014 0.001 (0.016) (0.009) (0.019) (0.007) (0.013) (0.012) (0.018) (0.009) 1(year > 2007) ×1(treated) 0.076*** 0.046*** 0.033 0.013 0.030 0.060*** 0.058* 0.031* (0.026) (0.014) (0.037) (0.013) (0.023) (0.017) (0.035) (0.016) Constant -0.383 3.516*** 3.377*** 5.737*** 1.324*** 3.694*** 2.627*** 5.243*** (0.384) (0.306) (0.663) (0.235) (0.360) (0.415) (0.618) (0.316) Observations 82,672 54,634 82,672 82,578 53,978 34,688 53,978 53,895 R-squared 0.127 0.092 0.085 0.079 0.096 0.108 0.060 0.065
Covariates YES YES YES YES YES YES YES YES
Municipalities E. YES YES YES YES YES YES YES YES
Time Dummies YES YES YES YES YES YES YES YES
Min. burnt area 100m2 100m2 100m2 100m2 1000m2 1000m2 1000m2 1000m2 Robust standard errors in parentheses