Fortaleza, CE, INOVAGRI – http://www.inovagri.org.br DOI: 10.7127/rbai.v8n300209
Protocolo 209/13– 11/12/2013 Aprovado em 02/04/2014
EFFECT OF THE APPLICATION OF POTASSIUM CHLORIDE, SOIL PARTICLES AND SOLUBLE IRON IN THE DISCHARGE OF DRIPPERS
Rubens Duarte Coelho1, Pabblo Atahualpa de Aguiar Ribeiro1, Marconi Batista Teixeira2, Pedro Henrique Pinto Ribeiro3, Nathália Lopes Ribeiro2, José Joaquim de
Carvalho2 ABSTRACT
Since clogging of emitters is directly related to the quality of irrigation water, current assay quantifies possible discharge disorders in drips to which potassium chloride (white and red), soluble iron, suspended solids (soil particles) and water with organic matter (phytoplankton and algae) were applied. Assay was conducted at the Irrigation Laboratory of the Department of Biosystem Engineering of the Escola Superior de Agricultura “Luiz de Queiroz” – ESALQ/USP, and analyzed the performance of 21 drip tubes models, with four treatments and ten replications. Each replication was represented by a dripper. The addition of red potassium chloride and water with organic matter did not cause greater clogging rates. Model C7 had the best performance among the conventional models. C5 and C6 were the conventional models most prone to clogging, with high clogging rates. Model A9 had the best performance, whereas model A4 the highest clogging trend.
Keywords: water quality, clogging, fertigation
EFEITO DA APLICAÇÃO DE CLORETO DE POTÁSSIO, PARTÍCULAS DE SOLO E FERRO SOLÚVEL NA VAZÃO DE GOTEJADORES
RESUMO
A obstrução de emissores está diretamente relacionada à qualidade da água de irrigação, assim objetivou-se quantificar possíveis distúrbios de vazão em gotejadores submetidos à aplicação de cloreto de potássio (branco e vermelho), ferro solúvel, sólidos em suspensão (partículas de solo) e água contendo material orgânico (fitoplâncton/algas). O experimento foi realizado no Laboratório de Irrigação do Departamento de Engenharia de Biossistemas da Escola Superior de Agricultura “Luiz de Queiroz” – ESALQ/USP,
1 Prof. Livre Docente, Escola Superior de Agricultura “Luiz de Queiroz” – ESALQ/USP, LEB, Av. Pádua
dias, 11, Agronomia, Piracicaba - SP. CEP: 13.418-900. E-mail: rdcoelho@usp.br
2 Prof. Ens. Bas. Tec. Tecnológico, Instituto Federal Goiano – Câmpus Rio Verde, Rod. Sul Goiana Km
01, Zona Rural, Caixa Postal 66, Rio Verde – GO. CEP 75.901-970. E-mail: marconibt@gmail.com
3 Prof. Agronomia, Rod. GO 330, Km 241, Anel Viário s/n, Setor Universitário, Ipameri - GO. CEP:
e dez repetições, sendo cada repetição representada por um gotejador. A adição de cloreto de potássio vermelho não resultou em maior entupimento, assim como a adição de água com presença de matéria orgânica. O modelo C7 foi o que apresentou melhor desempenho entre os modelos convencionais. Os modelos convencionais mais suscetíveis ao entupimento foram os C5 e C6, com valores expressivos de entupimento. O modelo A9 foi o que apresentou melhor desempenho, enquanto o modelo A4 apresentou alta suscetibilidade ao entupimento.
Palavras-chave: qualidade de água, entupimento de gotejadores, fertirrigação.
INTRODUCTION
Localized irrigation is a method by which water is applied directly to the plant´s root region, with small intensity and high frequency, to maintain wetness close to ideal level or field capacity (Bernardo et al., 2006). This type of irrigation has been recently the most developed method recently due to its rational manner in water saving, production increase and the best agricultural quality.
The maintenance of high uniform water application and distribution in drip irrigation systems is highly important for efficient irrigation and, consequently, for a better exploration of water resources and costs reduction. According to Coelho (2007), several factors affect the uniform distribution of water in localized irrigation systems, which may include pressure of emitter, speed of water in the tubes, aligning of the lateral line, clogging of the emitters and others.
The clogging of the emitters is directly related to irrigation water quality and thus suspended solids, chemical composition and microbiological activity make mandatory water treatment for the prevention of obstructions (Carvalho, 2009). Clogging decreases the uniformity of emission (UE) and an increase in discharge coefficient of variation (CD) coupled to a significant decrease of uniformity in water distribution throughout the lateral lines (Cararo et al., 2006).
Ribeiro et al. (2010) report that changes in the discharge coefficient of variation are related to the obstruction process mainly caused by water quality used in irrigation. In fact, the problem does not affect equally all the drips throughout the lateral line since it is also dependent on the coefficient of manufacture variation.
Barros et al. (2009) registered that clogging caused by chemical precipitations occur gradually and are difficult to pinpoint.
Obstructions by suspended material (solid particles) may be removed easily since a good filtering system may reduce significantly the problem (Souza et al., 2006).
Current assay quantifies possible discharge disorders in drippers to which potassium chloride (white and red), soluble iron, suspended solids (soil particles) and water with organic matter (phytoplankton/algae) were applied, to characterize whether the use of red potassium chloride provides a higher possibility of clogging and whether it may be recommended for fertirrigation.
MATERIALS AND METHODS
Current essay was conducted at the Irrigation Laboratory of the Biosystem Engineering Department of the Escola Superior de Agricultura “Luiz de Queiroz” – ESALQ/USP. Experiments comprised metal structures, 11.0 m long by 4.0 m wide by 5.80 m high, consisting of four experimental modules. Twenty-one drip tubes with four lateral lines per model were employed. Drip tubes were in good condition (mean discharge close to nominal rate and low rates of coefficient variations of discharge), to which were applied the following treatments: (T1) water rich in phytoplankton (0.8 m3) + white potassium chloride + 1 kg of
clayey soil; (T2) water rich in phytoplankton (0.8 m3) + red potassium chloride + 1 kg of
clayey soil; (T3) drinkable water + white potassium chloride; (T4) drinkable water + red potassium chloride + 3 ppm total iron (iron sulfate pentahydrate). Four treatments with ten
replications were employed; each replication was represented by a dripper.
The methodology complies with research by Ribeiro et al. (2010) and Ribeiro et al. (2012), and current assay is a section of the research by the above mentioned author.
The potassium chloride solution was based on salinity level as a criterion, with electrical conductivity equal to 2.5 dS m-1. A
laboratory test was performed to determine the quantity of the commercial product to be added to the reservoir with 0.8 m3 of water (RIBEIRO et al., 2010).
The use of water rich in organic matter (phytoplankton) in the treatments with water from the treatment station of ESALQ/USP was due to the inferior quality of the water and thus the possibility of verifying the potential risk of drip clogging.
The experiment lasted 288 h with the application of each treatment. Applications were divided into cycles. Each cycle comprised 12 hours of continuous application and 36 hours of rest between each application. Every 48 hours formed a cycle and drip discharge was evaluated at the end of the 13-day application stage. Maintenance of the system (cleaning of the filter
occurred on the 14th day.
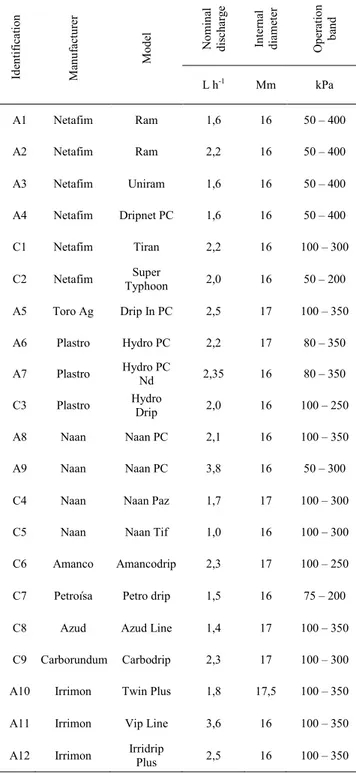
Table 1 shows the technical characteristics of the models of the drip tubes under analysis.
Table 1. Technical characteristics of drip tube
models according to manufacturers: nominal discharge (L h-1), internal diameter (mm) and
operation band (kPa)
Id en tif ic at io n M an uf ac tu re r M od el N omi na l di sc ha rg e In te rn al di ame te r O pe ra tio n ba nd L h-1 Mm kPa A1 Netafim Ram 1,6 16 50 – 400 A2 Netafim Ram 2,2 16 50 – 400 A3 Netafim Uniram 1,6 16 50 – 400 A4 Netafim Dripnet PC 1,6 16 50 – 400 C1 Netafim Tiran 2,2 16 100 – 300 C2 Netafim Typhoon Super 2,0 16 50 – 200 A5 Toro Ag Drip In PC 2,5 17 100 – 350 A6 Plastro Hydro PC 2,2 17 80 – 350 A7 Plastro Hydro PC Nd 2,35 16 80 – 350 C3 Plastro Hydro Drip 2,0 16 100 – 250 A8 Naan Naan PC 2,1 16 100 – 350 A9 Naan Naan PC 3,8 16 50 – 300 C4 Naan Naan Paz 1,7 17 100 – 300 C5 Naan Naan Tif 1,0 16 100 – 300 C6 Amanco Amancodrip 2,3 17 100 – 250 C7 Petroísa Petro drip 1,5 16 75 – 200 C8 Azud Azud Line 1,4 17 100 – 350 C9 Carborundum Carbodrip 2,3 17 100 – 300 A10 Irrimon Twin Plus 1,8 17,5 100 – 350 A11 Irrimon Vip Line 3,6 16 100 – 350 A12 Irrimon Irridrip Plus 2,5 16 100 – 350
other technical characteristics were maintained according to commercial availability and changes in the original spacing of each drip tube was avoided. According to Teixeira et al. (2010), the maintenance of the manufacturers´ characteristics is relevant to decrease errors and represent better the true conditions of the irrigation system on the field.
Since there is no specific norm for assays with drip clogging, such as the technical norms of ISO, ASAE and ABNT, the models of drip tubes in the assay received a code replacing their trademark to avoid commercial competition. Models were randomly coded by numbers (A1= auto-compensating dripper model X and C1 = conventional drip model Y) with no relationship with the name of the products given in Table 1.
Pressure system comprised two centrifuge motor pumps KSB model Hydrobloc C 750. Each motor pump set was specifically used for the application of a determined quality of water. Pump functioning, including start and end of each application cycle, was undertaken manually with a timetable for the start, duration of the application and discharge assay. A 120-mesh Amiad disc filter with a capacity for 15 m3
h-1 discharge was employed so that suspended
particles larger than the diameter of the emitters would not enter the system.
A pressure gauge was placed at the entrance of each level to adjust pressure at the
start of each drip tube during the discharge assays. It was adjusted to the former when required. A digital manometer ranging between 0 – 700 kPa was employed to measure and monitor pressure.
Application of solutions comprised a close system, or rather, a recycled process of the solution, for which a system of receiving the drip solution was installed. The receiving system was composed of two sets of zinc roof tiles placed below the tubes at 3% inclination which led the drip solution to a zinc trough in the center of the module. The solution returned from the trough to its respective receiving box by a set of 0.1 diameter PVC tubes. Further, frills at the edges of the roof tiles at 0.3 m high and plastic curtains were installed to avoid loss of the solution by drippings caused by the impact of drops on the roof tile surface.
Discharge procedure comprised pressuri-zation of the system, pressure stabilipressuri-zation at 150 kPa (+/- 5 kPa) at the start of the line, positioning of collectors under their respective drippers with a three-second delay and removal of the collectors in the same sequence and time delay after a five-minute collection. A gravi-tometer was employed for greater precision to determine the collected volume of each dripper. Discharge rates were given in L h-1 and a
certified 0.01 g precision scale (OHAUS) was used.
Comparison of treatment was performed by monitoring the dripper discharge (L h-1), by
discharge coefficient of variation (%), uni-formity of distribution (%) and clogging rate (%), calculated respectively by Equations (1), (2), (3) and (4). 60 γ t 1000 P q (1) where
q – discharge of the dripper employed, L h-1
P – weight of collected water, g t – time of collection, min
γ – specific weight of water used in the assay (mean rate for conversion of water to 25 oC was
0.997) 0 10 q s CVq (2) where:
CVq – coefficient of discharge variation, %
S – standard deviation of dripper discharge, Lh-1
q – mean discharge of used drippers, L h-1
100 q q UD 25% (3) where:
discharge rates, L h-1. 100 1 new used q q GE (4) where: GE - clogging rate, %
qnew -mean discharge of new dripper tubes, Lh-1.
qused -mean discharge of used dripper tubes,Lh-1.
RESULTS AND DISCUSSION
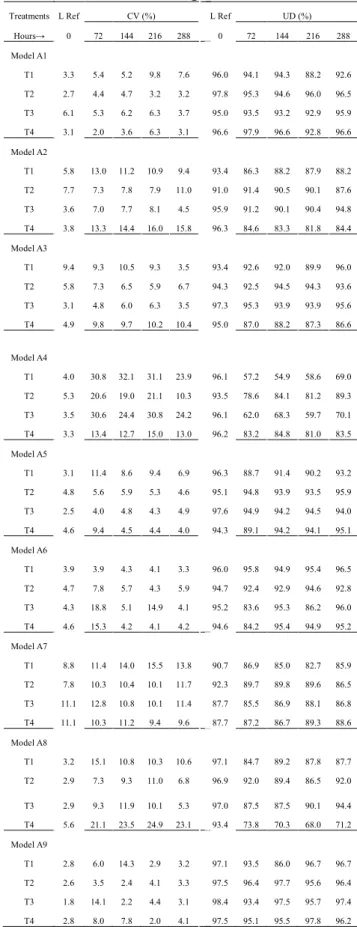
Models C1, C2 and C6 had the lowest clogging rates for all treatments, excepting treatment T1 of model C2 with discharge decrease by 2.5%. However, they were the only dripper models with no discharge reduction for treatments T1 and T2. On the other hand, models C3 and C4 had discharge reduction in all treatments. Models C5 and C7 were clogged with discharge reduction in treatments T1 and T2, by a difference of 30.3 and 10.3% for model C5 and of 60.7 and 24.1% for model C7. Discharge recovery occurred in treatments T3 and T4 when compared with final rates of the first phase, with 2 and 3.2 % for model C5 and 1.3 and 0.8 % for model C7 respectively in treatments T3 and T4 (Table 2).
%) and uniformity in water distribution (UD%) for drippers C models after 288 h irrigation
Treatments Ref L CV (%) Ref L UD (%) Hours → 0 72 144 216 288 0 72 144 216 288 Model C1 T1 1.8 9.4 11.2 10.1 8.2 98.6 88.9 87.0 87.5 88.9 T2 1.5 4.0 4.0 2.7 2.3 98.2 95.8 95.2 97.0 97.3 T3 2.5 7.0 7.0 5.9 5.5 97.6 93.2 92.6 93.4 93.3 T4 5.4 7.5 8.3 14.7 7.9 96.3 90.6 90.7 88.4 91.6 Model C2 T1 1.9 1.8 1.9 1.9 2.5 97.7 98.0 97.6 97.8 97.0 T2 3.7 2.1 2.7 2.0 2.7 95.8 97.9 97.5 97.8 97.5 T3 1.5 4.1 5.1 4.8 5.5 98.2 95.4 94.4 94.5 93.5 T4 3.4 3.6 3.9 3.0 3.9 96.5 95.5 95.3 96.4 95.2 Model C3 T1 3.1 2.7 2.5 2.7 2.8 96.5 97.2 97.1 96.9 97.3 T2 6.2 3.6 3.5 4.7 4.1 92.4 96.7 96.4 96.4 96.0 T3 2.2 6.1 3.1 5.7 4.3 98.7 93.4 97.7 93.3 96.3 T4 3.5 3.4 2.9 2.8 2.7 95.5 95.8 96.4 96.7 96.5 Model C4 T1 1.0 8.2 10.2 11.4 26.6 98.9 89.6 87.2 86.6 74.6 T2 1.6 3.8 3.7 3.3 3.1 98.2 96.0 96.0 96.5 96.8 T3 2.2 40.4 33.3 40.6 38.3 97.9 52.1 61.3 55.2 46.3 T4 1.3 12.4 18.5 11.7 13.7 98.5 88.8 80.6 88.3 87.0 Model C5 T1 3.4 66.4 62.3 59.4 44.0 95.9 18.9 23.9 24.7 47.1 T2 16.5 159.9 157.9 154.8 159.7 89.3 0.0 0.0 1.3 0.0 T3 4.7 102.3 93.6 135.6 116.5 95.3 0.1 0.2 0.4 0.0 T4 6.4 51.1 46.9 69.6 86.9 93.1 43.4 52.5 24.2 10.9 Model C6 T1 5.3 51.2 49.5 48.3 45.8 95.0 47.5 44.8 50.8 52.9 T2 4.5 27.1 18.6 13.5 16.7 95.4 75.8 80.8 86.6 81.5 T3 3.4 16.0 12.4 14.8 15.9 95.9 81.6 84.2 82.9 81.5 T4 4.2 15.1 12.7 13.6 7.1 96.1 81.4 84.3 82.0 92.2 Model C7 T1 5.8 6.2 7.4 6.8 6.2 94.3 93.6 93.2 93.9 94.2 T2 3.9 3.0 3.5 3.3 3.0 96.0 97.0 95.9 96.5 96.7 T3 6.7 7.2 6.9 6.3 7.1 93.8 93.2 93.9 94.7 92.5 T4 4.0 4.7 3.9 7.1 4.4 96.3 94.8 95.4 92.9 95.5
* L Ref: reference discharge
Discharge coefficient of variation rates for models C2, C3 and C7 were below 7% after 288 h irrigation. Performance classification ranged between excellent and average (ASAE, 2008). Consequently, models C1, C2, C3 and C7 had
CV below 10% (MERRIAM & KELLER, 1978) for all treatments, with the best performance. Table 2 shows that the models had a slight percentage decrease in water distribution uniformity due to the occurrence of partial clogging. They may be classified as excellent, following uniformity classification by SOLOMON (1979).
As a rule, models C1 and C2 had a mean performance with clogging rates between 8.5 % and 14.7 % for most treatments. Treatments T1 and T2 provided low clogging rates with 3.2 and 1.3 % for their respective treatments (Table 2).
Table 2 shows that models C5 and C6 had the worst performance with high clogging rates, or rather, above 20 %, reaching 77 % of discharge decrease. The exceptions were treatment T2 of model C5 with 8.2 % of discharge reduction and treatment T4 of model C6 with 13.5 %.
Discharge coefficient of variation of models C5 and C6 ranged between 13.7 and 159.7% after 288 hours of functioning of the system. Performance ranged from poor to unacceptable, according to uniformity classification by SOLOMON (1979).
When rates of water distribution uniformity are taken into account, models C5 had the highest clogging trend with UD (%) lower than 52%, or rather, with a performance ranging between bad and unacceptable, according to classification by Mantovani (2001). Model C8 had a higher than 38% discharge decrease for all treatments, with the extreme condition in which uniformity rates of water distribution were equal to zero. In other words, at least 25% out of the emitters evaluated had 100% clogging.
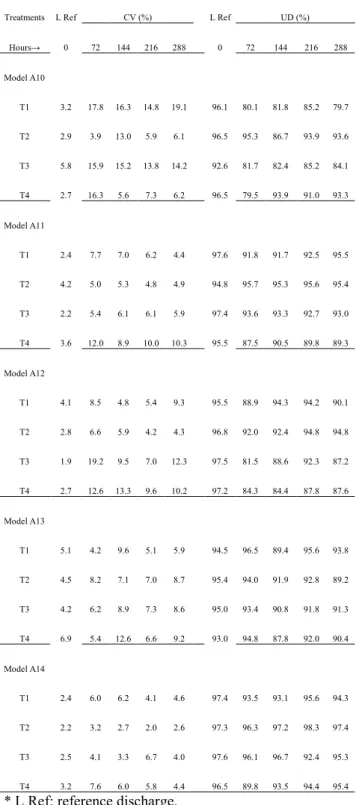
Tables 3a and 3b show coefficient of variation discharge rates (CV, %) and water uniformity distribution (UD %) of models A1 to A14.
Table 3a. Discharge coefficient variation
(CV%) and water uniformity distribution (UD%) of auto-compensating dripper tubes A1 - A9 after 288 hours of irrigation
Treatments L Ref CV (%) L Ref UD (%) Hours→ 0 72 144 216 288 0 72 144 216 288 Model A1 T1 3.3 5.4 5.2 9.8 7.6 96.0 94.1 94.3 88.2 92.6 T2 2.7 4.4 4.7 3.2 3.2 97.8 95.3 94.6 96.0 96.5 T3 6.1 5.3 6.2 6.3 3.7 95.0 93.5 93.2 92.9 95.9 T4 3.1 2.0 3.6 6.3 3.1 96.6 97.9 96.6 92.8 96.6 Model A2 T1 5.8 13.0 11.2 10.9 9.4 93.4 86.3 88.2 87.9 88.2 T2 7.7 7.3 7.8 7.9 11.0 91.0 91.4 90.5 90.1 87.6 T3 3.6 7.0 7.7 8.1 4.5 95.9 91.2 90.1 90.4 94.8 T4 3.8 13.3 14.4 16.0 15.8 96.3 84.6 83.3 81.8 84.4 Model A3 T1 9.4 9.3 10.5 9.3 3.5 93.4 92.6 92.0 89.9 96.0 T2 5.8 7.3 6.5 5.9 6.7 94.3 92.5 94.5 94.3 93.6 T3 3.1 4.8 6.0 6.3 3.5 97.3 95.3 93.9 93.9 95.6 T4 4.9 9.8 9.7 10.2 10.4 95.0 87.0 88.2 87.3 86.6 Model A4 T1 4.0 30.8 32.1 31.1 23.9 96.1 57.2 54.9 58.6 69.0 T2 5.3 20.6 19.0 21.1 10.3 93.5 78.6 84.1 81.2 89.3 T3 3.5 30.6 24.4 30.8 24.2 96.1 62.0 68.3 59.7 70.1 T4 3.3 13.4 12.7 15.0 13.0 96.2 83.2 84.8 81.0 83.5 Model A5 T1 3.1 11.4 8.6 9.4 6.9 96.3 88.7 91.4 90.2 93.2 T2 4.8 5.6 5.9 5.3 4.6 95.1 94.8 93.9 93.5 95.9 T3 2.5 4.0 4.8 4.3 4.9 97.6 94.9 94.2 94.5 94.0 T4 4.6 9.4 4.5 4.4 4.0 94.3 89.1 94.2 94.1 95.1 Model A6 T1 3.9 3.9 4.3 4.1 3.3 96.0 95.8 94.9 95.4 96.5 T2 4.7 7.8 5.7 4.3 5.9 94.7 92.4 92.9 94.6 92.8 T3 4.3 18.8 5.1 14.9 4.1 95.2 83.6 95.3 86.2 96.0 T4 4.6 15.3 4.2 4.1 4.2 94.6 84.2 95.4 94.9 95.2 Model A7 T1 8.8 11.4 14.0 15.5 13.8 90.7 86.9 85.0 82.7 85.9 T2 7.8 10.3 10.4 10.1 11.7 92.3 89.7 89.8 89.6 86.5 T3 11.1 12.8 10.8 10.1 11.4 87.7 85.5 86.9 88.1 86.8 T4 11.1 10.3 11.2 9.4 9.6 87.7 87.2 86.7 89.3 88.6 Model A8 T1 3.2 15.1 10.8 10.3 10.6 97.1 84.7 89.2 87.8 87.7 T2 2.9 7.3 9.3 11.0 6.8 96.9 92.0 89.4 86.5 92.0 T3 2.9 9.3 11.9 10.1 5.3 97.0 87.5 87.5 90.1 94.4 T4 5.6 21.1 23.5 24.9 23.1 93.4 73.8 70.3 68.0 71.2 Model A9 T1 2.8 6.0 14.3 2.9 3.2 97.1 93.5 86.0 96.7 96.7 T2 2.6 3.5 2.4 4.1 3.3 97.5 96.4 97.7 95.6 96.4 T3 1.8 14.1 2.2 4.4 3.1 98.4 93.4 97.5 95.7 97.4 T4 2.8 8.0 7.8 2.0 4.1 97.5 95.1 95.5 97.8 96.2
(CV%) and water uniformity distribution (UD%) of auto-compensating dripper tubes A10 - A14 after 288 hours of irrigation
Treatments L Ref CV (%) L Ref UD (%) Hours→ 0 72 144 216 288 0 72 144 216 288 Model A10 T1 3.2 17.8 16.3 14.8 19.1 96.1 80.1 81.8 85.2 79.7 T2 2.9 3.9 13.0 5.9 6.1 96.5 95.3 86.7 93.9 93.6 T3 5.8 15.9 15.2 13.8 14.2 92.6 81.7 82.4 85.2 84.1 T4 2.7 16.3 5.6 7.3 6.2 96.5 79.5 93.9 91.0 93.3 Model A11 T1 2.4 7.7 7.0 6.2 4.4 97.6 91.8 91.7 92.5 95.5 T2 4.2 5.0 5.3 4.8 4.9 94.8 95.7 95.3 95.6 95.4 T3 2.2 5.4 6.1 6.1 5.9 97.4 93.6 93.3 92.7 93.0 T4 3.6 12.0 8.9 10.0 10.3 95.5 87.5 90.5 89.8 89.3 Model A12 T1 4.1 8.5 4.8 5.4 9.3 95.5 88.9 94.3 94.2 90.1 T2 2.8 6.6 5.9 4.2 4.3 96.8 92.0 92.4 94.8 94.8 T3 1.9 19.2 9.5 7.0 12.3 97.5 81.5 88.6 92.3 87.2 T4 2.7 12.6 13.3 9.6 10.2 97.2 84.3 84.4 87.8 87.6 Model A13 T1 5.1 4.2 9.6 5.1 5.9 94.5 96.5 89.4 95.6 93.8 T2 4.5 8.2 7.1 7.0 8.7 95.4 94.0 91.9 92.8 89.2 T3 4.2 6.2 8.9 7.3 8.6 95.0 93.4 90.8 91.8 91.3 T4 6.9 5.4 12.6 6.6 9.2 93.0 94.8 87.8 92.0 90.4 Model A14 T1 2.4 6.0 6.2 4.1 4.6 97.4 93.5 93.1 95.6 94.3 T2 2.2 3.2 2.7 2.0 2.6 97.3 96.3 97.2 98.3 97.4 T3 2.5 4.1 3.3 6.7 4.0 97.6 96.1 96.7 92.4 95.3 T4 3.2 7.6 6.0 5.8 4.4 96.5 89.8 93.5 94.4 95.4
* L Ref: reference discharge.
Models A1, A13 and A14 provided clogging of drippers as discharge increased, or rather, they had discharge excess when compared to reference rates. On the other hand,
3.3; 3.1 and 4.1% of CV (%) respectively for treatments T1, T2, T3 and T4, and UD (%) above 96% for all treatments. In fact, it may be classified as excellent, according to Solomon (1979).
Table 3 registered that models A2, A3, A4, A10 and A12 had the highest CV (%) rates after 288 hours of treatment application. Model A4 had the greatest clogging trend, with over 10% discharge reduction for all treatments; with 23.9; 10.3; 24.2 and 13.0% discharge coefficient variation and with 69.0; 89.3; 70.1 and 83.5% water uniformity distribution respectively for treatments T1, T2, T3 and T4.
Treatments T1 and T3 (white potassium chloride) and T2 and T4 (red potassium chloride) would have the lowest performance with the application of red potassium chloride, with the highest clogging percentage and lowest water uniformity distribution rates when compared to treatments with the application of white potassium chloride (Tables 2 and 3).
A similar behavior occurred with water quality. It was expected that water plus organic matter (rich in phytoplankton) (T1 and T2) would have a higher capacity to cause dripper clogging problems when compared to treatments irrigated with tap water (T3 and T4). This fact was not reported (Tables 2 and 3), complying with report by RIBEIRO et al. (2010).
CONCLUSIONS
1. The addition of red potassium chloride and the addition of water with organic matter did not cause a higher clogging rate.
2. The addition of white potassium chloride and the addition of water with organic matter did not provoke a higher clogging rate.
3. Model C7 had the best performance among the conventional models.
4. C5 and C6 were the conventional models most prone to clogging, with significant clogging rates.
5. Model A9 and Model A4 respectively had the best and worst performance, the latter having high clogging trends.
ACKNOWLEDGEMENTS
The authors would like to thank the Ministry of Science and Technology (MCT), the Brazilian Council for Scientific and Technological Development (CNPq), the Coordinate for the Upgrading of personnel of Higher Institutions (CAPES), the National Institute for Science and Technology in Irrigation Engineering (INCTEI) and the
Research Foundation of the State of Goiás (FAPEG) for their funding of current research.
REFERENCES
ASAE. ASAE EP 405.1: standards, design and installation of microirrigation systems. [S.l.], 2008.
BARROS, A. C.; COELHO, R. D.; MEDEIROS, P. R. F.; MÉLO, R. F. DE; BARBOZA JÚNIOR, C. R. A.; DIAS, C. T. DOS S. Entupimento de gotejadores em função da aplicação de superfosfato simples e ácido nítrico. Revista Engenharia Agrícola, Jaboticabal, v.29, p.62-71, 2009.
BERNARDO, S.; SOARES, A. A.; MANTOVANI, E. C. Manual de irrigação. 8.ed. Viçosa: UFV. 2008. 625p.
CARARO, D. C.; BOTREL, T. A.; HILLS, D. J.; LEVERENZ, H. L. Analysis of clogging in drip emitters during wastewater irrigation. Applied Engineering in Agriculture, v.22, p.251-257, 2006.
CARVALHO, L. C. C. de. Dinâmica do entupimento de tubos gotejadores sob aplicação de ferro solúvel, sólidos em suspensão e fitoplâncton. 2009. 155p. Doctoral Thesis in Agronomy – Escola Superior de Agricultura “Luiz de Queiroz”, Universidade de São Paulo, Piracicaba, 2009.
pressurizada no Brasil. Piracicaba: ESALQ/USP, 2007. 192p. Post-Doctoral Thesis.
MANTOVANI, E. C. AVALIA: Programa de Avaliação da Irrigação por Aspersão e Localizada. Viçosa, MG: UFV, 2001.
MERRIAM, J. L.; KELLER, J. Farm
irrigation system evaluation: a guide for
management. Logan: Utah State University, 1978.
RIBEIRO, P. A. de A.; COELHO, R. D.; TEIXEIRA, M. B. Entupimento de tubos gotejadores convencionais com aplicação de cloreto de potássio (branco e vermelho) via duas qualidade de água. Revista Engenharia Agrícola, v.30, p.279-287, 2010.
RIBEIRO, P. A. de A.; TEIXEIRA, M. B.;
F. da; CARVALHO, L. C. C. de; ALVES, M. E. B. Gotejadores submetidos a condições críticas de qualidade da água. Irriga, Botucatu, Edição Especial, p.368-379, 2012.
SOUZA, J. A. A.; CORDEIRO, E. A.; COSTA, E. L. Aplicação de hipoclorito de sódio para recuperação de gotejadores entupidos em irrigação com água ferruginosa. Revista Brasileira de Engenharia Agrícola e Ambiental, v.10, p.5-9, 2006.
SOLOMON, K. Manufacturing variation of trickle irrigation systems. Transactions of the ASAE, v.22, p.1034-1038, 1979.
TEIXEIRA, M. B.; COELHO, R. D.; SILVEIRA, P. R. A. Avaliação de tratamentos utilizados para desobstrução de tubos gotejadores. Revista Brasileira de Agricultura Irrigada, v.4, p.43-55, 2010.