ISSN: 1809-4430 (on-line)
_________________________
1 Engº Agrícola, Prof. Doutor, Setor de Engenharia Ambiental e Sanitária, Centro Universitário de Formiga - MG/Formiga – MG,
Fone: (37) 3322-5923, [email protected]
2 Engº Agrícola, Prof. Doutor, Departamento de Engenharia, UFLA/Lavras – MG, [email protected]
3 Tecnólogo em Recursos Hídricos/Irrigação, Pós-doutorando, Núcleo de Engenharia de Água e Solo, UFRB/Cruz das Almas – BA,
BACKPRESSURE EFFECTS ON THE FLOW-PRESSURE RELATION OF DRIPLINES
Doi:http://dx.doi.org/10.1590/1809-4430-Eng.Agric.v36n1p 55-62/2016
MICHAEL S. THEBALDI1, LUIZ A. LIMA2, WILLIAN F. DE ALMEIDA3,
RAFAELLA R. ANDRADE4
ABSTRACT: For drip irrigation design and management, it is necessary to know the relation between flow and pressure acting on emitters. In the case of subsurface drip irrigation, the backpressure phenomenon may change the hydraulic characteristics of emitters. Thus, this study aimed at determining such relationship between flow and pressure of different driplines in surface and subsurface conditions; aiming to find possible differences in hydraulic behavior. We tested four emitter types; two pressure compensating (D5000 and Hydro PCND) and two non-pressure compensating (TalDrip and Jardiline). Emitter flow rates were attained in atmospheric conditions and submerged in water, in which submergence levels represented backpressure. Assays were performed using inlet pressures of 80, 100, 120, and 150 kPa for the Hydro PCND dripline and 25, 50, 100, and 150 kPa for the other ones; the backpressures were of 0.49, 1.47, 2.45, 4.41 and 6.37 kPa with four replications. The emitters had their proportionality constants and discharge exponents changed in submerged applications, representing backpressure effect. Non-pressure compensating emitters had their discharge exponent decreased, while in pressure compensating ones, it was increased. Backpressure reduced emitter flow rates at all evaluated pressures.
KEYWORDS: discharge exponent, proportionality constant, trickle irrigation.
EFEITOS DA CONTRAPRESSÃO SOBRE A RELAÇÃO VAZÃO-PRESSÃO DE TUBOGOTEJADORES
RESUMO:Para o projeto e o manejo da irrigação por gotejamento, é necessário o conhecimento da relação entre vazão e pressão atuante sobre os emissores. Porém, o fenômeno da contrapressão, no caso do gotejamento subsuperficial, pode alterar as características hidráulicas dos emissores. Assim, o objetivo deste trabalho foi determinar a relação entre a vazão e a pressão de diferentes tubogotejadores em condições superficiais e subsuperficiais, e as possíveis diferenças no comportamento hidráulico dos emissores nessas duas condições. Foram utilizados nos ensaios quatro emissores: dois autocompensantes (D5000 e Hydro PCND) e dois não autocompensantes (TalDrip e Jardiline). A vazão destes foi obtida em condição atmosférica e submersa em água, em que os níveis de submersão representaram a contrapressão. Os ensaios foram realizados utilizando as pressões de entrada de 80; 100; 120 e 150 kPa para o tubo gotejador Hydro PCND e 25; 50; 100 e 150 kPa, para os demais, e contrapressões de 0,49; 1,47; 2,45; 4,41 e 6,37 kPa, com quatro repetições. Os emissores tiveram suas constantes de proporcionalidade e expoentes de descarga alterados em aplicação submersa. Emissores não autocompensantes tiveram seu expoente de descarga diminuído, enquanto nos autocompensantes, este aumentou. A vazão de emissores foi reduzida pelo efeito da contrapressão, em todas as pressões avaliadas.
INTRODUCTION
Flow-pressure relation, head loss along lateral driplines, inside the drip emitter and during the watercourse on it, constitute hydraulic characteristics with direct influence on micro-irrigation performance. These characteristics vary according to emitter type, its constituent material, manufacturing process and connection to the line (FRIZZONE et al., 2012).
In addition, it is essential for the drip irrigation design that there is information regarding the emitter flow and their flow regime. This information is obtained through the manufacturing variation coefficient and the emitter characteristic equation (flow-pressure relation).
Surface drip irrigation system is the most widely used among dripping systems; however, subsurface drip has become a common irrigation system in agriculture and landscaping. The latter provides water and nutrients to plants while maintaining soil surface drier when compared to surface dripping. This fact leads to lower evaporation and, consequently, greater transpiration, allowing most efficient water use (KANDELOUS & SIMUNEK, 2010), greater materials lifespan and reduction of the water evaporation area from soil surface. This is especially important when wastewater is used, since there is an odors and health risks reduction.
In addition to the aforementioned features, there is a lower incidence of weeds and plant diseases justified by less surface moisture, great potential for automation, possibility to apply chemicals through irrigation water, flexibility in agricultural machinery use, among others (COELHO et al., 2010; LIMA et al., 2010).
In contrast, subsurface dripping may be hampered by backpressure phenomenon, that leads to reduction of dripper flow. This water backpressure within the cavity formed around emitter discharge point (GIL et al., 2011) occurs when water application intensity exceeds soil infiltration capacity. WARRICK & SHANI (1996) suggested the use of pressure compensating emitters to decrease uniformity problems; however, pressure values found in literature vary considerably. As an example, values between 1.5 to 20 kPa (GIL et al., 2011) and from 3 to 11 kPa (GIL et al., 2010) may make pressure compensating emitters fall out of auto-compensation range, which results in poor irrigation uniformity with an additional effect on spatial variability of physical and hydraulic soil characteristics.
Therefore, subsurface drip system design and proper handling requires precise knowledge on water distribution surrounding emitters, i.e. within root zone, without both wetting soil surface and percolating to groundwater (KANDELOUS et al., 2011).
Based on the points made above, backpressure can change the hydraulic characteristics of emitters in subsurface drip irrigation; thus, our study aimed to determine the relationship between flow and pressure of four drippers in surface and subsurface systems, as well as pos sible differences in emitter hydraulics under both conditions.
MATERIAL AND METHODS
The experiment was conducted at the Laboratory of Hydraulics, annex building of the Didactic-Scientific Center of Water and Soil Engineering that belongs to the Department of Engineering of the Federal University of Lavras.
The dripline models used were:
a) NaanDanJain TalDrip, non-pressure-compensating, nominal flow rate of 1.7 L h-1, nominal diameter of 0.017 m and inner diameter of 0.0158 m.
b) NaanDanJain JardiLine, non- pressure-compensating, nominal flow rate of 3.6 L h-1, maximum operation pressure of 350 kPa, nominal diameter of 0.016 m and inner diameter of 0.0139 m;
d) John Deere Water Hydro PCND, pressure-compensating and anti-draining, nominal flow rate of 2.35 L h-1, nominal diameter of 0.016 m, inner diameter of 0.0153 m, operating range between 75 and 350 kPa.
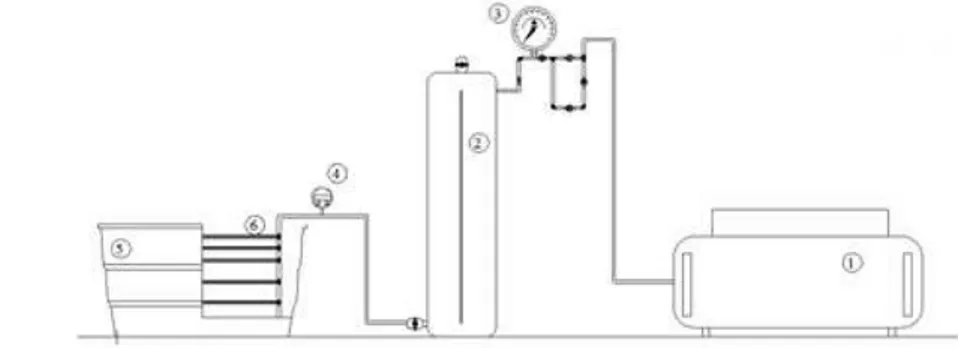
Testing was performed using an assembled apparatus as shown in Figure 1. The eq uipment consists of an air compressor (1), attached to a Mariotte bottle (2) built from PVC pipe with 150-mm nominal diameter. Inlet pressure within this flask was monitored through a pressurized air dispenser (3) manufactured by Soil Moisture Equipment Corporation. Yet emitters’ inlet pressures were controlled by a digital manometer (4), accounting for the difference in level between the manometer and the dripper lines. Emitter flow was measured by water level drop in the Mariotte bottle, whose cross section area was known, being observed through a transparent hose attached to its body.
The driplines were placed into a 2000-L glass fiber tank (5) attached to a metallic frame (6), being controlled by valves installed at the start of the line.
FIGURE 1. Assembled apparatus for evaluating the flow of dripper segments.
Tests were performed with increasing pressures (h0) of 25, 50, 100 and 150 kPa for the
driplines TalDrip, JardiLine, and D5000, and of 80, 100, 120, and 150 kPa for the dripline Hydro PCND, with 12 transmitters evaluated with four replications for each pressure.
For having anti-draining characteristic, the Hydro PCND emitter could not be tested out of operating pressure, since in pressure values below lower threshold there is no flow. On the other hand, emitter D5000 was analyzed with inlet pressure below presure-compensation range, because there is no hindrance for its use without flow regulation, thus, it’s important to know its flow below manufacturer’s pressure range recommendation.
With the average values of emitter flow and pressure, we adjusted the emitter characteristic equation (Equation 1), which describes the potential relationship between pressure and discharge (FRIZZONE et al., 2012).
(1)
In which,
Qsurface = emitter flow, L h-1;
k = proportionality constant that characterizes each emitter, L h-1 kPa-x;
h0 = hydraulic pressure to the emitter water inlet, kPa; and
x = emitter discharge exponent, which characterizes the flow regime, dimensionless.
(2)
In which,
A = cross-sectional area where the discharge occurs, m²; Cd = hydraulic discharge coefficient, dimensionless; g = gravity acceleration, m s-2.
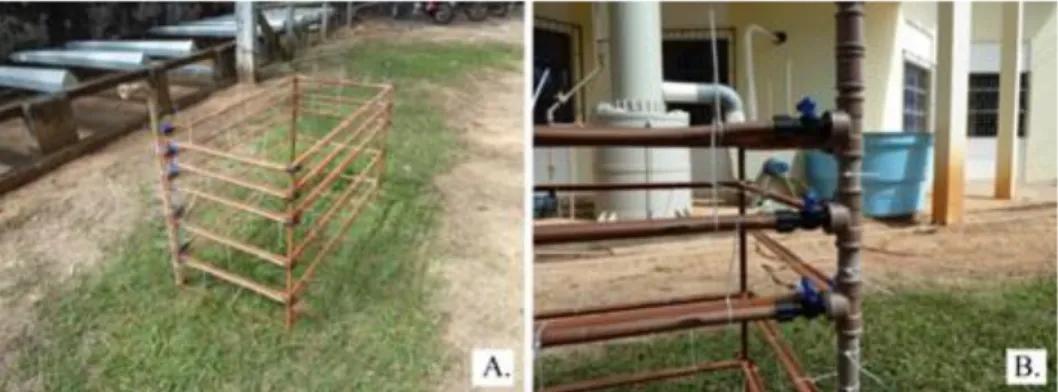
The same apparatus (Figure 1) also assessed the flow of submerged drippers, however, with emitters submerged in water. The metallic structure (Figure 2A) helped to maintain the same depth along dripline. The tank was equipped with four spillways so that water level could be kept constant, even after emitter discharge.
Drippers were submerged in the depths of 0.05, 0.15, 0.25, 0.45 and 0.65 m, corresponding to 0.49, 1.47, 2.45, 4.41 and 6.37 kPa of applied backpressure (hs). Initial drip tube connectors with
attached valves (Figure 2B) controlled the dripline at the depth to be tested.
FIGURE 2. Metal structure used to maintain emitters’ depth (A) and detail of the initial connector
valve used to control drip line flow (B)
Inlet pressure used were also of 80, 100, 120, and 150 kPa for driplines with Hydro PCND, and of 25, 50, 100 and 150 kPa for the others, with 4 replications. Sampled data were adjusted to the discharge equation of emitters under backpressure, as shown in Equation 3 (GIL et al., 2008; GIL et al., 2010; GIL et al., 2011).
(3)
In which,
Qsubmerse = average flow of the submerged emitter, L h-1;
hs = backpressure caused by the submersion level, kPa;
ksubsurface = subsurface proportionality constant, L h-1 kPa-x, and
xsubsurface = subsurface discharge exponent, dimensionless.
RESULTS AND DISCUSSION
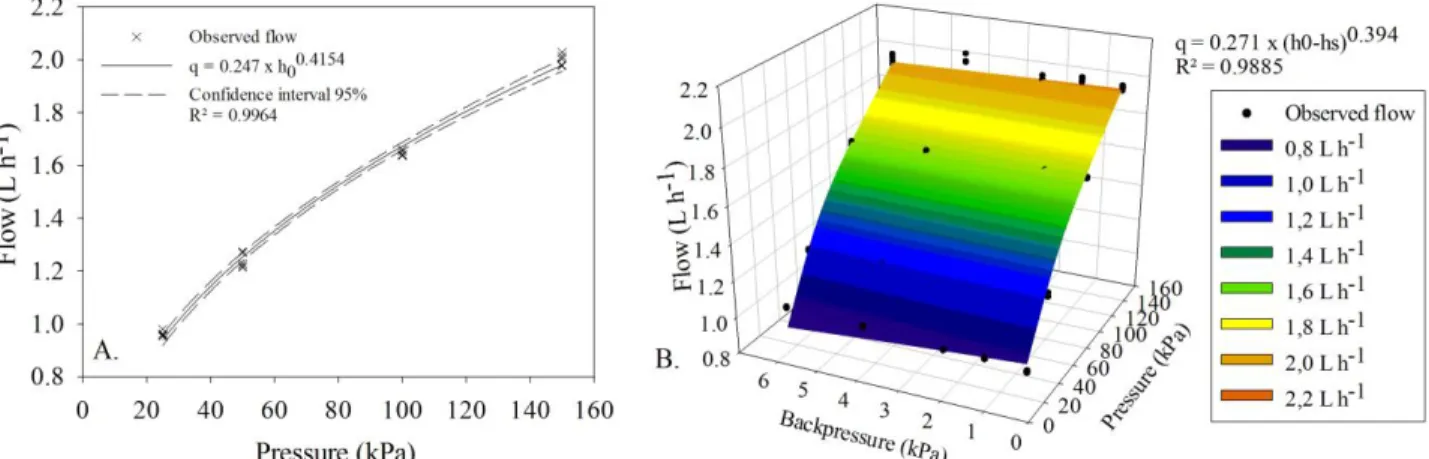
FIGURE 3. TalDrip pressure-flow relationship under surface (A) and submerged (B) applications.
The determination coefficient of pressure-flow model adjusted for TalDrip emitter was 99.64%. This emitter had a proportionality constant (k) of 0.247 L h-1 kPa-x and discharge exponent
of 0.4154, both different from the informed by the manufacturer’s catalog (0.555 and 0.460,
respectively). This discharge exponent classifies the emitter as turbulent flow and non-compensating (FRIZZONNE et al., 2012). The exponent x indicates flow regime and emitter type, and measures indirectly the flow variations with pressure. The x values typically range between 0 and 1, wherein a lower value denotes minor flow variations with pressure (MANGRIO et al., 2013). By backpressure action against emitter water outlet, both proportionality constant as emitter discharge exponent have been changed for TalDrip emitters ("k" from 0.247 L h-1 kPa-x to 0.271 L h-1 kPa-x, and "x" from 0.4154 to 0.394). The coefficient of determination was 98.85%, showing good adherence of the model to the data.
After regression analysis, JardiLine flow-pressure relationships were obtained under surface and submerged applications, such as shown in Figure 4.
FIGURE 4. JardiLine pressure-flow relationship under surface (A) and submerged (B) applications.
The coefficient of determination was 99.67% with pressure-flow equation parameter values of 0.5062 L h-1 kPa-x for "k" and a discharge exponent of 0.4331. The measured proportionality coefficient was different from that provided by the manufacturer (1.192). The same occurred from the discharge exponent (0.48), but closer than proportionality constant values. Therefore, we could classify TalDrip emitter flow regime as turbulent (FRIZZONE et al., 2012).
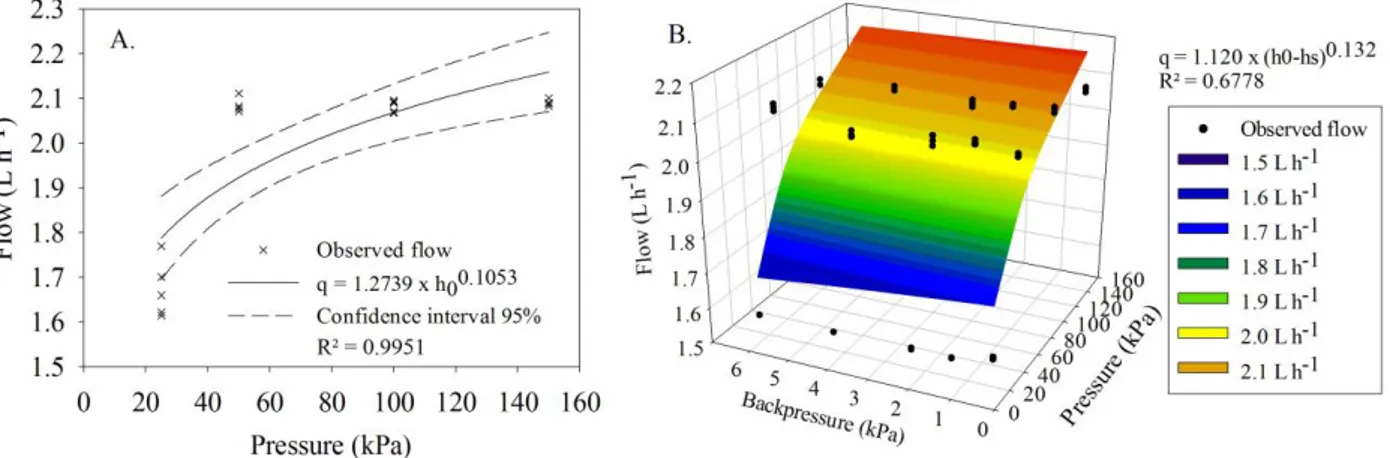
FIGURE 5. D5000 pressure-flow relationship under surface (A) and submerged (B) applications.
Even with a high determination coefficient (99.51%), Figure 5A shows that the flow-pressure relation in pressure-compensating emitters would not be well represented by a potential model if the emitters were tested at pressures outside auto-compensation range. In cases that uncompensated flow rates are much smaller than the flow that would occur within compensation range. Fitting the flow-pressure equation of a pressure-compensating dripper only within its pressure-compensation range would prevent the above fact, as done by PRADO et al. (2014).
According to the manufacturer, pressure-compensating emitter work range starts at 50 kPa, as seen in Figure 5A, tending to maintain flow from this pressure. The proportionality constant values (k) and the discharge exponent value (x) were 1.2739 L h-1 kPa-x and 0.1053, respectively. This value of x, near zero, confirms that emitter is a pressure-compensating one (FRIZZONE et al., 2012).
Contrary to what happened to D5000 in surface application, the flow-pressure model determination coefficient under submerged application was low (67.78%). It can be seen by analysis of Figure 5B, wherein the observed flow points only adhere well to the inlet pressure model of 100 kPa, whatever the pressure. Additionally, there was an increase in discharge exponent when submerged, from 0.1053 to 0.132, showing thus reduction in compensating flow effect with inlet pressure variation.
The flow behavior models as a function of emitter Hydro PCND pressure under surface and submerged applications are shown in Figure 6.
The discharge exponent and proportionality constant under surface application were 0.0044 and 2.4038L h-1 kPa-x, respectively. We also observed a good fit for the potential flow-pressure model because of a high determination coefficient value (99.23%).
It could have been observed since we did not test pressures from outside pressure-compensation range. This behavior would also occur even if flows out of pressure-compensation range were not very different from compensated flows, as verified by ALMEIDA et al. (2006) for dripper HPC manufactured by Bowsmith, pressure-compensating, with proportionality constant of 0.0974.
When submerged, then having backpressure acting at Hydro PCND dripline output, it showed, as occurred for D5000, greater discharge exponent (0.0269) compared to surface test (0.0044).
When submerged, flow data had greater variability (Figure 6A), which can be noted in Figure 6B. The response surface flat shape shows a pressure-compensating effect (Figure 6B); however, there was no good fit of observed data to the model, being evidenced by low R² (21.56%).
The increasing values of discharge exponent (x) from surface to submerged assessments in pressure-compensating emitters come from backpressure against emitter’s pressure-compensating mechanism, preventing it from reducing water discharge available area.
This would lead to a proportionality coefficient reduction in all cases. However, an increase was observed both for TalDrip and Jardiline emitters. Comparing emitter characteristic curves in surface and submerged applications, discharge exponent (x) reductions, as occurred for those two emitters, would also lead to reductions in proportionality constant, as shown by Equation 2; however, it has not occurred.
D5000 and Hydro PCND did not have reductions in proportionality constants when comparing both application conditions, even by raising discharge exponent in the submerged condition. It is noted in submerged conditions that discharge coefficients reductions generated greater impact on ksubsurface values than increases of them.
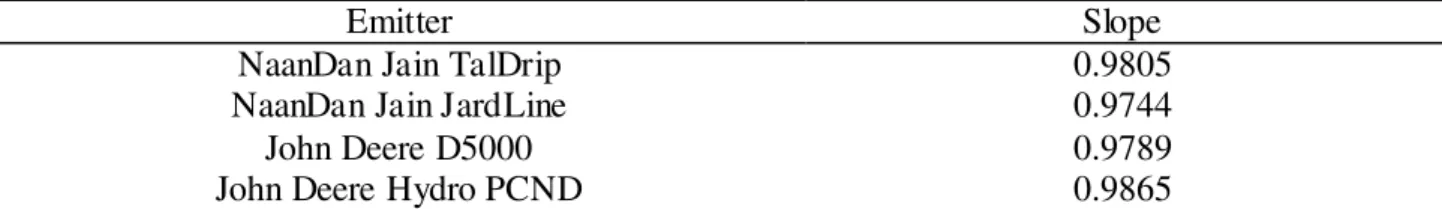
In addition, simple linear regression analysis was performed between the flows observed in surface and submerged conditions, for each of the emitters. Table 1 shows the slope obtained considering a line constructed from the origin of the Cartesian plane. In this analysis, the submerged flow was treated as a dependent variable.
TABLE 1. Simple linear regression slope between surface and submerged flows for each emitter.
Emitter Slope
NaanDan Jain TalDrip 0.9805
NaanDan Jain JardLine 0.9744
John Deere D5000 0.9789
John Deere Hydro PCND 0.9865
From the analysis of Table 1, it is observed that the flow rates of all tested drippers, when submerged in water, were lower than when operating at atmospheric conditions. GIL et al. (2008) obtained a reduction of non-compensating drippers’ flow when buried in sandy and loamy soils, not observing the same behavior with pressure-compensating emitters. GIL et al. (2011), on the other hand, obtained results which support those in this study, in which both using pressure-compensating and non-pressure-compensating emitters, flow reduction was observed when the emitters are subjected to backpressure in relation to surface application.
CONCLUSIONS
The emitters had their proportionality constants and discharge exponents altered in submerged application in water, representing the backpressure effect. Non-pressure-compensating emitters had their discharge exponent decreased, while in the pressure-compensating it increased.
The D5000 and Hydro PCND emitters, under the backpressure effect, had their discharge exponents increased, which infers lower flow compensation capacity due to the action of backpressure on the flow regulation mechanism.
The emitter flow was reduced by the effect of backpressure, in all tested pressures.
REFERENCES
ALMEIDA, A.M.; SAMPAIO, S.C.; SUSZEK, M. Comportamento hidráulico de gotejadores em linha lateral de irrigação. Varia Scientia, Cascavel, v.6, n.11, p.129-140, 2006.
COELHO, E.F.; COSTA, E.L.; BORGES, A.L.; ANDRADE, T.M.; PINTO, J.M. Fertirrigação. Informe Agropecuário, Belo Horizonte, v.31, n.259, p.58-70, 2010.
FRIZZONE, J.A.; FREITAS, P.S.L.; REZENDE, R.; FARIA, M.A. Microirrigação: gotejamento e microaspersão. Maringá: Eduem, 2012. 356 p.
GIL, M.; RODRÍGUEZ-SINOBAS, L.; JUANA, L.; SÁNCHEZ, R.; LOSADA, A. Emitter discharge variability of subsurface drip irrigation in uniform soils: effect on water-application uniformity. Irrigation Science, New York, v.26, n. 6, p.451-458, 2008.
GIL, M.; RODRÍGUEZ-SINOBAS, L.; SÁNCHEZ, R.; JUANA, L. Evolution of the spherical cavity radius generated around a subsurface drip emitter. Biogeosciences, Orono, v.7, n.6, p.1935-1958, 2010.
GIL, M.; RODRÍGUEZ-SINOBAS, L.; SÁNCHEZ, R.; JUANA, L. Procedures for determining maximum emitter discharge in subsurface drip irrigation. Journal of Irrigation and Drainage Engineering, New York, v.137, n.5, p.287-294, 2011.
KANDELOUS, M.M.; SIMUNEK, J. Numerical simulations of water movement in a subsurface drip irrigation system under field and laboratory conditions using HYDRUS-2D. Agricultural Wate r Management, Amsterdam, v.97, n.7, p.1070-1076, 2010.
KANDELOUS, M.M.; SIMUNEK, J.; VAN GENUCHTEN, M.T.; MALEK, K. Soil water content distributions between two emitters of a subsurface drip irrigation system. Soil Science Society of America Journal, Madison, v.75, n.2, p.488-497, 2011.
LIMA, L.A.; BÍSCARO, G.A.; GEINSENHOFF, L.O.; REIS, J.B.R.S. Automação em irrigação. Informe Agropecuário, Belo Horizonte, v.31, n.259, p.71-79, 2010.
MANGRIO, A.G.; ASIF, M.; AHMED, E.; SABIR, M.W.; KHAN, T.; JAHANGIR, I. Hydraulic performance evaluation of pressure compensating (pc) emitters and micro-tubing for drip irrigation system. Science Technology and Development, Islamabad, v.32, n.4, p.290-298, 2013.
PRADO, G.; NUNES, L.H.; TINOS, A.C. Avaliação técnica de dois tipos de emissores empregados na irrigação localizada. Revista Brasileira de Agricultura Irrigada, Fortaleza, v.8, n.1, p.12-25, 2014.
WARRICK, A. W.; SHANI, U. Soil-limiting flow from subsurface emitters. II: Effect on