ISSN: 1809-4430 (on-line) www.engenhariaagricola.org.br
2
Federal University of Lavras/ Lavras - M G, Brazil.
3
University of São Paulo - USP/ Piracicaba - SP, Brazil. Received in: 3-24-2017
Accepted in: 1-30-2018
Doi:http://dx.doi.org/10.1590/ 1809-4430-Eng.Agric.v38n2p 284-292/ 2018
ARTIGO TÉCNICO
ENERGY EFFICIENCY OF A CENTER PIVOT IRRIGATION SYSTEM
Brenon D. S. Barbosa
1*, Alberto Colombo
2, João G. N. de Souza
2, Victor B. da S. Baptista
2,
Ana C. S. de Araújo
31*
Corresponding author. Federal Un iversity of Lavras/ Lavras - M G, Bra zil. E-ma il: b.d [email protected]
KEYWORDS
energy performance,
pumping unit,
performance
indicators.
ABSTRACT
This study aimed to evaluate the energy efficiency of a center pivot irrigation system
operating in a terrain of variable topography. Values of Pumping Energy Efficiency
(PEE), Supply Energy Efficiency (SEE), Global Energy Efficiency (GEE) and Specific
Energy (Es in kWh m
-3) computed at 18 different angular positions of the lateral line were
used as energy efficiency indicators. An ultrasonic flow meter, digital pressure
transducers and a power quality analyzer were used in order to evaluate hydraulic (total
system flow-Q and total dynamic head-TDH) and electrical parameters (active electrical
power - AEP) of the center pivot pumping unit that were required for evaluating the
selected energy efficiency indictors. Topographic elevations of the water source, the
pumping unit and of the center lateral line were also determined. For the center pivot
lateral line, it was necessary to determine, at the 18 angular positions considered, the
altitude of the track of each center pivot support tower. Results indicated that currently,
even after more than 10000h of use, the center pivot system operates with satisfactory
energy efficiency, as indicated by an average GEE value equal to 42.5%, that is classified
as “good”. Statistical analysis indicated that the topographic dispositio
n of the center pivot
lateral line, as characterized by a uphill or downhill disposition, resulted on different PEE,
SEE and GEE values, while the average Es value (0.42 kWh m
-3) was not affected by the
lateral line disposition.
INTRODUCTION
In the near future due to water and energy constraints, production costs in agricultural areas tend to increase, and with this there will be the need to explore new technologies and methodologies for the management of irrigation systems (Evans & King, 2012).
In Bra zil, the use of center pivot has been widely diffused on agricultural irrigated areas due to several advantages (automation, uniformity, reduction of manpower) that this equipment provides in relation to other types of irrigation system. Nowadays, there are 1.28 million hectares irrigated by center pivot system in Bra zil. This represents an increase of 43.3% in relat ion to the 2006 center pivot irrigated area in Bra zil (Gu imaraes & Landau, 2016).
In this context of irrigated agriculture e xpansion and need of water and energy efficiency monitoring,
diffe rent energy efficiency indicators were proposed (Rodríguez Día z et a l., 2011; Córcoles et al., 2010). According to Tarjuelo et al. (2015), it is important to imple ment an energy evaluation routine not only to determine the energy effic iency of an irrigation system, but also to assist in the decisions ma king process regarding improve ments in the water distribution system, in order to optimize energy consumption and economic planning.
For the specific case of center pivot irrigation systems in Bra zil, Ce zar-de-Lima et al. (2008) and Schons et al. (2012) used a specific normalized energy consumption inde x that is e xpressed in kWh.mm−1.ha−1.100m−1. Th is inde x represents the amount of active electrical energy (kWh) that is required in order to pump a norma lized volu me o f water (mm.ha = 10m3) with an standart values of total dynamic head (100m).
of a Global Energy Effic iency (GEE) indicator. This indicator is the result of the product of two other energy efficiency ind icators: Pu mping Energy Efficiency (PEE) and Supply Energy Efficiency (SEE). The Pu mping Energy Effic iency (PEE) is related to the effic iency of the pumping unit (electric motor efficiency mu ltiplied by centrifugal pu mp effic iency). Supply Energy Effic iency (SEE) is related to the design and management of the water distribution system.
The Specific Energy (Es in kWh m-3) index is wide ly used to evaluate the energy performance of water distribution systems of diffe rent configurations (Córco les et al., 2010; Abadia et al., 2010). The ES represents the amount of active e lectrica l energy (kWh) that is required in order to pump a normalized volume of water (1,0 m3). For practical p roposes , the amount of electric ity energy consumed by an irrigation system, that is measured in kWh, can be determined by multip lying the total volume of irrigated water pumped in the cropped area ( m3) by the Specific Energy value (Es, in kWh m-3) of the pumping unit. According to Urrestarazu & Burt (2012) reduction on the amount of energy (kWh) consumed for pumping irrigation water in a irrigation system can be achieved by both methods: (i) reduction in the pumped water volu me (m3); and (ii) reduction on the pumping unit Specific Energy (kWh m-3) value.
Ce zar-de-Lima et a l. (2008) pointed out that indicators of irrigation systems energy consumption mu st be in some way norma lized, a llo wing the co mparison of diffe rent irrigation systems, installed in areas of different
topographic conditions. Abadia et al. (2010), Abadia et al. (2008) also warn that, for the particular case of irrigation systems operating in terrains with variable topographic conditions, energy efficiency indicators should be analyzed with caution, as this analysis may lead to errors of interpretation and, therefore, in non-representative GEE values.
The aim of this study was to evaluate the energy efficiency use of a center pivot irrigation system that operates in a terrain of varied topography by analyzing the behavior of different energy efficiency indicators (PEE, SEE, GEE, Es) that were adapted for this type of pressurized irrigation system.
MATERIAL AND METHODS
Characterization of the area
The study was carried out in a center pivot irrigation equip ment located at the Fazenda Invernada in the municipality of Bo m Sucesso-MG, with UTM coordinates of 23K 50940 2.45 m E, 7662306.20 m S. Equipment Characteristics
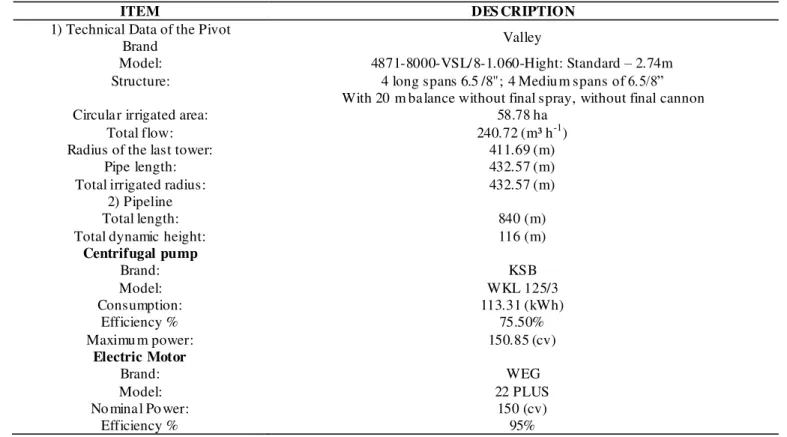
The technical characteristics of the center pivot system used in this study, as described in the original design datasheet of the manufacturer’s, are reproduced in Table 1.
TABLE 1. Characteristics of center pivot system as described at the original design datasheet.
ITEM DES CRIPTION
1) Technical Data of the Pivot
Brand Valley
Model: 4871-8000-VSL/ 8-1.060-Hight: Standard – 2.74m Structure: 4 long spans 6.5 /8"; 4 Mediu m spans of 6.5/8”
With 20 m ba lance without final spray, without final cannon
Circula r irrigated area: 58.78 ha
Total flow: 240.72 (m³ h-1)
Radius of the last tower: 411.69 (m)
Pipe length: 432.57 (m)
Total irrigated radius: 432.57 (m)
2) Pipeline
Total length: 840 (m)
Total dynamic height: 116 (m)
Centrifugal pump
Brand: KSB
Model: WKL 125/3
Consumption: 113.31 (kWh)
Efficiency % 75.50%
Maximu m power: 150.85 (cv)
Electric Motor
Brand: WEG
Model: 22 PLUS
No mina l Po wer: 150 (cv)
Along the center pivot lateral line, at the outlet end of ¾”flexible drop pipes that are regularly spaced by approximately 2,3, there are 189 Senninger R Iwob type emitters. The pressure head at the inlet section of each one of these emitters is controlled by a 10 psi nomina l pressure regulating valve (PRV), that according to the manufacturer specifications (Senninger, 2017) operates adequately in pressure range from 69 kPa (hPRV = 7.02 m) up to 690 kPa (70.36 m).
Topography of the terrain
The planialt imetric survey of the irrigated area and the elevations of the pumping unit and the water supply level were determined with the aid of a GPS device of Topcom brand, Hyper Lite + mode l (accuracy of 5 mm).
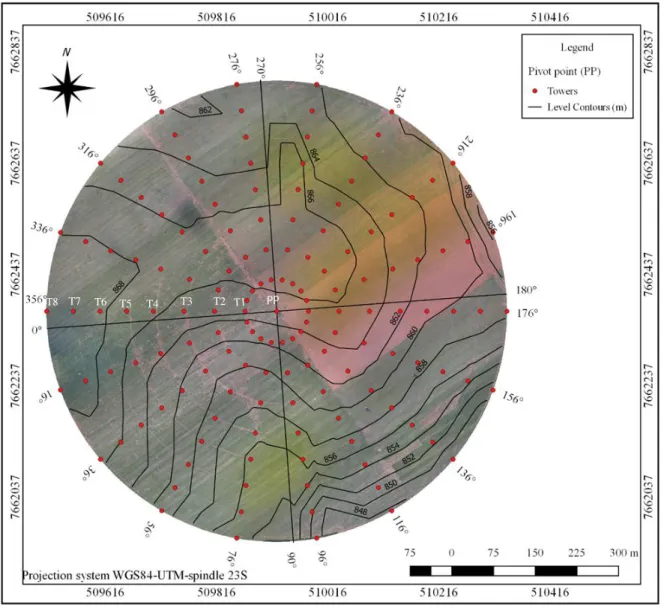
In order to generate topographic level curves on the irrigated area, the topographic data from this survey was submitted to an interpolation process provided by the QGIS software, 2.12 version. As indicated in Figure 1, the 18 different angular position of the center pivot latera l line, that were considered in this study represent different angular positions (α) assumed by the mobile lateral line along its rotation (00 < α ≤ 3600) around the fixed p ivot point, located at the center of the irrigated area. These angular positions were determined by the different positions assumed in the field by each one the 8 mobile towers (T1 to T8) used to move the lateral line around the pivot point.
T2 T3 T4 T5 T6 T7 T8
FIGURE 1. Angular positions of the center pivot movable latera l line.
Calculation of Global Energy Efficiency (GEE)
Abadia et al. (2008) define the overall en ergy efficiency of an irrigation system (GEE) as the ratio between the required energy (Er) for irrigation and the actual energy consumed (Ec ) in the irrigation process. For each one of the 18 angular position (α) assumed by the moving lateral, the GEE values were co mputed as percentage (%), based on [eq. (1)] the product of two efficiency components: the supply energy efficiency (SEE) and the pumping energy effic iency (PEE).
(1) where,
GEE(α) - global energy efficiency refe rring to the angular position (α),%;
PEE(α) - pu mping energy efficiency re ferring to the angular position (α), decimal,
The energy efficiency of the pumping unit (PEE) is e xpressed by the ratio between the delivered hydraulic power (PH) and the active electrical power (A EP), as
e xpressed by [eq. (2)] (Abadia et a l., 2008):
(2) where,
PH(α) - hydraulic powe r, kW;
AEP(α) - active electrical power refe rring to the angular position (α), kW;
Q(α) – total system flow measured at the angular
position (α), m³ s-1
;
ρ - water specific mass, kg m-³; g - accele ration of gravity, 9.81m s-2,
TDH (α) - total dynamic head measured at the
angular position (α), m.
Total system flow values (Q(α)) were determined using a portable FMS 175 brand ultrasonic flowmeter with built-in data logger. The flow meter was installed on the pump unit suction pipe, observing minimu m va lues of straight-pipe runs upstream and downstream fro m sensitive flow e le ments. According to the manufacturer’s
specifications, for flo w velocity above 0.18 m/s, the equipment used has an accuracy of 1%, with ± 0.5% linearity and ± 0.2% repeatability. Pressure values at inlet and outlet sections of the pump were measured. Absolute pressure values at the pump inlet section were measured with an Instrutherm pressurure transducer, VA-318 model, connected to a VDR-920 d igital reader. A digita l Instrutherm brand, PS100-20 BAR model, pressure head transducer, with a 20 bar ma ximu m capacity, connected to a digital reader, Instrutherm M RV-87 mode l, was used for recording pressure head values at the inlet section of the pump. Both digital readers are equipped with a RS232 output that was used to store the measured pressure values in a co mputer file.
TDH values were obtained by correcting the diffe rence between relative pressure head values taken at the pump outlet section (PLout/) and at the pumping inlet
section for diffe rences on water velocity head values and elevation values in these sections [eq. (3)]. Re lative pressure head values at the inlet pumping section were obtained by subtracting from the absolute pressure head values mensured at this section (PLentrance/γ) the absolute
value of the atmospheric pressure (Patm/γ) observed at the
same time in which the inlet pressure measurement we re taken.
)
Z
(Z
.
2
v
v
γ
P
γ
PL
γ
PL
TDH
outlet inletg 2 inlet 2 outlet atm ) ( inlet ) ( ) ( ) ( ) ( outlet
(3)
where,
PLoutlet (α) - pressure at the outlet of the pump in the angular position (α), kPa; PLentrance (α) - absolute pressure at the pump entrance in the angular position (α), kPa; Patm - at mospheric pressure, 91.39 kPa;
Voutlet (α) -averange water flow veloc ity at the pump outlet section, m.s-1;
Vinlet (α) - averange water flo w veloc ity at the pump inlet section, m.s-1;
Zinlet (α - geometric e levation of the absolute pressure sensor at the pump in let, m;
Z outlet (α) - geometric e levation of the effect ive pressure sensor at the pump outlet, m,
– irrigation water specific we ight, kN.m-3.
Active electrica l powe r values (A EP) were measured with a Flu ke® power quality analyze r, 435 -II model, with 0.5% accuracy, with built-in data logger. The power quality analy zer was installed in a three-phase three-wire connection at the starter protection system of the 110 kW nomina l power asynchronous motor used to drive the center pivot pump.
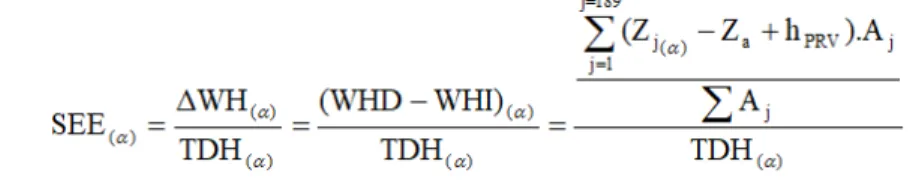
Supply Energy Efficiency (SEE) values are directly related to the effects of topographic variations on the spatial distribution of the ratio of required pressure available p ressure at the irrigated area. In order to apply the methodology proposed by Abadia et al. (2008) to compute SEE values based on the ratio of system water head balance (ΔWH) and TDH, each one of the 18 center pivot lateral line angular positions of the was considered as
(4) where,
∆WH (α) - balance of water head in the system, m;
WHD (α) - required water head in the irrigated area at the angular position (α), m;
WHI (α) - water head injected into the system in the angular position (α), m;
Zj - geometric e levation of each e mitter (j) installed on the lateral line, m;
hP RV - minimu m pressure head required by the pressure regulating valve (PRV), 7.02 m;
Aj - area irrigated the emitter identified by the inde x j, m²,
Za - geo metric elevation of the water supply level of the irrigation sys tem, m.
∆WH (α) values were computed considering the geometric elevation of water source level (Za = 806 m) and the minimu m pressure head value (hPRV = 7.02 m) required by the pressure regulator valve model (10psi or 69kPa) used on the emitters installed along the lateral line length. For each angular position (α), e mitter elevation values (Zj, α) we re co mputed based on the topographic elevation of each one of the eight A - fra med mobile towers (T1 to T8) and on the distance among then:
(5)
where,
Ze j, i (α) - elevation of the emitter (j) in the tower (i), m;
(Zti-1) (α) - wheel track e levation, at angular position α of the tower demarking the inlet end of the ith span, m;
rgj - distance fro m center pivot in let to the inlet
point of inde x j e mitter’s drop pipe, m;
rti-1 - wheel track radius of the tower demarking the
inlet end of the inde x i span, m;
In [eq. (5)] the constant 2.15 m represents the height of the water entrance point in the pressure regulating valves installed in each e mitter.
Es calculation
At each angular position (α), simultaneous
measured values of active electric power ( A EP in kW)
and total flow system flow ( Q in m3s -1) were used to determine specific energy consumption values (Es in kWh m-3) as indicated in In [Eq. (5)] (Vihola inen et al. 2012, Urrestarazu & Burt (2012), and Schons et al. (2012)).
(6) where,
Es(α) - specific consumption refe rring to angular
position (α), kW h m-3
.
RES ULTS AND DISCUSS ION
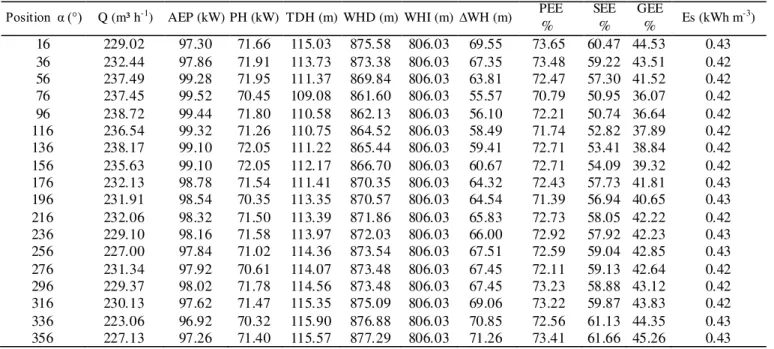
TABLE 2. Co mputed values of the energy effic iency indicators PEE, SEE, GEE and Es.
Position α (°) Q (m³ h-1) AEP (kW) PH (kW) TDH (m) WHD (m) WHI (m) ∆WH (m) PEE SEE GEE Es (kWh m-3)
% % %
16 229.02 97.30 71.66 115.03 875.58 806.03 69.55 73.65 60.47 44.53 0.43 36 232.44 97.86 71.91 113.73 873.38 806.03 67.35 73.48 59.22 43.51 0.42 56 237.49 99.28 71.95 111.37 869.84 806.03 63.81 72.47 57.30 41.52 0.42 76 237.45 99.52 70.45 109.08 861.60 806.03 55.57 70.79 50.95 36.07 0.42 96 238.72 99.44 71.80 110.58 862.13 806.03 56.10 72.21 50.74 36.64 0.42 116 236.54 99.32 71.26 110.75 864.52 806.03 58.49 71.74 52.82 37.89 0.42 136 238.17 99.10 72.05 111.22 865.44 806.03 59.41 72.71 53.41 38.84 0.42 156 235.63 99.10 72.05 112.17 866.70 806.03 60.67 72.71 54.09 39.32 0.42 176 232.13 98.78 71.54 111.41 870.35 806.03 64.32 72.43 57.73 41.81 0.43 196 231.91 98.54 70.35 113.35 870.57 806.03 64.54 71.39 56.94 40.65 0.43 216 232.06 98.32 71.50 113.39 871.86 806.03 65.83 72.73 58.05 42.22 0.42 236 229.10 98.16 71.58 113.97 872.03 806.03 66.00 72.92 57.92 42.23 0.43 256 227.00 97.84 71.02 114.36 873.54 806.03 67.51 72.59 59.04 42.85 0.43 276 231.34 97.92 70.61 114.07 873.48 806.03 67.45 72.11 59.13 42.64 0.42 296 229.37 98.02 71.78 114.56 873.48 806.03 67.45 73.23 58.88 43.12 0.42 316 230.13 97.62 71.47 115.35 875.09 806.03 69.06 73.22 59.87 43.83 0.42 336 223.06 96.92 70.32 115.90 876.88 806.03 70.85 72.56 61.13 44.35 0.43 356 227.13 97.26 71.40 115.57 877.29 806.03 71.26 73.41 61.66 45.26 0.43
According to the data flow described in Tab le 2, it is possible to note that in the regions where the uphill regions was is determined when the elevation of last tower is greater than the elevation of pivot point (865 m), which comprises the angular positions (α) of 316 ° ≤ α ≤ 36 ° (Figure 3), the flo w values are sma lle r than the downhill regions (angular positions (α) of 56 ° ≤ α ≤ 296 °), where the elevation of the last tower was less than the pivot point elevation (865 m).
Pumping Energ y efficiency (PEE)
The observed PEE values vary in the 18 angular positions studied (Table 2). The average value found during the lateral rotation was 72.57% (c lassified as e xcellent according to Abadia et al. (2008)), with a ma ximu m va lue recorded of 73.65%, re ferring to the position of 16° (uphill) and the lower value of 70.79%, referring to the angular position of 76° (downhill), according to Table 1.
The PEE values have this behavior due to alterations in the re lie f (downhill and uphill) and also due to oscillation in the flow va lues in function of the topography and probably the flow are a ltered by the wea r of the pressure regulating valves due to the time of use. Such changes in the flow values reflect in the efficiency of the centrifugal pump according to its performance characteristic curve (Figure 2).
75
75.5
76
76.5
77
210
220
230
240
250
260
E
ff
icie
nc
y
(%
)
Flow (m³.h
-1)
Project
Catalog
Estimated
FIGURE 2. Perfo rmance characteristic curve of the centrifugal pu mp KSB WKL 125/3.
Abadia et al. (2008) in their study found a PEE value equal to 63.8%. These authors attributed this values to the capacity of the pumping unit to provide a flow and pressure head constant. This study, it observed that the values of Q showed a ma ximu m variation of 7% and a ma ximu m of 6% for TDH, and according to the characteristic curve of the centrifugal pu mp in studing (Figure 2), these pairs of points are close to the highest efficiency points, corroborating with the in formation described above by Abadia et al. (2010).
The analysis of the PEE adequacy value is relative ly simple and when there is no equipment installed in the pumping unit such as frequency inverters and cable efficiency values, the PEE can be expressed by the product of efficiency of the pump and the electric motor, in which “theoretical” PEE values can be calculated from pump and motor performance data taken from commerc ial catalogs (Moreno et al., 2010). However, Urrestarazu & Burt (2012) e mphasize the importance of verifying in the field
the validity of such “theoretical” values.
Thus, the analysis of the adequacy of specific energy consumption values must necessarily consider the adequacy of the observed value of active electric power (kW) required to the activation of the pumping unit operating at the desired flow rate. For a same pumped flo w value, the active electrical power required for activation of a pumping unit (kW) it’s affected by both the total TDH value supplied by the pump and the PEE value.
Therefore, for the sa me pu mp value, any analysis of the reduction possibility in the observed value of specific energy consumption (Es in kWh m-3) is necessarily conditioned: (i) to the analysis of the adequacy of the observed value of TDH provided by the pump ; (ii) to the analysis of the adequacy of the PEE va lue of the motor-pump set used.
Luc et a l. (2006) report that the PEE may have a deviation in its values due to the interference of other factors such as TDH or motor and pump effic iency, which corroborates with the data obtained here in this study where TDH (Table 2) and the pump and motor e ffic iency
(Figure 2) have their values changed in function of the angular position of the latera l line in the a rea (Table 2). This behavior is also observed in this s tudy through a quadratic polynomial regression analysis of the data described in Table 1 of TDH corre lated with PEE, resulting in a R² value of 0.49. Urrestarazu & Burt, (2012) report that for operating conditions of pumping units in Ca lifornia the factor that most correlates with PEE is TDH. When the PEE is correlated with Q values, the obtained value of R² is only 0.25.
The PEE can be classified according to the methodology proposed by Abadia et al. (2008) adapted fro m Pelli & Hit z (2000), which varies fro m unacceptable efficiency (PEE <45%) up to e xcellent (PEE> 65%). Supply Energy Efficiency (S EE)
The average value of SEE in all the tested positions was 57%, registering a ma ximu m value of 61.66%, referring to the angular position of 356° (uphill) (Figure 3), region with the highest WHD value due to greater geometric e levation in irrigated area (Figure 2).The lowest value of SEE was 50.7% for angular position of 96° (downhill) (Figure 3), position with lowe r WHD value due to the lower geo metric elevation.
Abadia et al. (2012) report that SEE va lues are influenced by a pumping of water with e xcessive pressure head to regions downhill slopes, thus generating a waste of energy. The verification of lea ks in lateral and ma inline pipe should also be verified, as it influences the SEE of system.
845
850
855
860
865
870
875
30%
40%
50%
60%
70%
80%
16 36 56 76 96 116 136 156 176 196 216 236 256 276 296 316 336 356
E
levat
ion
(
m
)
E
ff
icie
nc
y
(%
)
Angular position of the movable lateral line (degree)
PEE GEE SEE Pivot point Last tower
FIGURE 3. PEE, SEE and GEE values in function of the terrain topography.
Global Energy Efficiency (GEE)
For the GEE values, according to the data in Table 2 and Figure 3, there was a variation between ma ximu m and min imu m values of 7%, with the ma ximu m value being 45% for uphill region (356°) and minimu m of 36 % for the angular position 76° (downhill). According to the GEE qualification proposed by Abadia et al. (2008) adapted fro m Pelli & Hit z (2000) the average value of 42.52% is classified as “excellent”. This behavior of the GEE (Figure 3) fo llo ws the PEE and SEE behaviors computed during lateral line rotation, since the energy e xcess applied in the region where is downhill causes the efficiency of the system to reduce.
Specific consumption (Es)
The specific consumption data (Es) of the center pivot pumping unit studied here presented an average value of 0.42 kWh m-3 (Table 2).Co mparing the positions of the lateral line in area irrigated by center pivot, we can see higher values of Es for areas of higher elevation in the last tower (ma ximu m value equal 0.43 kWh m-3 for the 336° position) and smalle r Es values for lower altitude area (0.416 kWh m-3 referring to the 96° position). Schons
et al. (2012) find an estimated value of 0.41 kWh m-3 for a center pivot in the state of Rio Grande do Sul. These authors also report that Es can be used to compare projects within the same irrigation system, and to evaluate the efficiency and depreciation of equip ment.
Plappally & Lienhard, (2012) found Es values in water pump ing stations. For the specific case of irrigation, these authors present values varying from 0.32 to 1.1 kWh m-3 for the localized irrigation system, and fro m 0.6 to 1.3 kWh m-3 for sprinkler irrigation system, for the case of the center pivot system to Australia conditions operating at a pressure head of approximately 400 kPa, the approximate Es value was 0.18 kWh m-3. However, the comparison of specific energy consumption values for referring to diffe rent pumping stations should be made with caution. Energy indicators x Topography of the terrain
The PEE, SEE, GEE and Es indicators were submitted to the statistical Student t test at significance level of 5%, as described in Table 3, in function of the angular position (uphill and downhill) of the latera l line.
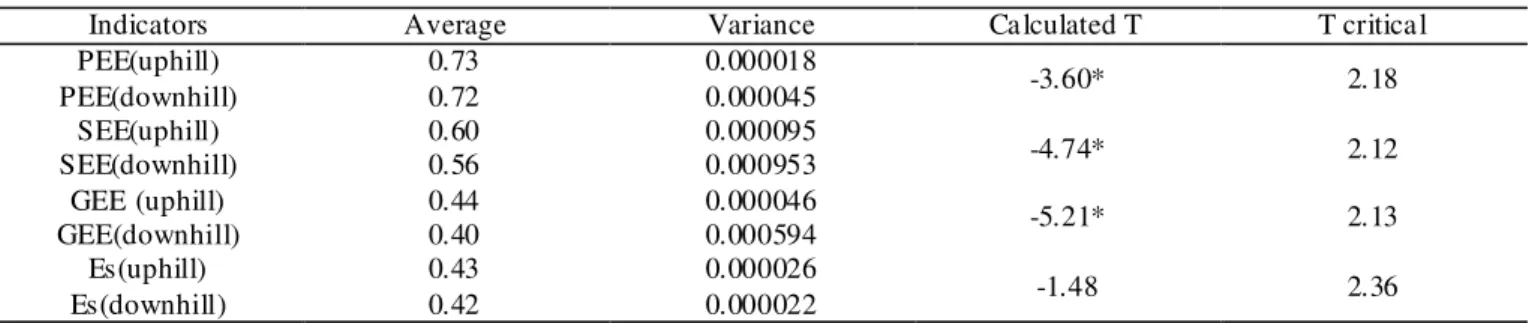
TABLE 3. Va lues of statistical Student test applied to the energy effic iency indicators PEE, SEE, GEE and Es.
Indicators Average Variance Ca lculated T T critica l
PEE(uphill) 0.73 0.000018
-3.60* 2.18
PEE(downhill) 0.72 0.000045
SEE(uphill) 0.60 0.000095
-4.74* 2.12
SEE(downhill) 0.56 0.000953
GEE (uphill) 0.44 0.000046
-5.21* 2.13
GEE(downhill) 0.40 0.000594
Es(uphill) 0.43 0.000026
-1.48 2.36
Es(downhill) 0.42 0.000022
It was observed the average values of PEE, SEE and GEE differ statistically for uphill and downhill latera l line positions.
The average values of Es it was considerate statistically equal for the angular positions in uphill and downhill. This observation differs fro m that made by Schons et al. (2012) where these authors relate values of Es only in function of the topography. Thus, the Es values may be more related to other factors, and accordin g to Luc et al. (2006) who analyzed a group of 115 pump ing units with a capacity greater than 80 m³.h-1, and found that there is a linear relat ion with determination inde x (R²) equal to 0.98 of the Es values with the TDH va lues.
CONCLUS IONS
It was possible to estimate the energy effic iency through the indicators adapted to the center pivot irrigation system.
The periodic monitoring of the center pivot irrigation system is essential for ma intaining the energy efficiency leve ls as appropriate.
ACKNOWLEDGMENTS
We would like to thank the Itograss Agrícola Ltda for assigning the equipment for the study. And we thank to FAPEMIG and CNPq for the scholarships.
REFERENCES
Abadia R, Roca mora C, Vera J (2012) Energy effic iency in irrigation distribution networks II: Applications. Biosystems engineering, 111(4):398-411. DOI: http://dx.doi.org/10.1016/j.biosystemseng.2012.01.007 Abadia R, Roca mora C, Ruiz A, Puerto H (2008) Energy efficiency in irrigation distribution networks I: theory. Biosystems engineering 101(1):21-27. DOI:
http://dx.doi.org/10.1016/j.biosystemseng.2008.05.013 Abadia R, Roca mora MC, Córcoles JI, Ruiz-Canales A, Martinez-Ro me ro A, Moreno MA (2010) Co mparat ive analysis of energy effic iency in water users associations. Spanish Journal of Agricultura l Research 8(S2):134-142. DOI: http://dx.doi.org/10.5424/sjar/201008S2-1356 Ca mpana S, Oliveira Filho D, Soares AA (2000) Inversores de freqüência: u ma a lternativa para
racionalização do uso da energia elétrica e m sistemas de irrigação pivô central. In : Encontro de Energ ia no Meio Rura l. Available in :
http://www.proceedings.scielo.br/scielo.php?script=sci_art text&p id=MSC0000000022000000200029&lng=en&nrm =abn. Accessed: 3 Jan, 2018.
Ce zar-de-Lima A, Fiet z CR, Ca macho JR (2008) Flujo energético e indicadores de efic iencia en pivotes centrales de riego. Agrociencia 42(8):869-880.
Córcoles JI, Juan JA de, Ortega JF, Ta rjue lo JM, Moreno MA (2010) Management evaluation of Water Users Associations using benchmarking techniques. Agricultural Water Management 98(1):1-11. DOI:
http://dx.doi.org/10.1016/j.agwat.2010.07.018 Evans RG, King BA (2010) Site-specific sprinkler irrigation in a water limited future. In: Nat ional Decennial Irrigation Conference. Phoenix, A me rican Society of
Agricultural and Biologica l Engineers, Proceedings… DOI: http://dx.doi.org/10.13031/ 2013.35829
Gu ima raes DP, Landau EC (2016) Levantamento da agricultura irrigada por pivôs centrais no Brasil e m 2013. Sete Lagoas, Embrapa M ilho e Sorgo. (Infoteca-E) Luc JP, Tarhouni J, Ca lvez R, Messaoud L, Sablayro lles C (2006) Pe rformance indicators of irrigation pump ing stations: application to drill holes of minor irrigated areas in the Ka irouan plains (Tunisia) and impact of malfunction on the price of water. Irrigation and drainage 55(1):85-98. DOI: http://dx.doi.org/10.1002/ird.210
Moreno MA, Córcoles JI, Tarjuelo JM, Ortega JF (2010) Energy effic iency of pressurised irrigation networks managed on-demand and under a rotation schedule. Biosystems engineering 107(4):349-363. DOI:
http://dx.doi.org/10.1016/j.biosystemseng.2010.09.009 Pelli T, Hit z HU (2000) Ene rgy indicators and savings in water supply. Journal-A merican Water Works Association 92(6):55-62.
Plappally AK, Lienhard V (2012) Energy require ments for water production, treatment, end use, rec la mation, and disposal. Renewab le and Sustainable Energy Revie ws 16(7):4818-4848. DOI:
http://dx.doi.org/10.1016/j.rser.2012.05.022
Rodrígue z Día z JA, Ca macho Poyato E, Blanco Pé re z M (2011) Evaluation of water and energy use in pressurized irrigation networks in Southern Spain. Journal of Irrigation and Drainage Engineering 137(10):644-650. DOI:
https://doi.org/10.1061/(ASCE)IR.1943-4774.0000338 Santos Lima A dos, Zocoler JL, Jadoski SO, Maggi MF, Amarante RR do (2015) Dese mpenho Operacional no Bo mbea mento em Pivô Centra l utilizando Inversor de Frenquência. Bra zilian Journal o f Applied Technology for Agricultural Sc ience/Revista Brasile ira de Tecnologia Aplicada nas Ciências Agrárias 8(2):51-61.
Schons RL, Robaina A D, Peiter Márc ia X (2012) Setting efficiency indicators for center p ivots. Engenharia Agrícola 32(3):459-466. DOI:
http://dx.doi.org/10.1590/S0100-6916201200030000 Senninger. Pressure relates to flow. Avaliable in :
http://www.senninger.com/sites/senninger.hunterindustries .com/files/infographic-pressure-regulation.pdf. Accessed: Nov 8, 2017.
Tarjue lo JM, Rodriguez-Diaz JA, Abadía R, Ca macho E, Roca mora C, Moreno MA (2015) Efficient water and energy use in irrigation modernization: Lessons from Spanish case studies. Agricultural Water Management 162:67-77. DOI:
http://dx.doi.org/10.1016/j.agwat.2015.08.009 Urrestarazu PL, Burt CM (2012) Characterizat ion of pumps for irrigation in centra l Ca lifornia : Potential energy savings. Journal of Irrigation and Dra inage Engineering 138(9):815-822. DOI:
http://dx.doi.org/10.1061/(ASCE)IR.1943-4774.0000463 Vihola inen J, Ta mminen J, Ahonen T, Ahola J,