Pelagic metabolism of the Douro estuary (Portugal)
e
Factors
controlling primary production
Isabel C. Azevedo
a,b,*
, Pedro M. Duarte
c, Adriano A. Bordalo
a,baInstitute of Biomedical Sciences, University of Porto, Lg. Abel Salazar, 2, P-4099-003 Porto, Portugal bInstitute of Marine Research (CIIMAR), Portugal
cCentre for Modelling and Analysis of Environmental Systems, Faculty of Science and Technology, Fernando Pessoa University,
Prac¸a 9 de Abril 349, P-4249-004 Porto, Portugal
Received 6 August 2005; accepted 3 April 2006 Available online 9 June 2006
Abstract
The pelagic metabolism of the Douro estuary (Portugal) and the factors influencing primary production (PP) and community respiration (CR) in this system were studied during an annual cycle (December 2002eDecember 2003). Sampling surveys were conducted twice a month during
ebb and flood spring tides and water samples were collected for PP and CR assessments at three stations along the estuary (lower, middle and upper stretches). During the study period, PP values were in the range of 4.7e1878.5 mg C m2d1(average, 319.9 mg C m2d1). River
dis-charge controlled phytoplankton biomass inputs into the estuary as well as residence time. A decreasing trend in water column PP from the upper to the lower estuary related to higher nitrogen concentrations and phytoplankton biomass from riverine origin was observed. An inverse trend was found for CR, i.e., higher values were found in the lower, more urbanized stretch. During the study period, averaged CR values reached 1154 mg C m2d1. In general, heterotrophy dominated the entire estuary, except in the upper stretch from May through July, when increased
PP, but also lower CR values were recorded. A positive correlation between chlorophyllaand Pmaxwas found which is unusual in coastal
ecosystems, where a decreasing trend of theP/Bratio as a function of net primary production is generally observed. This could be explained by the relatively low phytoplankton biomass, preventing intraspecific competition from lowering photosynthetic capacity, on one hand, and the physiology of phytoplankton related to their origin in a semi-lotic (reservoir) ecosystem. No significant differences between tides were observed for all variables, except for the water light extinction coefficient (k) values, reflecting higher turbidity during the ebb.
Ó2006 Elsevier Ltd. All rights reserved.
Keywords:primary production; pelagic metabolism; respiration; phytoplankton; photosynthetic parameters; Douro estuary
1. Introduction
The metabolic balance of a given system depends upon its pri-mary production and community respiration. Pripri-mary production is dependent on physical (light availability and temperature), chemical (nutrients) and biological factors, like phytoplankton biomass, species composition, size structure and grazing (Stearns et al., 1987; Cloern, 1991; Landry et al., 1995; Gallegos and
Jordan, 1997; Calbet and Landry, 2004; Cermeno et al., 2006), as well as viral control (Proctor and Fuhrman, 1991).
In estuaries, these factors may be influenced by freshwater inflow, since it carries nutrients, phytoplankton and suspended matter, which determines light availability in the water col-umn. River flow magnitude also controls residence time and, hence, the susceptibility of ecosystems to algal blooms, with effects propagating throughout the food web to higher trophic levels (Kimmerer, 2002). Seasonal shifts from auto- to hetero-trophy according to river flow variations have also been re-ported. For example, heterotrophy occurs during monsoon periods in tropical estuaries, when increased allochthonous or-ganic input leads to enhanced respiration (Ram et al., 2003).
* Corresponding author. Institute of Biomedical Sciences, Lg. Abel Salazar, 2, P-4099-003 Porto, Portugal.
E-mail address:iazevedo@icbas.up.pt(I.C. Azevedo).
0272-7714/$ - see front matterÓ2006 Elsevier Ltd. All rights reserved. doi:10.1016/j.ecss.2006.04.002
Phytoplankton dynamics may also be influenced by tides. Episodes of biomass increase during neap tides and decline during spring tides have been reported (Cloern, 1991), as well as differences between ebb and flood tide phytoplankton
biomass (Roegner, 1998).Aubry and Acri (2004)found higher
phytoplankton abundance at flood than at ebb for most of the year in the Lagoon of Venice, due to the presence of neritic species. Tidal turbulence can also influence vertical distribu-tion of different phytoplankton species, e.g., slack water pe-riods enhance aggregation of dinoflagellates while diatoms rely on periods of turbulence to ensure entrainment into the upper water column and to prevent sinking from the photic zone (Lauria et al., 1999).
Another important factor affecting estuarine metabolism is human pressure, for example, through the construction of dams since they alter the timing and quantity of freshwater, sediment, inorganic and organic matters delivered to estuaries and adjacent coastal zones (Hopkinson and Vallino, 1995). The discharge of treated or untreated wastewater into estuaries also affects metabolism by increasing allochthonous nutrient or organic matter inputs, respectively. The former may in-crease production and the latter bacterial respiration. If bacte-rial respiration exceeds net primary production due to utilization of external sources of organic matter, heterotrophy dominates (delGiorgio et al., 1997).
Thus, in estuaries, a transient environment, the understand-ing of the trophic status is crucial in order to evaluate the role of such systems as a potential source of autochthonous organic
matter for the coastal environment. The autotrophice
hetero-trophic nature of an estuary is determined by three primary factors as follows: the ratio of inorganic to organic matter in-puts, water residence time and the overall degradability of al-lochthonous organic matter inputs (Hopkinson and Vallino, 1995). Data on metabolic balance of European estuaries are scarce, namely due to lack of studies concerning pelagic depth-integrated community respiration (Gazeau et al., 2004). The river Douro originates from the largest watershed in the
Iberian Peninsula. Its 98,000 km2 are unequally shared
be-tween Portugal (20%) and Spain (80%). Over 50 large dams have been constructed especially in the last 50 years for irriga-tion and electric power generairriga-tion purposes, resulting in flow regulation.
The Douro estuary is limited upstream by the last dam, lo-cated 21.6 km from the mouth. This dam determines the
fresh-water flow into the estuary, ranging from 0 to 13,000 m3s1
(Vieira and Bordalo, 2000) with an average of 501 m3s1.
River flows present a large inter-annual variability, with con-siderable differences between wet and dry years. A decrease of annual flow has been reported, due to climate phenomena (Trigo et al., 2004) but also to an increase of water storage for hydroelectric power generation, agriculture and domestic consumptions (Bordalo and Vieira, 2005). The fact that fresh-water flowing into the estuary originates in a reservoir, a semi-lotic ecosystem, may also influence estuarine metabolism due to specific phytoplankton characteristics. Moreover, in the case of the Douro, the last dam is the main source of phytoplankton biomass (Bordalo and Vieira, 2005).
The objective of this work is to analyse estuarine environ-mental conditions and photosynthetic parameters in relation to its metabolism, in order to answer the following questions:
- Is the Douro estuary auto- or heterotrophic?
- Which factors control primary production (PP) on a spatial and temporal basis?
- Are there significant differences in estuarine PP and metabolism between ebb and flood tides?
2. Materials and methods
2.1. Study area
The Douro is a granitic drowned valley river, draining to the north-western shore of Portugal. Its estuary is mesotidal, characterized by semidiurnal tides and a mean tidal range of 2.8 m. During the flood and under low river flow, sea water creates a salt wedge that eventually reaches the head of the es-tuary (at 21.6 km from the mouth), where the tidal excursion is halted by the Crestuma dam (Fig. 1), and remains within the estuary during the next ebb. In this situation, residence time can reach 14 days, whereas during high discharge events, the estuary is flushed completely during one tidal cycle and seawater intrusion is prevented during the flood (Vieira and Bordalo, 2000).
The last 8 km stretch of the river is heavily modified and over 700,000 inhabitants live within the estuarine area. A total of eight wastewater treatment plants (WTPs) drain into the estuary, without nutrient removal.
2.2. Sampling
Data presented in this study were obtained within a larger sampling program under a contract with Oporto Water Author-ity, designed to evaluate the influence of WTPs on estuarine water quality. Sampling surveys were conducted monthly, dur-ing ebb and flood sprdur-ing tides, in order to sample the most ex-treme situations, namely concerning seawater intrusion.
From December 2002 to December 2003, three stations were visited, in the lower, middle and upper estuary, at approx-imately 0.7, 5.0 and 21.6 km, respectively, from river mouth (Fig. 1). The boundaries of these three estuarine stretches have been defined based on the seasonal salt water intrusion (Vieira and Bordalo, 2000). Each survey lasted between 90 and 120 min according to flow conditions.
Vertical profiles of temperature, conductivity, salinity, dis-solved oxygen, pH and turbidity were performed with a CTD (YSI, 6600). Salinity was measured using the Practical Salinity Scale. Photosynthetic active radiation (PAR) profiles were obtained with a spherical quantum sensor light meter, at 0.5 m depth steps (LI-COR, LI-250).
Simultaneously, samples were collected at three depths (surface, middle and near bottom) with a Van Dorn bottle
for chlorophylla, nutrients (nitrate, nitrite, ammonium,
Mean water depth during sampling is presented inTable 1. During the survey period, tidal height ranged between 0.13 and 1.29 m, at ebb surveys, whereas at flood surveys, was
within the 2.65e3.52 m range.
For PP assessments, subsurface samples were used, after testing their adequacy to depth-integrated PP assessments in
the present estuarine system (c.f.eSection2.3). Community
respiration (CR) was initially estimated from samples col-lected at three depths and from surface samples only, after
confirmation that no significant (p>0.05) differences were
found with depth.
Water samples were kept refrigerated in ice chests and pro-cessed in the laboratory within 1 h from collection of the last sample.
2.3. Experimental and analytical procedures
PP was assayed by the 14C method (Steeman Neilsen,
1952), following the standardICES (1996)recommendations.
Briefly, water samples were placed in 125-ml Pyrex glass flasks and 2 mCi of aqueous solution of sodium bicarbonate was added (Carbon 14 Centralen). Duplicate samples were
in-cubated for 1e2 h in a water bath, at 5 light levels (100%,
75%, 50%, 25%, and 1%), to mimic light attenuation of differ-ent depths within the euphotic zone, at in situ temperature. An
artificial light source providing a PAR of 920mE m2s1was
used. Attenuation was achieved by means of a neutral screen. One additional dark bottle was also incubated. After
incuba-tion, samples were filtered through 0.45mm membranes,
washed, placed in 20-ml scintillation vials and 10-ml scintilla-tion cocktail (Beckman Instagel Packard) was added. Count-ings, in disintegrations per minute (DPM), were performed in a Beckman LS3801 liquid scintillation analyser using inter-nal standards for the automatic establishment of the quenching curve. Dark DPM values were subtracted from light DPM
values and results were expressed in mg C m3h1.
In order to validate the sampling strategy for PP assess-ments, simultaneous incubations, at 5 light intensity levels,
Table 1
Averages and standard errors for selected variables at each location during flood and ebb surveys for the December 2002eDecember 2003 period
Parameter Units Lower Middle Upper
Flood Ebb Flood Ebb Flood Ebb
Salinity e 20.42.6 11.01.6 12.12.3 5.81.3 1.71.1 2.01.1
Temperature C 14.20.5 14.20.7 14.50.7 15.30.8 17.01.1 16.01.0
NO3þNO2 mM 57.18.9 71.56.7 86.28.9 85.56.6 103.98.0 87.36.2
Ammonium mM 8.80.7 12.52.7 9.30.5 7.80.5 6.60.8 4.00.4
Phosphate mM 1.10.1 1.40.1 1.50.2 1.40.1 1.40.1 1.60.2
Silica mM 39.86.0 59.76.2 53.36.0 58.45.9 56.35.0 68.66.6
N:P ratio 53.84.7 63.43.5 67.45.9 72.75.2 109.719.6 69.46.9
TPM mg l1 24.03.6 19.51.7 11.51.2 16.71.9 10.91.1 11.11.0
POM mg l1 4.80.5 4.40.4 3.10.2 3.40.3 2.70.2 2.70.2
Chlorophylla mg m3 2.40.2 3.60.3 3.10.4 4.70.5 4.40.6 4.60.6
PP daily mg C m2d1 312.2118.7 205.576.5 328.2109.1 252.993.7 455.8163.1 411.1150.0
CR daily mg C m2d1 1810.1407.1 1355.2587.3 1170.2196.9 1487.2342.0 474.284.2 629.7126.3
Water column depth m 6.80.2 5.50.3 9.70.4 7.70.3 8.10.5 6.00.4
of surface samples and samples collected at depths correspon-dent to those light levels, were performed. These experiments yielded similar results, thus only surface water samples were used for PP measurements.
Inorganic carbon was assayed from pH and alkalinity
mea-surements by direct titration according toParsons et al. (1984).
CR was estimated as the difference in dissolved oxygen at the beginning and after 24 h incubation of samples in the dark at in situ temperature. Oxygen was assayed by a modification of the Winkler method (Carpenter, 1965). Oxygen values were converted into carbon units using a conversion factor of 0.375 (Uthicke and Klumpp, 1998).
Chlorophyll a was assayed spectrophotometrically after
extraction with 90% acetone (Parsons et al., 1984) with cell
homogenisation, using theSCOReUNESCO (1966)trichromatic
equation. Dissolved orthophosphate, nitrite, ammonium and silicate were analysed following the methods described in Grasshoff et al. (1983). Nitrate was quantified by an adaptation of the spongy cadmium reduction technique (Jones, 1984), subtracting nitrite value from the total. All the analyses were performed in triplicate. Samples were filtered through glass
fi-bre filters which were dried at 105 C for TPM assessment and
then incinerated at 500C for POM assessment (APHA et al.,
1992).
2.4. Data analysis
Bi-dimensional plots, generated by ‘‘Surfer’’ software, were used to represent variation with depth of measured vari-ables along the sampling period. Data were interpolated using the ‘‘kriging’’ gridding method.
In order to perform statistical and multivariate analyses, data were depth averaged.
2.4.1. PP calculations
Steele’s production-light function (P/E) Eq. (1) (Steele,
1962) was fitted to experimental data from incubation
experi-ments, using the GausseNewton non-linear regression method
with Statistica software, since photoinibition was apparent. The photosynthetic parameters obtained, maximum
produc-tion rate (Pmax) and optimal light intensity (Eopt), were used
to fit Eq.(1). The normalisation to chlorophyllawas made
us-ing the values obtained for each sample analysed.
Depth-inte-grated primary production (P) was then calculated by
integrating Steele’s equation over depth, Eq.(2).
P¼Pmax
1 Eopt
exp
1 E
Eopt
n
ð1Þ
n¼1 (n, empirical integer)
P¼Pmax
expð1Þ
kz
exp
E0expðkzÞ
Eopt
exp
E0
Eopt
ð2Þ
wherePmaxemaximum production rate (mg C mg Chla1h1);
E0esurface light intensity (mE m2s1);kelight extinction
coefficient (m1); andzedepth (m).
Light extinction coefficients (k) were estimated from the
vertical profiles of PAR measured during each sampling
sur-vey, using the LamberteBeer equation, Eq.(3).
E¼E0expðkzÞ ð3Þ
Time integrated PP estimates were obtained as follows:
(i) HourlyE0values were estimated by means of a model
im-plemented with Stella software using standard
formula-tions described in Brock (1981) and Portela and Neves
(1994)for periods of 24 h and adjusted to values measured during the sampling surveys. This adjustment was made by changing cloud cover values, to make sure that pre-dicted light intensities at the hours when sampling took place were similar to those measured.
(ii) From these surface light intensity estimates, the kvalues
measured during the surveys and theP/E curves obtained
in the incubation experiments, daily and depth-integrated PP was estimated separately for ebb and flood surveys. In these estimates, vertically averaged chlorophyll values
(mea-sured at three depths, c.f.eSection2.2) were considered.
Compensation depth (zc) ethe depth at which CR equals
PP (net production equal to zero)e was calculated solving
Eq.(4)by the Lambertw function (w.ew¼x) using the Matlab
6.5 software.
Pmax
E0expðkzcÞ
Eopt
exp
1E0expðkzcÞ
Eopt
CR¼0 ð4Þ
where CRecommunity respiration (mg l1).
Initial slope was estimated by deriving the Steele’s function
in relation toEand calculating the limit of the derivative when
Eapproaches zero.
2.4.2. Statistical and multivariate analyses
Spearman rank correlation analysis was performed to eval-uate relations between environmental and biological variables and metabolic processes. Regression analysis was also carried out between some specific variables.
and the relationship between means and variances. Newmane Keuls test was applied a posteriori.
Principal components analysis (PCA) was performed using Primer Software in order to investigate patterns of similarity between samples (Q-mode analysis) based on the values of en-vironmental and biological variables. The data matrix was or-ganized with samples as rows and observations (variables) as columns. Data were log transformed to account for non-normal distribution of variables and standardized to account for the different units in which the variables were expressed.
In this work, seasons are defined as: winter (Decembere
February); spring (MarcheMay); summer (JuneeAugust)
and fall (SeptembereNovember).
3. Results
3.1. Environmental conditions
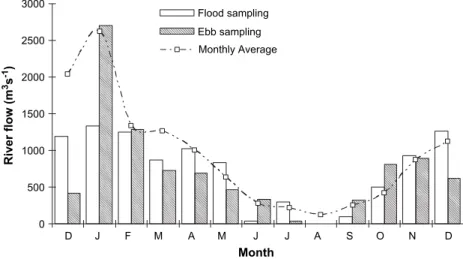
InTable 1, averages and standard errors for the major envi-ronmental parameters measured at each sampling station, at ebb and flood tide, are presented. River flow values during each survey, at sampling time, and monthly averaged values
are shown in Fig. 2. As expected, higher values were found
in winter and lower values in summer, with relatively small differences between actual survey values and monthly aver-aged values, except for December 2002. The highest river discharge was registered during the January ebb survey
when flow reached 2700 m3s1, and the lowest in August
dur-ing both surveys, when river discharge was zero. Average river
flow during the sampling period was 935 m3s1.
Average estuarine salinity during the study period was 8.5 with values ranging between 0 and 35. Salinity was signifi-cantly correlated to river discharge, regardless of the tide
(p<0.01). During high discharge periods, mostly in winter,
estuarine water was completely flushed out at low tide, and even during the flood, salinity values remained low at the mouth (Fig. 3). On the other hand, during the summer low dis-charge period, salinity values increased throughout the estuary
and, in the upper estuary, salinity higher than 18 could be found, independently of the tide.
Noticeable stratification of the water column occurred in some occasions, and a halocline was present at the lower sta-tion in the March ebb, April flood, May flood, July ebb and November flood surveys; and at the middle station in the May flood, June ebb, July flood and November flood surveys. Water temperature followed the expected seasonal trend
from a minimum of 7.2C during January and February
freshet to a maximum of 25.4 C in the upper estuary, during
the high salinity summer period.
In general, nutrient concentrations showed a seasonal
pat-tern, increasing during the fallewinter period and decreasing
during summer. Significant (p<0.01) correlations with
salin-ity (negative) and river flow (positive) were observed. The exception was ammonium, which exhibited no clear seasonal trend and was positively correlated with salinity.
During the August flood survey, high values of NO3þNO2
were observed in the upper estuary along the water column and in the middle estuary only at surface. Averaged values de-creased from the dam to the mouth independently of the tide
(Table 1). Considering the study period, NO3þNO2 ranged
between 1.4 and 227.4mM.
Ammonium concentration ranged between 0.3 and
108.5mM. The averaged values (Table 1) increased
down-stream during the ebb, while during the flood the middle sta-tion presented the highest value. Silicate values decreased downstream (Table 1) both during the ebb and the flood.
Concerning phosphate variability, values ranged from 0.2 to
4.7mM. In general, concentration values were under 3mM
throughout the sampling period, except in December. Only at the lower station during the flood, a significant linear
rela-tionship (p<0.001) was found between phosphate and
salin-ity, i.e. salinity did not control the dynamics of phosphate and average values throughout the estuary were rather similar.
N:P ratio ranged between 493, at the upper station during the August flood survey, and 8, at the middle station during the September flood survey. Nitrate was generally the predom-inant form of nitrogen. N:P values were always above the
0 500 1000 1500 2000 2500 3000
D J F M A M J J A S O N D
Month
R
iv
e
r
fl
o
w
(m
3s -1)
Flood sampling
Ebb sampling Monthly Average
Redfield ratio of 16, except for the bottom and middle depth samples collected during the September flood survey at the lower and middle stations. A general decreasing trend down-stream was observed (Table 1), consistent with the salinity increase.
TPM values ranged between 2.2 and 69.2 mg l1and POM
ranged between 0.2 and 14.4 mg l1. In general, no seasonal
trend was observed and maxima occurred in winter but also in summer. On an average, the highest values were measured in the lower estuary during the flood (Table 1). A significant
positive linear relationship (p<0.01) between TPM and the
light extinction coefficient was found, independently of tide
and location, as well as between TPM and POM. k Values
ranged between 0.3 and 4.1, with an average of 1.3 m1.
3.2. Chlorophyll a and photosynthetic parameters
Phytoplankton biomass, expressed in terms of chlorophyll
a contents, showed a clear seasonal trend (Fig. 4). Values
ranged from 0.3 mg m3, during the December flood survey,
to 14.9 mg m3, during the June flood survey, with higher
bio-mass occurring generally in the upper estuary, particularly dur-ing the mid-sprdur-ing early-summer phytoplankton bloom originated from the river. During this bloom period, biomass steadily decreased from the upper to the lower estuary. A second, more modest bloom was observed in most stations in late-summer early-fall, especially during the ebb. It should be noticed that maximal concentrations were observed in the upper station, during both the flood and the ebb. Variation
with depth occurred only during the bloom period (June), with concentration of biomass at the surface and in August at the upper station with a reduction of biomass over depth (Fig. 4). Phytoplankton biomass was positively correlated
with temperature (p<0.01) and negatively correlated with
river flow, phosphate and silicate (p<0.01). No statistical
relationship was found between chlorophyllaand NO3þNO2
or ammonium.
Table 2summarizes the results obtained by fitting Steele’s
equation toP/E data (see Section2). A general good fit was
obtained between model predicted values and observations
as shown by ther2values.Pmaxvalues were higher in spring
and summer, with the highest value during the August ebb
sur-vey at the upper station. During the ebb, higher values ofPmax
were found in June, at the lower and middle estuary, whereas
during the flood, the highest values were found in Julye
August at the lower and middle estuary and June and August
at the upper estuary. Globally, photosynthetic parametersPmax
andEoptwere significantly (p<0.01) correlated with
chloro-phyllaand temperature (positively) and with river flow andk
(negatively). The initial slope was correlated significantly and
positively with temperature. The relationships between Pmax
and the initial slope versus temperature were also analysed by regression analysis. A relatively good fit was obtained
with linear regression (respectively, r2¼0.4; ANOVA
p<0.0001 andr2¼0.16; ANOVAp<0.001).
Compensation depth values are presented inTable 3. These
values were compared with sampling stations’ mean depth and the depth of the halocline when present. In the majority of
-8 -6 -4 -2 0
-10 -8 -6 -4 -2 0
-10 -8 -6 -4 -2 0
-12 -9 -6 -3 0
-6 -4 -2 0
-8 -6 -4 -2 0
Flood Ebb
D
e
p
th
(m
)
Month
Station U
Station M
Station L
Station U
Station M
Station L
D J F M A M J J A S O N D D J F M A M J J A S O N D
situations analysed, compensation depths were less than half of water column depth. During spring and summer, however, a fully euphotic water column occurred in some stations, namely at the upper station in May, during the flood, and in May through August, during the ebb; at the middle station in June, during the flood, and at the lower station in June. Only in two situations the compensation depth was higher than the halocline: at the lower station, during the July ebb sur-vey and at the middle station, during the July flood sursur-vey, when the halocline was present at 2.8 and 4.4 m, respectively.
3.3. Estuarine metabolism
Except for the MayeJuly period in the upper estuary,
cor-responding to the phytoplankton bloom, CR was always higher than photosynthetic production, i.e. heterotrophy was the dominant process in the estuarine water column (Fig. 5).
A decreasing trend in integrated PP from the upper to the lower estuary was found, independently of the tide. Integrated daily values, however, were higher during the flood. Water
col-umn PP was significantly (p<0.01) and positively correlated
with temperature and salinity but negatively correlated with
river flow,k, nutrients (except ammonium), TPM and POM.
No relationship was found between PP and water column CR. From the data obtained during the study period, water col-umn PP annual averages were calculated. Values of 95, 106
and 160 g C m2y1 were obtained for the lower, middle
and upper estuary, respectively. It is noteworthy that these PP annual values are estimates from spring tides only, since
there are no data available for neap tides, that would allow a more accurate estimate of water column annual PP.
Regarding CR, values increased steadily from the upper to the lower estuary, reaching its maximum expression during the
summer months. Annual averages of 570, 478 and 199 g C m2
were obtained for the lower, middle and upper estuary, respec-tively. Depth-integrated hourly CR showed a positive signifi-cant correlation with salinity and ammonium and negative
correlation with NO3þNO2, silicate and river flow
(p<0.01).
3.4. Effect of time, tide and stations
After testing the MANOVA assumptions, it was concluded that not all variances were homogeneous, even after standard-ization and log transformation. The effect ‘‘time’’ was
signif-icant (p<0.05) for Pmax, k, salinity, phosphate and
ammonium. The effect ‘‘tide’’ was significant (p<0.05) for
konly.
The effect ‘‘Station’’ was significant for salinity,
NO3þNO2, ammonium and POM.
A posteriori comparisons with the NewmaneKeuls test
in-dicated significant differences (p<0.05) between the
up-stream station and the other two stations. Regarding the variable CR, there was a significant ‘‘station’’ effect
(p<0.01), unlike the variable PP. However, both results
must be considered with caution, because of variance heterogeneity.
-8 -6 -4 -2 0 -12 -9 -6 -3 0
-6 -4 -2 0 -10 -8 -6 -4 -2 0 -8 -6 -4 -2 0
Flood Ebb
-10 -8 -6 -4 -2 0
D
e
p
th
(m
)
Month
Station U
Station M
Station L
Station U
Station M
Station L
D J F M A M J J A S O N D D J F M A M J J A S O N D
3.5. Patterns of similarity between samples
The eigenvalues corresponding to the five principal
compo-nents (PCs) considered for analysis are presented in Table 4.
These were chosen because all were greater than the unity and together explained 77.7% of the total variance contained
in the original data set. The correlation coefficients between
PCs and variables are presented in Table 5. The variables
that contributed the most to PC1 were temperature and PP
(positively),kand silica (negatively), suggesting a dominant
influence of physical factors on primary production. PC2 was positively participated by POM, TPM, and salinity, and
negatively participated by NO3þNO2 and the N:P ratio,
mostly chemical factors. PC3 was negatively participated by N:P ratio, TPM, POM and initial slope. PC4 was highly and negatively participated by ammonium, possibly indicating an anthropogenic influence. PC5 was positively participated by
chlorophyll a and Eopt and negatively by the initial slope.
However, these last two PCs explained only a small portion of the total variance (Table 4).
In Fig. 6 a representation of the first two PCs is shown. Samples have been labelled based on season. Winter and sum-mer samples were arranged at opposite extremes of PC1 while spring and fall were spread across the middle, showing a clear seasonal pattern. This is in agreement with the contribution of
physical variables for PC1. On the other hand,Fig. 7
repre-sents the same projection but with the samples labelled by sampling station, highlighting spatial trends. In this case, tions were spread along the PC2 axis. The lower estuarine sta-tion samples were spread over the positive side whereas the upper station samples were located at the negative side. This agrees with the positive contribution of salinity (higher in
Table 3
Compensation depths calculated for the three sampling stations along the year during the ebb and flood surveys. Compensation depth values represented in bold type are close to or higher than water column depth
Date Ebb Flood
Station L Station M Station U Station L Station M Station U
Dec-02 a a a a 1.1 a
Jan-03 a a a a a 1.2
Feb-03 a a a a a 5.6
Mar-03 1.7 1.5 1.2 a 0.7 1.7
Apr-03 2.8 2.7 3.1 3.2 2.2 a
May-03 2.5 1.3 4.6 6.0 3.0 6.7
Jun-03 7.3 2.3 3.6 3.5 10.3 5.6
Jul-03 2.8 3.2 4.8 a 4.4 5.3
Aug-03 a 0.7 6.5 2.7 3.2 5.8
Sep-03 a 0.5 0.4 a 3.7 3.3
Oct-03 3.0 1.7 4.2 a a 3.0
Nov-03 0.7 0.6 3.1 0.8 1.4 2.8
Dec-03 a a a a a a
a The solution of Eq.(4)resulted in an imaginary number (see Section2).
Table 2
Monthly photosynthetic parameters obtained for the PI curves for the three sampling stations along the year during the ebb and flood surveys.Pmaxin mg C mg
Chla1h1;EoptinmE m2s1; initial slope of theP/Ecurve in mg C mg Chla1h1(mE m2s1)1
Date Station L Station M Station U
Pmax Eopt r2 Slope Pmax Eopt r2 Slope Pmax Eopt r2 Slope
(A) Ebb
Dec-02 0.87 446.58 0.42 0.0053 1.25 508.02 0.83 0.0067 2.38 398.24 0.99 0.0162
Jan-03 1.46 450.84 0.86 0.0088 1.83 418.97 0.88 0.0119 2.91 507.30 0.94 0.0156
Feb-03 1.35 423.07 0.68 0.0086 1.66 408.89 0.72 0.0110 1.51 379.93 0.71 0.0108
Mar-03 1.76 469.45 0.83 0.0102 2.86 610.88 1.00 0.0127 2.59 535.93 0.84 0.0131
Apr-03 1.95 554.82 0.88 0.0096 2.97 540.28 0.92 0.0149 2.73 608.54 0.90 0.0122
May-03 2.29 466.31 0.88 0.0133 3.99 612.00 0.99 0.0177 3.44 631.26 0.98 0.0148
Jun-03 3.27 455.66 0.76 0.0194 5.56 1882.83 0.86 0.0080 4.09 641.63 0.96 0.0173
Jul-03 2.67 553.08 0.95 0.0131 2.57 560.27 1.00 0.0124 3.87 595.88 0.99 0.0176
Aug-03 3.21 623.17 0.84 0.0140 3.18 687.98 0.92 0.0125 9.24 626.14 0.92 0.0401
Sep-03 1.90 603.28 0.96 0.0086 2.40 684.95 0.96 0.0095 2.73 670.71 0.86 0.0110
Oct-03 2.57 522.12 0.93 0.0134 2.99 675.28 0.96 0.0120 3.79 618.67 0.95 0.0166
Nov-03 2.02 498.35 0.79 0.0110 2.32 524.11 0.80 0.0120 2.89 544.53 0.83 0.0144
Dec-03 1.00 592.37 0.98 0.0046 1.44 925.37 0.88 0.0042 1.02 440.12 0.90 0.0063
(B) Flood
Dec-02 2.51 374.46 0.44 0.0182 3.76 460.18 0.50 0.0222 1.18 718.43 0.84 0.0045
Jan-03 1.45 373.77 0.46 0.0105 1.42 417.60 0.90 0.0092 2.86 380.81 0.89 0.0203
Feb-03 1.74 509.36 0.91 0.0093 1.96 473.66 1.00 0.0112 1.90 505.96 0.97 0.0102
Mar-03 1.73 487.23 0.97 0.0096 2.41 427.91 0.98 0.0153 3.45 812.50 0.80 0.0115
Apr-03 2.43 508.38 0.95 0.0130 2.65 565.28 0.91 0.0127 1.93 587.68 0.93 0.0089
May-03 2.30 587.68 0.93 0.0106 4.43 516.55 0.98 0.0232 3.56 540.42 0.97 0.0179
Jun-03 2.64 582.00 0.89 0.0123 3.08 663.97 0.99 0.0126 4.66 616.00 0.96 0.0205
Jul-03 5.06 722.95 0.92 0.0190 4.52 825.55 0.96 0.0149 3.81 657.61 0.91 0.0157
Aug-03 4.40 675.82 0.94 0.0177 5.45 676.56 0.94 0.0218 4.65 606.66 0.92 0.0208
Sep-03 1.49 698.70 0.84 0.0058 3.66 657.70 0.91 0.0151 3.25 643.49 0.96 0.0137
Oct-03 1.68 489.07 0.81 0.0093 2.58 685.56 0.95 0.0102 3.84 801.13 0.99 0.0130
Nov-03 3.68 552.63 0.98 0.0181 3.38 587.42 1.00 0.0156 3.17 591.01 0.99 0.0145
the lower estuary) and the negative contribution of NO3þNO2
(higher in the upper estuary). No association between samples
based on tide was observed. Fig. 8 shows graphically the
weight of variables PP and extinction coefficient superim-posed on the projection of samples, labelled by season, in the two-dimensional space defined by the first two principal components. The larger the circle, the greater the value of the superimposed variable. The samples with the highest values of PP are located in the positive side while the highest
values ofkare located on the negative side of the PC1 axis,
reflecting the negative correlation found between these two variables.
4. Discussion
The Douro estuary is a highly dynamic system like most es-tuaries and very dependent on river flow variations which are due to seasonal changes and dominate water circulation (Vieira and Bordalo, 2000). River inflow determines the extent of salt water intrusion, residence time, levels of nutrients and phytoplankton biomass. During winter, high flows often pre-vent coastal water from entering into the estuary, even during the flood, raise nutrient levels, lower phytoplankton biomass and reduce water residence time. In this estuarine system, river
flow rather than tides controls water residence time (Bordalo and Vieira, 2005). The surveys were carried out during a wet year, since the average river discharge was almost twice the long-term average inflow of freshwater.
Considering nutrient limitation of phytoplankton produc-tion, oceanic systems are considered to be nitrogen limited (Eppley et al., 1973) while freshwater systems are generally viewed as phosphorus limited (Schindler, 1977). In estuaries, where seasonal and spatial variations of freshwater and seawa-ter mixtures occur, this concept is not so clear (Bernhard and Peele, 1997). Seasonal alternation of nitrogen and phosphorus limitation has been reported (Fisher et al., 1992; Mallin et al., 1999) as well as a spatial shift from phosphorus to nitrogen limitation in some estuaries (Yin et al., 2001). In the present study, N:P ratio was usually high and always above the Red-field ratio except for the bottom and middle depth samples col-lected at the lower and middle stations during the September flood tide survey. These were high salinity low nutrient sam-ples, characteristic of seawater where nitrogen limitation is common. Hence, generally, in the Douro estuary phosphate, rather than nitrate, was the potentially limiting nutrient. Nev-ertheless, nitrate limitation can occur in low river flow situa-tions when scarcely diluted seawater is present within the estuary.
Production Respiration Station M
0 1000 2000 3000 4000 5000
Station U
0 500 1000 1500 2000
Station L
Month
0 1000 2000 3000 4000 5000 6000
Station M
0 1000 2000 3000
Station L
0 2000 4000 6000 8000 10000
D J F M A M J J A S O N D D J F M A M J J A S O N D Station U
0 500 1000 1500 2000
m
g
C
m
-2 d
-1
Ebb Flood
The PP obtained in the Douro estuary is within the produc-tivity range for other temperate and subtropical estuaries (Table 6). The results clearly show that the Douro estuary is predominantly heterotrophic. This is an expected result, con-sidering the shallowness (around 23%) of the euphotic layer/ compensation depth compared to the depth of the estuary (Table 3) and it is also a normal feature in temperate tidal estuaries (Heip et al., 1995). The deficit in PP may be compen-sated by external sources of organic matter, such as untreated sewage discharge or treated effluent disposal by the eight WTPs (Fig. 1). The contribution of benthic PP is limited owing to the small intertidal area of the estuary (Magalhaes et al., 2003) and, due to land reclamation, saltmarsh areas
were dramatically reduced to less than 0.1 km2 (Bordalo,
unpublished data).
The analysis ofFigs. 6 and 7, and the MANOVA results
in-dicate significant (p<0.01) differences in CR between
sam-pling stations and suggest different metabolic patterns over time and space in the Douro estuary. The gap between PP and CR increases towards the river mouth, with some positive values in summer in the upper and middle estuary. It is note-worthy that heterotrophy is much more evident towards the sea. The explanation for this fact lies probably in the higher TPM and POM loads at this end of the estuary, a very uncom-mon phenomenon that may be explained by the dam effect at the upstream end of the estuary, retaining large amounts of
sediments. Also, the human-induced contamination of the lower and middle estuary (Bordalo, 2003), contributed to an increased organic loading and hence of respiration, leading to the heterotrophy situation observed all year round.
The results show that different factors may control PP over space and time. From the PCA analysis, it is clear that spatial differences arose mostly along PC2, contrasting mostly larger
nitrateþnitrite concentrations and N:P ratios (upper station)
to higher salinities, TPM and POM concentrations (lower sta-tion). This suggests that the upper estuary is more productive than the lower estuary as a result of higher nitrogen concentra-tions from riverine origin (Mallin et al., 1993; Malej et al., 1995). Also, higher chlorophyll biomass from the reservoir (Bordalo and Vieira, 2005) may help to explain these trends, but to a lesser extent (Table 5). Regarding temporal differ-ences, higher PP values were associated to higher
tempera-tures, lower light extinction coefficients (k) and higher Pmax,
coinciding with the summer period. According toHeip et al.
(1995), annual PP values lower than 160 g C m2y1 result from light limitation in nutrient-rich or heterotrophic systems, which is the case of Douro estuary, with an annual estimate of
120 g C m2y1. This is partly confirmed from the results
ob-tained in this work, regarding temporal variability in PP,
statis-tically related tokvalues.
Probably, one of the most interesting aspects of this work is
the positive correlation of chlorophyllawithPmax. In marine
ecosystems, there seems to be a general decreasing trend of
theP/Bratio as a function of net primary production (NPP).
In one extreme there are oligotrophic ecosystems, with high
P/B, low biomass and NPP, such as open ocean pelagic
sys-tems, and in another extreme there are ecosystems with low
P/B, high NPP and biomass, such as algal reefs and beds
(Duarte et al., 2006). These trends suggest that low biomass and NPP ecosystems are more efficient in using limiting re-sources. Furthermore, low biomass standing stocks may also leave more resources per unit of biomass, helping to explain
Table 4
Eigenvalues, percent variation and cumulative percent variation of the first five principal components
PC Eigenvalues %Variation Cum.%variation
1 7.05 39.1 39.1
2 2.8 15.6 54.7
3 1.68 9.3 64
4 1.3 7.2 71.2
5 1.17 6.5 77.7
Table 5
Eigenvectors or coefficients in the linear combinations of variables making up PC’s
Variable PC1 PC2 PC3 PC4 PC5
Pmax 0.282 0.211 0.256 0.046 0.199
Eopt 0.217 0.097 0.208 0.144 0.468
k 0.3 0.073 0.274 0.002 0.152
Slope 0.191 0.168 0.363 0.094 0.545
PP 0.327 -0.149 0.125 0.193 0.093
CR 0.13 0.213 0.013 0.209 0.197
Chlorophylla 0.241 0.201 0.12 0.278 0.36
Temperature 0.325 0.049 0.038 0.206 0.05
Salinity 0.217 0.364 0.052 0.14 0.071
NO3þNO2 0.238 0.384 0.064 0.207 0.115
Phosphate 0.258 0.066 0.314 0.108 0.071
Silica 0.32 0.232 0.002 0.036 0.004
Ammonium 0.062 0.203 0.141 0.595 0.332
N:P ratio 0.001 0.365 0.449 0.246 0.263
Turbidity 0.262 0.009 0.256 0.212 0.142
TPM 0.174 0.342 0.385 0.27 0.056
POM 0.125 0.411 0.33 0.15 0.002
higher P/B ratios. Pmax, expressed as mg C mg Chl a1h1,
may be viewed as a potentialP/Bratio. Therefore, from the
re-sults obtained, it seems that the Douro estuary has a different
pattern regarding the usual relationship betweenP/Band
bio-mass standing stockehigher biomass situations coincide with
higher phytoplankton photosynthetic capacity. This positive feedback is reinforced by higher initial slopes (Table 2). The significant linear relationships between those parameters and temperature highlighted the importance of temperature in
con-tributing to higherPmaxand photosynthetic efficiency.
Madar-iaga (1995) in the Urdaibai estuary (Bay of Biscay) andvan Spaendonk et al. (1993) in the Westerschelde (The
Nether-lands) obtained higherPmaxvalues downstream than upstream,
whereas the contrary was true for PP and chlorophyll concen-trations: exactly the opposite trends obtained in this work for
Pmax and in line with previous comments on the P/B ratios.
Pmax values reported here are well within those measured by
Madariaga (1995), 2.03 and 15.21 mg C mg Chl a1h1, and van Spaendonk et al. (1993), 0.08 and 16 mg C mg Chla1h1. The mentioned patterns may result from the specific charac-teristics of the Douro river and its estuary. The relatively low chlorophyll concentrations in the Crestuma-Lever reservoir,
within 8e12 mg Chl am3 (Bordalo, unpublished data),
discharging directly into the estuary, may explain the low phytoplankton biomass within the estuary.
The river is dammed all over its course and this may justify the relatively low TPM loads to the estuary as compared to other European estuarine systems, such as the Sado estuary (Portugal), the Gironde (France) and the Scheldt (Belgium and The Netherlands). In such systems TPM concentrations
in the upper estuarine area were 600 mg l1, >200 mg l1
and c.a. 40 mg l1(Cabecadas et al., 1999). Moreover, in the
Douro estuary an increasing trend of TPM with salinity was observed (Table 1), whereas in the above-mentioned systems an opposite trend was found. Chlorophyll concentrations were in the range of those measured in the Douro, except for
the Scheldt, with maximal values above 200 mg Chl am3.
For both the Sado and the Gironde, chlorophyll maxima occurred at intermediate salinities, whereas for the Scheldt, upstream maximum was reported. This was also the case of Douro, where the highest chlorophyll concentration was observed at the estuary head, indicating a riverine origin of phytoplankton.
A possible explanation for the positive correlation between photosynthetic capacity and chlorophyll concentration of the Douro phytoplankton may be the relatively low phytoplankton biomass, preventing intraspecific competition from lowering photosynthetic capacity, on one hand, and the physiologic characteristics of phytoplankton itself, originated from a semi-lotic (Crestuma reservoir) rather than from a true lotic ecosystem. Probably, this last hypothesis deserves further investigation, since it may clarify some impacts of river dam-ming over estuarine metabolism in accordance with the Water Framework Directive (EC, 2000).
The absence of historical data to compare the obtained re-sults with similar studies carried out before dam construction prevents any definite conclusion about the dam effect on estu-arine production and metabolism. However, considering the important differences between the Douro estuary and other European estuaries, it may be acceptable that the river Douro dams lead to a reduction in TPM and chlorophyll loads into the estuary and a decrease in estuarine metabolism at its up-stream end. Whilst it is generally accepted that TPM loads de-crease as a result of dam retention, the same is not so clear regarding chlorophyll. However, considering that the Cres-tuma-Lever reservoir has an average depth of above 13 m, that only about one-third of the water column is euphotic and that, for most of the year, the water column is well mixed (Bordalo et al., unpublished data), it may be speculated that PP in the reservoir is not very high and therefore relatively low chlorophyll values may be expected as an input to the estuary.
Finally, significant differences between tides were not ob-served, as shown by MANOVA and multivariate analyses
-6 -4 -2 0 2 4 6
PC1
-3 -2 -1 0 1 2 3 4 5
PC
2
Fig. 6. Projection of samples in two dimensions, defined by the first two prin-cipal components, labelled by seasonewinter (6); spring (;); summer (,);
and fall (B).
-6 -4 -2 0 2 4 6
PC1
-3 -2 -1 0 1 2 3 4 5
PC
2
Fig. 7. Projection of samples in two dimensions, defined by the first two principal components, labelled by stationeLower (:); Middle (7); and
results, except for k, reflecting higher water turbidity during the ebb. Considering spatial variability, higher turbidity in the lower estuary is rather derived from sewage discharge within that estuarine stretch or from oceanic outfalls than from sediment resuspension, which traditionally originates the turbidity maximum. Differences between tides concerning phytoplankton biomass reported in other studies are related to
a much higher difference between chlorophyllacoming from
the river and the adjacent coastal waters (Roegner, 1998); or to seasonal phytoplankton cycles (Aubry and Acri, 2004).
5. Conclusions
The results obtained from this study suggest that:
(1) The Douro estuary is predominantly heterotrophic, with some exceptions in the lower salinity upstream area in summer.
(2) PP seems to be mostly controlled by temperature, being also influenced by a positive feedback from photosynthetic capacity and chlorophyll biomass.
(3) No significant differences between ebb and flood were ob-served in what PP is concerned.
(4) The reservoir located upstream may have a dominant in-fluence on TPM concentration gradients in the estuary,
which exhibit low TPM and chlorophyll a comparing to
other systems.
(5) Further studies addressing the impact of the upstream dam on the characteristics of phytoplankton arriving at the es-tuary, as well as its influence on estuary metabolism are needed.
Acknowledgements
This work was funded by the Porto Water and Waste Water Department (SMAS), through a contract awarded to A.A.B., and the Portuguese Science and Technology Foundation (FCT), through a PhD fellowship to I.C.A. (SFRH/BD/4660/ 2001). We thank R. Schumann and an anonymous reviewer for their helpful comments.
References
APHA, WWA, WEF, 1992. Standard Methods for the Examination of Water and Wastewater. American Public Health Association, Washington, DC, pp. 256e257.
Aubry, F., Acri, F., 2004. Phytoplankton seasonality and exchange at the inlets of the Lagoon of Venice (July 2001eJune 2002). Journal of Marine
Sys-tems 51, 65e76.
Bernhard, A., Peele, E., 1997. Nitrogen limitation of phytoplankton in a shal-low embayment in northern Puget Sound. Estuaries 20, 759e769.
Bordalo, A., 2003. Microbiological water quality in urban coastal beaches: the influence of water dynamics and optimization of the sampling strategy. Water Research 37, 3233e3241.
Bordalo, A., Vieira, M., 2005. Spatial variability of phytoplankton, bacteria and viruses in the mesotidal salt wedge Douro Estuary (Portugal). Estua-rine, Coastal and Shelf Science 63, 143e154.
Brock, T., 1981. Calculating solar radiation for ecological studies. Ecological Modelling 14, 1e19.
Cabecadas, G., Nogueira, M., Brogueira, M.J., 1999. Nutrient dynamics and productivity in three European estuaries. Marine Pollution Bulletin 38, 1092e1096.
Cadee, G.C., Hegeman, J., 1974. Primary production of the benthic microflora living on tidal flats in the Dutch Wadden Sea. Netherlands Journal of Sea Research 8, 260e291.
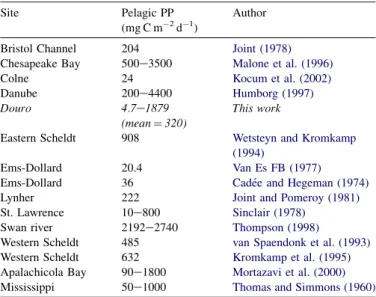
Table 6
Summary of pelagic primary production (PP) measurements (mean values or ranges) in temperate estuaries
Site Pelagic PP
(mg C m2d1)
Author
Bristol Channel 204 Joint (1978)
Chesapeake Bay 500e3500 Malone et al. (1996)
Colne 24 Kocum et al. (2002)
Danube 200e4400 Humborg (1997)
Douro 4.7e1879
(mean¼320)
This work
Eastern Scheldt 908 Wetsteyn and Kromkamp (1994)
Ems-Dollard 20.4 Van Es FB (1977)
Ems-Dollard 36 Cade´e and Hegeman (1974)
Lynher 222 Joint and Pomeroy (1981)
St. Lawrence 10e800 Sinclair (1978)
Swan river 2192e2740 Thompson (1998)
Western Scheldt 485 van Spaendonk et al. (1993)
Western Scheldt 632 Kromkamp et al. (1995)
Apalachicola Bay 90e1800 Mortazavi et al. (2000)
Mississippi 50e1000 Thomas and Simmons (1960)
A -3 -2 -1 0 1 2 3 4 5 PC 2
-6 -4 -2 0 2 4 6
PC1
-6 -4 -2 0 2 4 6
PC1 -3 -2 -1 0 1 2 3 4 5 PC 2 W W W W W W W W W W W W W W W W W W Sp Sp Sp Sp Sp Sp Sp Sp Sp Sp Sp Sp Sp Sp Sp Sp Sp Sp S S S S S S S S S S S S S S S S S S F F F F F F F F F F F F F F F F F F W W W W W W B W W W W W W W W W W W W W W W W W W Sp Sp Sp Sp Sp Sp Sp Sp Sp Sp Sp Sp Sp Sp Sp Sp Sp Sp S S S S S S S S S S S S S S S S S S F F F F F F F F F F F F F F F F F F W W W W W W W W W W W W W W W W W W W W W W W W Sp Sp Sp Sp Sp Sp Sp Sp Sp Sp Sp Sp Sp Sp Sp Sp Sp Sp S S S S S S S S S S S S S S S S S S F F F F F F F F F F F F F F F F F F W W W W W W
Calbet, A., Landry, M.R., 2004. Phytoplankton growth, microzooplankton grazing, and carbon cycling in marine systems. Limnology and Oceanog-raphy 49, 51e57.
Carpenter, J., 1965. The accuracy of the Winkler method for dissolved oxygen. Limnology and Oceanography 10, 135e140.
Cermeno, P., Maranon, E., Pe´rez, V., Serret, P., Ferna´ndez, E., Castro, C., 2006. Phytoplankton size structure and primary production in a highly dy-namic coastal ecosystem (Rı´a de Vigo, NW-Spain): seasonal and short-time scale variability. Estuarine, Coastal and Shelf Science 67, 251e266.
Cloern, J., 1991. Tidal stirring and phytoplankton bloom dynamics in an estu-ary. Journal of Marine Research 49, 203e221.
Duarte, P., Macedo, M.F., Fonseca, L.C., 2006. The relationship between phy-toplankton diversity and community function in a coastal lagoon. Hydro-biologia 555, 3e18.
EC, 2000. Directive 2000/60/EC of the European Parliament and of the Coun-cil of 23 October 2000 establishing a framework for Community action in the field of water policy. Official Journal of the European Communities L327, 1e73 (22.12.2000).
Eppley, R., Renger, E., Venrick, E., Mullin, M., 1973. A study of phytoplank-ton dynamics and nutrient cycling in the Central Pacific Gyre of the North Pacific Ocean. Limnology and Oceanography 18, 534e551.
Fisher, T., Peele, E., Ammermen, J., Harding, L., 1992. Nutrient limitation of phytoplankton in Chesapeake Bay. Marine Ecology Progress Series 82, 51e63.
Gallegos, C.L., Jordan, T.E., 1997. Seasonal progression of factors limiting phytoplankton pigment biomass in the Rhode River estuary, Maryland (USA). I. Controls on phytoplankton growth. Marine Ecology Progress Se-ries 161, 185e198.
Gazeau, F., Smith, S., Gentili, B., Frankignoulle, M., Gattuso, J., 2004. The European coastal zone: characterization and first assessment of ecosystem metabolism. Estuarine, Coastal and Shelf Science 60, 673e694.
delGiorgio, P., Cole, J., Cimbleris, A., 1997. Respiration rates in bacteria ex-ceed phytoplankton production in unproductive aquatic systems. Nature 385, 148e151.
Grasshoff, K., Ehrhardt, M., Kremling, K., 1983. Methods of Sea-water Anal-ysis. Verlag Chemie, Weinheim, 419 pp.
Heip, C., Goosen, N., Herman, P., Kromkamp, J., Middelburg, J., Soetaert, K., 1995. Production and consumption of biological particles in temperate tidal estuaries. Oceanography and Marine BiologyeAn Annual Review
33, 1e149.
Hopkinson, C., Vallino, J., 1995. The relationships among mans activities in watersheds and estuariesea model of runoff effects on patterns of
estu-arine community metabolism. Estuaries 18, 598e621.
Humborg, C., 1997. Primary productivity regime and nutrient removal in the Danube estuary. Estuarine, Coastal and Shelf Science 45, 579e589.
ICES, 1996. CM/L:3. Biological Oceanography Committee. Report of the Working Group on Phytoplankton Ecology. Report No. Ref:CþEþEnv, pp. 28e30.
Joint, I.R., 1978. Microbial production of an estuarine mudflat. Estuarine, Coastal and Marine Science 7, 185e195.
Joint, I.R., Pomeroy, A.J., 1981. Primary production in a turbid estuary. Estu-arine, Coastal and Shelf Science 13, 303e316.
Jones, M., 1984. Nitrate reduction by shaking with cadmium: alternative to cadmium columns. Water Research 18, 643e646.
Kimmerer, W.J., 2002. Effects of freshwater flow on abundance of estuarine organisms: physical effects or trophic linkages? Marine Ecology Progress Series 243, 39e55.
Kocum, E., Underwood, G., Nedwell, D., 2002. Simultaneous measurement of phytoplankton primary production, nutrient and light availability along a turbid, eutrophic UK east coast estuary (the Colne Estuary). Marine Ecol-ogy Progress Series 231, 1e12.
Kromkamp, J., Peene, J., Van Rijswijk, P., Sandee, A., Goosen, N., 1995. Nu-trients, light and primary production by phytoplankton and microphyto-benthos in the eutrophic, turbid Westerschelde Estuary (The Netherlands). Hydrobiologia 311, 9e19.
Landry, M., Peterson, W., Lorenzen, C., 1995. Zooplankton grazing, phyto-plankton growth, and export fluxe inferences from chlorophyll tracer
methods. ICES Journal of Marine Science 52, 337e345.
Lauria, M., Purdie, D., Sharples, J., 1999. Contrasting phytoplankton distribu-tions controlled by tidal turbulence in an estuary. Journal of Marine Sys-tems 21, 189e197.
Madariaga, I., 1995. Photosynthetic characteristics of phytoplankton during the development of a summer bloom in the Urdaibai Estuary, Bay of Bis-cay. Estuarine, Coastal and Shelf Science 40, 559e575.
Magalhaes, C.M., Bordalo, A.A., Wiebe, W.J., 2003. Intertidal biofilms on rocky substratum can play a major role in estuarine carbon and nutrient dy-namics. Marine Ecology Progress Series 258, 275e281.
Malej, A., Mozetic, P., Malacic, V., Terzic, S., Ahel, M., 1995. Phytoplankton responses to freshwater inputs in a small semi enclosed gulf (Gulf of Trieste, Adriatic Sea). Marine Ecology Progress Series 120, 111e121.
Mallin, M., Cahoon, L., McIver, M., Parsons, D., Shank, G., 1999. Alternation of factors limiting phytoplankton production in the Cape Fear River Estu-ary. Estuaries 22, 825e836.
Mallin, M., Paerl, H., Rudek, J., Bates, P., 1993. Regulation of estuarine pri-mary production by watershed rainfall and river flow. Marine Ecology Progress Series 93, 199e203.
Malone, T., Conley, D., Glibert, P., Harding, J.L., Sellner, K., 1996. Scales of nutrient limited phytoplankton productivity: the Chesapeake Bay example. Estuaries 19, 371e385.
Mortazavi, B., Iverson, R., Landing, W., Lewis, G., Huang, W., 2000. Control of phytoplankton production and biomass in a river-dominated estuary: Apalachicola Bay, Florida, USA. Marine Ecology Progress Series 198, 19e31.
Parsons, T., Maita, Y., Lalli, C., 1984. A Manual of Chemical and Biological Methods for Seawater Analysis. Pergamon Press, Elmsford, NY, 173 pp. Portela, L., Neves, R., 1994. Modeling temperature distribution in the shallow
Tejo estuary. In: Tsakiris, G., Santos, M.A. (Eds.), Advances in Water Re-sources Technology and Management. Balkema, Rotterdam, pp. 457e463.
Proctor, L.M., Fuhrman, J.A., 1991. Roles of viral-infection in organic parti-cle-flux. Marine Ecology Progress Series 69, 133e142.
Ram, A.S.P., Nair, S., Chandramohan, D., 2003. Seasonal shift in net ecosys-tem production in a tropical estuary. Limnology and Oceanography 48, 1601e1607.
Roegner, G., 1998. Hydrodynamic control of the supply of suspended chloro-phyllato infaunal estuarine bivalves. Estuarine, Coastal and Shelf Science 47, 369e384.
Schindler, D., 1977. Evolution of phosphorus limitation in lakes. Science 195, 260e262.
SCOReUNESCO, 1966. Determination of photosynthetic pigments in
seawa-ter. Report of the SCOReUNESCO Working Group 17. In: Monographs
on Oceanographic Methodology. UNESCO, Paris, pp. 11e18.
Sinclair, M., 1978. Summer phytoplankton variability in the lower St. Law-rence Estuary. Journal of Fishery Research Board Canada 35, 1171e1185.
Stearns, D., Litaker, W., Rosenberg, G., 1987. Impacts of zooplankton grazing and excretion on short-interval fluctuations in chlorophyll-aand nitrogen concentrations in a well-mixed estuary. Estuarine, Coastal and Shelf Sci-ence 24, 305e325.
Steele, J.H., 1962. Environmental control of photosynthesis in the sea. Limnol-ogy and Oceanography 7, 137e150.
Steeman Neilsen, E., 1952. The use of radioactive carbon (14C) for measuring
organic production in the sea. Journal du Conseil International pour l’Ex-ploration de la Mer 18, 117e140.
van Spaendonk, J.C.M., Kromkamp, J.C., de Visscher, P.R.M., 1993. Primary production of phytoplankton in a turbid coastal plain estuary, The Wester-schelde (The Netherlands). Netherlands Journal of Sea Research 31, 267e279.
Thomas, W., Simmons, E., 1960. Phytoplankton production in the Mississippi Delta. In: Shepard, F. (Ed.), Recent Sediment, Northwestern Gulf of Mex-ico. American Association of Petroleum Geologists, Tulsa, pp. 103e116.
Thompson, P., 1998. Spatial and temporal patterns of factors limiting phyto-plankton in a salt wedge estuary, The Swan River, Western Australia. Estuaries 21, 801e817.
Uthicke, S., Klumpp, D., 1998. Microphytobenthos community production at a near-shore coral reef: seasonal variation and response to ammonium re-cycled by holothurians. Marine Ecology Progress Series 169, 1e11.
Van Es FB, 1977. A preliminary carbon budget for a part of the Ems estuary: the Dollard. Helgolander Wiss Meeresunters 30, 283e294.
Vieira, M., Bordalo, A.A., 2000. The Douro estuary (Portugal): a mesotidal salt wedge. Oceanologica Acta 23, 585e594.
Wetsteyn, L., Kromkamp, J.C., 1994. Turbidity, nutrients and phytoplankton primary production in the Oosterschelde (The Netherlands) before, during and after a large-scale coastal engineering project (1980e1990).
Hydro-biologia 282/283, 61e78.