ESTIMATION OF FIELD CAPACITY FROM RING
INFILTROMETER-DRAINAGE DATA
(1)Theophilo Benedicto Ottoni Filho(2), Marta Vasconcelos Ottoni(3), Muriel Batista de Oliveira(4) & José Ronaldo de Macedo(5)
SUMMARY
Field capacity (FC) is a parameter widely used in applied soil science. However, its in situ method of determination may be difficult to apply, generally because of the need of large supplies of water at the test sites. Ottoni Filho et al. (2014) proposed a standardized procedure for field determination of FC and showed that such in situ FC can be estimated by a linear pedotransfer function
(PTF) based on volumetric soil water content at the matric potential of -6 kPa [θθθθθ(6)] for the same soils used in the present study. The objective of this study was
to use soil moisture data below a double ring infiltrometer measured 48 h after the end of the infiltration test in order to develop PTFs for standard in situ FC.
We found that such ring FC data were an average of 0.03 m³ m-³ greater than
standard FC values. The linear PTF that was developed for the ring FC data based only on θθθθθ(6) was nearly as accurate as the equivalent PTF reported by
Ottoni Filho et al. (2014), which was developed for the standard FC data. The root mean squared residues of FC determined from both PTFs were about 0.02 m³ m-³.
The proposed method has the advantage of estimating the soil in situ FC using
the water applied in the infiltration test.
Index terms: infiltration test, internal drainage, aeration capacity.
(1) Received for publication on October 29, 2013 and approved on August 28, 2014.
(2) Professor, Department of Water Resources and Environment, Universidade Federal do Rio de Janeiro. Caixa Postal 68570. CEP 21945-970 Rio de Janeiro (RJ), Brazil. E-mail: [email protected]
(3) Researcher, Department of Hydrology, Companhia de Pesquisa de Recursos Minerais, Serviço Geológico do Brasil. Av. Pasteur, 404. CEP 22290-240, Rio de Janeiro (RJ), Brazil. E-mail: [email protected]
(4) Professor, Faculdade Redentor. Av. Zulamith Bittencourt, 22. CEP 28300-000 Itaperuna (RJ), Brazil. E-mail: [email protected]
RESUMO:ESTIMATIVA DA CAPACIDADE DE CAMPO A PARTIR DE DADOS DE DRENAGEM DE INFILTRÔMETROS DE ANEL
A Capacidade de Campo (CC) é um parâmetro largamente adotado na Ciência do Solo
aplicada. Entretanto, seu método de determinação in situ pode apresentar dificuldades,
geralmente por conta da necessidade de grandes suprimentos de água nos locais dos testes. Ottoni Filho et al. (2014) propuseram uma padronização da determinação de campo da CC
e evidenciaram que tal CC in situ pode ser estimada por uma função de pedotransferência
(FPT) linear com base na umidade volumétrica do solo ao potencial matricial de -6 kPa [θ(6)]
para os mesmos solos usados neste estudo. O objetivo deste trabalho foi utilizar os dados de umidade do solo abaixo de um infiltrômetro de duplo anel, medidos 48 h após o término do
teste de infiltração, a fim de desenvolver FPTs para a CC in situ padronizada. Verificou-se que
tais dados de CC de anel foram em média 0,03 m³ m-³ maiores que os de CC in situ padronizada.
A FPT linear que foi desenvolvida com os dados de CC de anel com base apenas em θ(6) foi
quase tão precisa quanto a FPT equivalente reportada por Ottoni Filho et al. (2014), que foi desenvolvida para os dados de CC padronizada. As raízes quadradas de resíduo quadrático
médio da CC determinada a partir de ambas as FPTs foram aproximadamente 0,02 m³ m-³.
O método proposto tem a vantagem de estimar a CC in situ do solo pelo uso da água aplicada
no teste de infiltração.
Termos de indexação: teste de infiltração, drenagem interna, capacidade de aeração.
INTRODUCTION
Field capacity (FC) is a soil parameter that is largely applied in soil hydrology, land management, and engineering. In a companion paper, Ottoni Filho et al. (2014) defined FC on a basis that allows greater reproducibility and lends precision to the term, while keeping its original practical meaning. The reproduction of such a definition of FC along a soil profile standardizes its field measurement and requires that a pre-evaluated water depth (W) be applied by ponded infiltration to saturate the profile length (D) of interest; evapotranspiration and rain be zero after infiltration; and FC(z)=θ48(z), for depth
z < D, where θ
48 is the volumetric water content
at t = 48 h and D is the wetting front depth at t = 0 h (t is the drainage time, measured after the end of infiltration). The in situ procedure of FC determination is flooding a square (or rectangular) bare soil plot area (Ottoni Filho et al., 2014). It requires a large supply of water due to both the great water depth necessary to saturate the profile of interest and the minimum area of the experimental plot that is thought to be necessary to simulate site infiltration and drainage flows realistically. In gently sloping landscapes, these simulated flows must be nearly vertical. In these cases Hillel (1998) and Cassel & Nielsen (1986) recommend plot surfaces of 25 and 12 m², respectively, but much smaller plots are frequently used. Paige & Hillel (1993) used 1.2 × 1.2 m, and Embrapa (1979) recommends 1.0 × 1.0 m. Fabian & Ottoni Filho (2000) concluded that the FC profile [θ48(z)] obtained in 1.0 × 1.0 m plots was statistically
equal to the equivalent water content profile [θ
48(z)]
from internal drainage experiments with suppressed evaporation conducted in undisturbed soil columns contained in a 0.80-m diameter cylinder driven 0.70-m into the soil profile. In that study, a ponded infiltration
test was performed in the cylinder before the internal drainage experiment, making the cylinder-θ48(z)
diameter than the inner cylinder; Skaggs et al. (1980) recommended a ring diameter ratio of two or more. Simulating double ring infiltration by numerical modeling, Lai et al. (2010) demonstrated that the inner ring size is a more important factor to be considered than the buffer area around it and recommended a 80-cm diameter inner ring to obtain reliable direct measurements of field saturated hydraulic conductivity. Inner ring diameters used in ponded infiltration tests are typically in the range of 20-45 cm (Skaggs et al., 1980). Bertrand (1965) reported that a larger double ring device (øi = 100 cm, øo = 120 cm)
was successfully used to measure vertical infiltration in a wide range of soil and restricting layer conditions, which is somehow consistent with the plot sizes of around 1.0 m² used in FC testing (Embrapa, 1979; Paige & Hillel, 1993; Ottoni Filho et al., 2014). In contrast, a much smaller double ring, øi = 15 cm,
øo = 30 cm (Fabian & Ottoni Filho, 1997), poorly
estimated the vertical steady-state infiltration rate (ist) of an in situ ponded infiltration test in undisturbed columns (0.80-m diameter vs 0.70-m height) of the same soil. In this case, ist in the infiltrometer was
about 4.8 larger than in the column. To our knowledge, scale effects reported to be relevant during the infiltration phase of small double ring devices have not been investigated during the subsequent drainage phase in order to delineate an alternative approach for evaluation of θ48(z).
The objective of this study was to present an alternative in situ method for determining FC based on soil moisture-drainage data below the inner ring of a small double ring infiltration device (øi = 20 cm, øo = 39 cm) after completion of a ponded infiltration
test. This method has the advantages of determining both infiltration rates and FC profiles in a single water application and using much less water than required by standard FC trials. The procedures for the standard FC tests followed the protocol outlined by Ottoni Filho et al. (2014).
MATERIAL AND METHODS
The study area was a 13-km² pastured watershed in the State of Rio de Janeiro, Brazil. Thirteen soil profiles were investigated. The following variables were determined in all profiles in two replicates: FC, sand, silt, clay, and organic matter (OM) contents, bulk density (BD), and volumetric water content for suctions of 6, 33, and 1500 kPa [θ(6), θ(33), and θ(1500), respectively]. These variables were obtained
from soil samples taken at the center of the FC trial areas. The replication sites of each soil were 10 m apart and were sampled at the same depths; however, individual measurements were analyzed separately per soil site and depth. More details on the study area, soils, and experimental methods can be found in Ottoni Filho et al. (2014). The procedures for determining
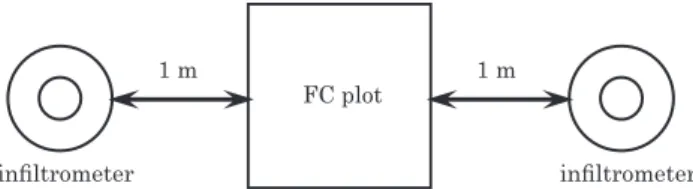
standard in situ FC followed the FC definition and protocol presented in the aforementioned paper. Two double ring (øi = 20 cm, øo = 39 cm) infiltrometers were inserted 5 cm into the soil close to every 1.0 × 1.0 m plot of the FC measurements. The outer rings of the infiltrometers were 1.0 m apart from the middle of two opposite sides of the plot (Figure 1). The infiltration tests were performed at the same time as the flooding experiment in the contiguous plot. Water was applied in both the outer and inner rings, keeping their water levels approximately at the same height of 6±1 cm above the ground level during the infiltration tests. Infiltration depths were measured only in the inner rings. The cumulative water application of some infiltration tests was small for the purpose of FC testing, justifying an additional water application in both rings of the device immediately after completion of the infiltration test if the cumulative infiltration during the infiltrationtest period was smaller than 15 cm. However, such a rule was not applied to all sites. Thus, the drainage experiment was carried out only in associated double ring pairs in which more than 15 cm of water had infiltrated in each device. Only in two soils, P15 and P36, was the water application in the rings significantly larger than 20 cm. For the other sites where the drainage experiment was performed in the rings (profiles P4, P6, P20, P27, P32, P34, and PE), water application was around 20 cm (±5 cm in most cases), which was compatible with the water depths applied in the standard FC plots. When infiltration was complete, the wetted area was covered with a plastic sheet for 48 h before measuring the volumetric soil water content below the inner ring by gravimetry and soil sampling with a Kopeck ring at the same sampling depths used in the contiguous flooding plot (Ottoni Filho et al., 2014). The average of such duplicate water content measurements per depth and plot was the corresponding ring FC value. Ottoni Filho et al. (2014) showed that pedotransfer functions (PTFs) are an efficient tool to predict the in situ FC of studied soils. As the ring and standard FC data were correlated, PTFs for the ring data were developed by regression and evaluated as FC predictors using texture, OM, BD, θ(6), θ(33), and θ(1500) as
input data. Therefore, this method can be viewed as a regression procedure to determine in situ FC from laboratory parameters (the PTF input variables for the ring FC) and from field drainage information (the ring FC). The root mean squared residues (RMSRs)
and the non-parametric Wilcoxon Test (Bradley, 1968; Zar, 1999) were used to evaluate the quality of fitting of the predicted standard FC.
RESULTS AND DISCUSSION
The ring FC (FCr) data set size was n=56 (nine soils). The Pearson correlation coefficients between FCr and the other soil variables, including standard FC, are shown in table 1. Only silt, OM, and BD did not correlate significantly with FCr. The largest significant correlations were found with sand and clay contents (|r|≈0.85), and the smallest significant correlation was with FC (r=0.509). Among the soil moisture values, θ(6) had the smallest correlation
coefficient. The opposite was found when correlations involving θ(6) were derived from the standard FC data
for the same soils (Ottoni Filho et al., 2014; Table 3). In that paper, θ(6) was the soil parameter that had the
largest correlation with FC (r 0.926). We point out that the samples for the determination of FCr were taken 1.0 m away from the plot of the FC trials (Figure 1), which was a source of variance for the relationships between FCr and the soil properties due to spatial variability effects. Another possible reason for such variance are the scale effects associated with the infiltration and drainage flows below the double ring device.
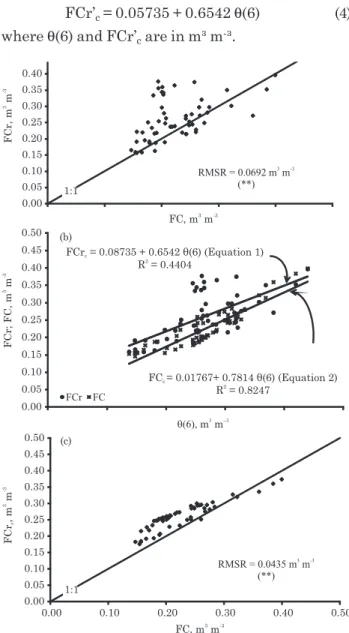
Figure 2 shows the relationships involving measured standard field capacity (FC), FCr, and θ(6).
Figure 2a shows that the values of FCr tended to be larger than FC, which was confirmed by the Wilcoxon test, whose result is indicated in figure 2a. Figure 2b shows the dependence of FCr and FC data on θ(6).
The corresponding linear regression equations are: FCrc = 0.08735 + 0.6542 θ(6) (1)
FCc = 0.01767 + 0.7814 θ(6) (2)
where θ(6), FCrc, and FCc are in m³ m-³.
Figure 2c shows the FC predicted by equation 1 (FCrc) in comparison toFC; the corresponding mean
residue is 0.0435 m³ m-³. As demonstrated by the
Wilcoxon test (Figure 2c), equation 1 creates a bias in overestimating FC, which is a consequence of the general trend for the ring FC data to be larger than the standard FC data. This bias can be eliminated by introducing the following transformation:
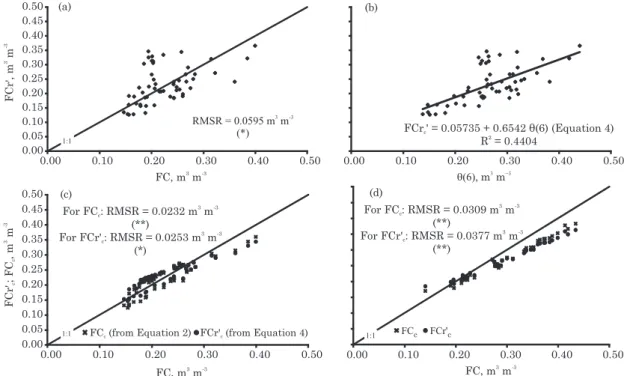
FCr’ = FCr - 0.03 (3)
The transformed FCr’ data were plotted against the corresponding standard FC values in Figure 3a. Figure 3b shows the scattergram FCr’ vsθ(6) and its
corresponding regression model:
FCr’c = 0.05735 + 0.6542 θ(6) (4)
where θ(6) and FCr’
c are in m³ m-³.
Field capacity Sand Silt Clay θθθθθ(6) θθθθθ(33) θθθθθ(1500) Organic matter Bulk density
0.509** -0.846** -0.181 0.860** 0.664** 0.735** 0.789** 0.071 -0.096
Table 1. Pearson correlation coefficients between the ring field capacity and basic soil properties, including FC (n= 56)
** Significative correlation at p<0.05, according to the Pearson test.
Figure 2. Relationships involving standard field capacity (FC), ring field capacity (FCr), and θθθθθ(6) data. In (a),
FC is compared to FCr. In (b), the regression equations for FCr vsθθθθθ(6) (Equation 1) and FC vs
θ θ θ θ
θ(6) (Equation 2) are represented. In (c), the values
equations 1 and 4 can be considered acceptable PTFs for FC. The advantage is that their coefficients do not depend on standard FC data adjustment. Sand content, clay content, θ(33), and θ (1,500) were also tested as
input parameters of linear or multi-linear regression models for FCr’, along with θ(6); however, none of them
estimated FC better than the linear modelsbased only on θ(6) (Equations 1 and 4), probably because θ(6) was
the soil parameter that had the largest correlation with FC (Ottoni Filho et al., 2014). Equation 4 performed better than equation 1, and almost as well as the equivalent model (Equation 3 of Ottoni Filho et al., 2014) that was calibrated for all measured standard FC data (n=92). The individual performance of equation 4 in the estimation of FC in a single soil unit was also satisfactory. In this case, the largest RMSR among the nine soils for which FCr information was available was that of unit P4, 0.042 m³ m-³.
The general trend for the FCr data to be larger than FC is probably due to scale effects involving the infiltration and drainage flows below the FC plot and the double ring device, which depend on geometric differences between both water application schemes and on soil hydraulic characteristics. If this is true, double rings with diameters larger than those used in this paper will contribute to eliminate that
Figure 3. Relationships involving standard field capacity (FC), transformed ring field capacity (FCr’), and
θ θ θ θ
θ(6) data. In (a), FC is compared to FCr’. In (b), the regression equation for FCr’ vsθθθθθ(6) (Equation 4) is
represented. In (c), the values calculated by equations 2 and 4 are evaluated in comparison to the FC data. The three figures are for the data set (n=56) where the ring FC information is available. In (d), the FC values predicted by equations 2 and 4 are evaluated for the samples (n=36) for which the corresponding ring FC information was not available. * and **: mean that, according to the Wilcoxon test, the variable at the vertical axis is statistically indistinguishable from FC (at p<0.01 or 0.05, respectively); **: means that the variable at the vertical axis is statistically distinguishable from FC (at p<0.01), according to the Wilcoxon test.
The estimation of standard FC using equation 4, shown in figure 3c and based on transformed FCr data adjustment, is nearly as accurate as the prediction of equation 2, which was calibrated for the standard FC data. The RMSRs 0.0253 m³ m-³
(Equation 4) and 0.0232 m³ m-³ (Equation 2) were close
to the RMSR = 0.0222 m³ m-³ of equation 3 (Figure
5c) in Ottoni Filho et al. (2014), which is a linear pedotransfer function based only on θ(6) but adjusted
for the broader standard FC data set (13 soils, n=92). The Wilcoxon test (p<0.01) showed no bias in the prediction of FC by equation 4, as indicated in figure 3c. As to the validation of equations 4 and 2 for the 36 (92-56) soil samples for which the corresponding FCr information was not available, figure 3d showed a slight deterioration of the FC estimates. In this case, equations 4 and 2 tended to underestimate FC, but the respective mean residues (0.0377 and 0.0309 m³ m-³) were close and small. In general, such
individual errors were greater for FC>0.30 m³ m-³,
probably because most of the data used in the calibration of both equations were from soils with FC<0.30 m³ m-³, as indicated in figure 3c.
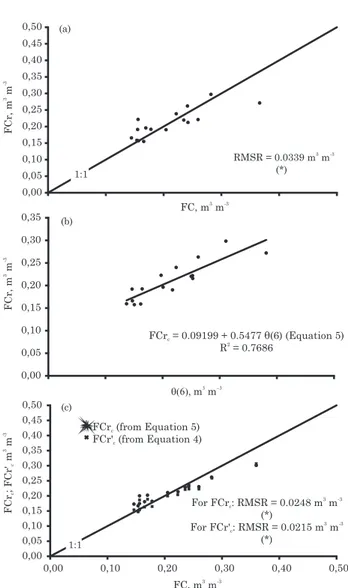
tendency. However, in some soils (P15, P36) such a trend was not evident, suggesting that variations in soil material or profile morphology may interfere with the differences between FC and FCr. Soils P15 and P36 were sandy and the most permeable profiles of the study area. The relationship between their FCr and FC is shown in figure 4a. For these soils and according to the Wilcoxon test, FCr is a good, unbiased FC estimate (RMSR = 0.0339 m³ m-³). Again, their
local PTF for FCr based on the adjustment with θ(6)
data at P15 and P36 (Figure 4b),
FCrc = 0.09199 + 0.5477 θ(6) (5)
Figure 4. Relationships involving standard field capacity (FC), ring field capacity (FCr), and θθθθθ(6)
data for soils P15 and P36 (n=16). In (a), FC is compared to FCr. In (b), the local regression equation for FCr vs θθθθθ(6) (Equation 5) is
represented. In (c), the values determined by equations 5 and 4 are evaluated in comparison to the FC data. *: means that the variable at the vertical axis is statistically indistinguishable from FC (at p<0.05), according to the Wilcoxon test.
where θ(6) and FCr
c are in m³ m-³, determined the
FC of both profiles with smaller errors (RMSR = 0.0248 m³ m-³, Figure 4c) than when FCr was used
directly (Figure 4a). It is interesting that equation 5 was almost as efficient as equation 4, which is based on transformed ring FC data, when the latter was applied to P15 and P36 data, as demonstrated in figure 4c. This is an indication that when a large number of soils, especially soils with a broad range of textures, are used in the PTF adjustment for the FCr’ data, the resulting PTF can somehow mirror the relationship that exists between the standard FC and the PTF input variable(s), in this case, θ(6). This may
explain the good performance of equation 4 for each of the nine soils, even for the few profiles without a tendency for FCr to be larger than FC.
Equation 3 was empirically derived to make the FCr data more similar to the standard FC data; however, due to scale effects, it may be valid only for the double ring geometry tested in this paper. More general transformations should probably take into account infiltrometer geometry, as well as soil properties.
CONCLUSION
Measurement of FC may give rise to operational field test difficulties. In this study, the determination of standard in situ FC followed the FC definition and protocol proposed by Ottoni Filho et al. (2014). As FC is the result of sequential ponded infiltration and internal drainage, it is convenient to use the same water application for both the infiltration and FC tests. A double ring infiltrometer was chosen for this dual goal field trial. The infiltration phase in the double ring should be continued until the water depth (W) prescribed for FC is applied. If the soil is pervious and W infiltrates before the end of the infiltration test, we propose that the test be continued, but finished as soon as possible. There was a trend for the ring FC data to be an average of 0.03 m³ m-³ greater than the
standard FC measured in adjacent flooding plots, for a 20-39 cm diameter double ring device. However, after correcting the original ring determinations by 0.03 m³ m-³ and using them directly as FC predictions, the
estimation errors were great (RMSR = 0.0595 m³ m-³).
Nevertheless, a PTF linearly calibrated for the transformed ring FC andbased only on θ(6) (Equation
4) was quite efficient and nearly as accurate (RMSR = 0.0253 m³ m-³) as the equivalent PTF adjusted for
ACKNOWLEDGMENTS
The authors wish to thank FINEP (CTHidro/GBH-02/2002) for financial support and the CNPq for fellowships. We are also grateful to Embrapa Solos for its technical support and to Dr. Yakov Pachepsky from USDA-ARS for his comments.
LITERATURE CITED
BERTRAND, A.R. Rate of intake in the field. In: BLACK, C.A., ed. Methods of soil analysis: Physical and mineralogical properties, including statistics of measurement and sampling. Madison, American Society of Agronomy, 1965. Part 1, p.197-208.
BODHINAYAKE, W.; SI, B.C. & NOBORIO, K. Determination of hydraulic properties in sloping landscapes from tension and double-ring infiltrometers. Vadose Zone J., 3:964-970, 2004.
BOUWER, H. Intake rate. Cylinder infiltrometer. In: KLUTE A., ed. Methods of soil analysis. Physical and mineralogical methods. 2.ed. Madison, American Society of Agronomy/ Soil Science Society of America, 1986. Part 1, p.825-843. BRADLEY, J.V. Distribution-free statistical tests. New Jersey,
Prentice Hall, 1968. 388p.
CASSEL, D.K. & NIELSEN, D.R. Field capacity and available water capacity. In: KLUTE, A., ed. Methods of soil analysis: Physical and mineralogical methods. 2.ed. Madison, American Society of Agronomy/Soil Science Society of America, 1986. Part 1, p.901-926.
EMPRESA BRASILEIRA DE PESQUISA AGROPECUÁRIA -EMBRAPA. Manual de métodos de análises de solo. Rio de Janeiro, CNPS, 1979. 235p.
FABIAN, A.J. & OTTONI FILHO, T.B. Determinação de curvas de infiltração usando câmara de fluxo. R. Bras. Ci. Solo., 21:325-333, 1997.
FABIAN, A.J. & OTTONI FILHO, T.B. Determinação de capacidade de campo “in situ” ou através de equações de regressão. Pesq. Agropec. Bras., 35:1029-1036, 2000. HILLEL, D. Environmental soil physics. London, Academic
Press, 1998. 771p.
LAI, J.; LUO, Y. & REN, L. Buffer index effects on hydraulic conductivity measurements using numerical simulations of double-ring infiltration. Soil Sci. Soc. Am. J., 74:1526-1536, 2010.
OTTONI FILHO, T.B.; OTTONI, M.V.; OLIVEIRA, M.B.; MACEDO, J.R. & REICHARDT, K. Revisiting Field Capacity (FC): Variation of the FC definition and its estimation with pedotransfer functions. R. Bras. Ci. Solo, 38:1750-1764, 2014.
PAIGE, G.B. & HILLEL, D. Comparison of three methods for assessing soil hydraulic properties. Soil Sci., 155:175-189, 1993.
REYNOLDS, W.D.; ELRICK, D.E. & YOUNGS, E.G. Single-ring and double-or concentSingle-ring-Single-ring infiltrometers. In: DANE, J.H. & TOPP, G.C., eds. Methods of soil analysis. Madison, Soil Science Society of America, 2002. p.821-826. SKAGGS, R.W.; MILLER, D.E. & BROOKS, R.H. Soil water. Part I - Properties. In: JENSEN, M.E., ed. Design and operation of farm irrigation systems. St. Joseph, American Society of Agricultural Engineers, 1980. p.77-123. ZAR, J.H. Biostatistical analysis. 4.ed. New Jersey, Prentice
Hall, 1999. 662p.