REVISITING FIELD CAPACITY (FC): VARIATION OF
DEFINITION OF FC AND ITS ESTIMATION FROM
PEDOTRANSFER FUNCTIONS
(1)Theophilo Benedicto Ottoni Filho(2), Marta Vasconcelos Ottoni(3), Muriel Batista de Oliveira(4), José Ronaldo de Macedo(5) & Klaus Reichardt(6)
SUMMARY
Taking into account the nature of the hydrological processes involved in in situ measurement of Field Capacity (FC), this study proposes a variation of the definition of FC aiming not only at minimizing the inadequacies of its determination, but also at maintaining its original, practical meaning. Analysis of FC data for 22 Brazilian soils and additional FC data from the literature, all measured according to the proposed definition, which is based on a 48-h drainage time after infiltration by shallow ponding, indicates a weak dependency on the amount of infiltrated water, antecedent moisture level, soil morphology, and the level of the groundwater table, but a strong dependency on basic soil properties. The dependence on basic soil properties allowed determination of FC of the 22 soil profiles by pedotransfer functions (PTFs) using the input variables usually adopted in prediction of soil water retention. Among the input variables, soil moisture content θθθθθ (6 kPa) had the greatest impact. Indeed, a linear PTF based only on it resulted in an FC with a root mean squared residue less than 0.04 m3 m-3 for most soils individually. Such a PTF
proved to be a better FC predictor than the traditional method of using moisture content at an arbitrary suction. Our FC data were compatible with an equivalent and broader USA database found in the literature, mainly for medium-texture soil samples. One reason for differences between FCs of the two data sets of fine-textured soils is due to their different drainage times. Thus, a standardized procedure for in situ determination of FC is recommended.
Index terms: internal drainage, aeration capacity, soil water retention.
(1) Received for publication on October 29, 2013 and approved on August 28, 2014.
(2) Professor, Department of Water Resources and Environment, Universidade Federal do Rio de Janeiro. Caixa Postal 68570.
CEP 21945-970 Rio de Janeiro (RJ), Brazil. E-mail: [email protected]
(3) Researcher, Department of Hydrology, Companhia de Pesquisa de Recursos Minerais, Serviço Geológico do Brasil. Av.
Pauster, 404. CEP 22290-240 Rio de Janeiro (RJ), Brazil. E-mail: [email protected]
(4) Professor, Faculdade Redentor. Av. Zulamith Bittencourt, 22. CEP 28300-000 Itaperuna (RJ), Brazil. E-mail:
(5) Researcher, Empresa Brasileira de Pesquisa Agropecuária. R. Jardim Botânico, 1024, Jardim Botânico. CEP 22460-000 Rio de
Janeiro (RJ), Brazil. E-mail: [email protected]
(6) Professor, Soil Physics Laboratory, Centro de Energia Nuclear na Agricultura, Universidade de São Paulo. Av. Centenário,
RESUMO:REVISITANDO A CAPACIDADE DE CAMPO (CC): VARIAÇÃO DA DEFINIÇÃO DE CC E SUA ESTIMATIVA COM FUNÇÕES DE PEDOTRANSFERÊNCIA
Levando em conta a natureza dos processos hidrológicos envolvidos na medição da Capacidade de Campo (CC) in situ, este estudo propõe uma variação da definição de CC a fim de minimizar as impropriedades de sua determinação, mas também de manter seu sentido prático original. A análise de dados de CC para 22 solos brasileiros e de dados adicionais da literatura, todos medidos segundo a definição proposta, que é com base no tempo de drenagem de 48 h após uma infiltração por alagamento raso, indicou fraca dependência na quantidade de água infiltrada, valor de umidade antecedente, morfologia do solo e nível do lençol freático, mas forte dependência nas propriedades básicas do solo. Essa dependência nas propriedades básicas do solo permitiu a determinação da CC dos 22 perfis de solo por funções de pedotransferência (FPTs), utilizando as variáveis de entrada usualmente adotadas na predição de retenção de água no solo. Entre as variáveis de entrada, a umidade θ (6 kPa) foi a que teve maior impacto; de fato, uma FPT linear com base somente nela resultou numa CC com raiz quadrada de resíduo quadrático médio menor que 0,04 m³ m-³, individualmente para todos os
solos. Foi evidenciado que tal FPT foi um melhor avaliador da CC do que o método tradicional que utiliza diretamente a umidade a uma sucção arbitrária. Os dados de CC foram compatíveis com uma base de dados equivalente e mais abrangente dos Estados Unidos obtida da literatura, principalmente para amostras de solo de textura média. Uma causa das diferenças entre as CCs das duas bases de dados com solos de textura fina foi em razão dos seus tempos de drenagem diferentes. Assim, recomenda-se um procedimento padronizado para a determinação
in situ da CC.
Termos de indexação: drenagem interna, capacidade de aeração, retenção de água no solo.
INTRODUCTION
Field capacity (FC) is a soil parameter that is widely used in soil hydrology, land management, and irrigation and drainage engineering. Such broad use of FC is motivated by the frequent occurrence of the drainage from upper soil layers which is associated with significant wetting (rain or irrigation). Primarily depending on the hydrodynamics and the water retention characteristics of soils, more or less water is drained from the upper soil layers following their wetting, allowing for better aeration and water distribution in the rhizospheres, groundwater recharge, and leaching of chemicals from the top soil layers. In these cases, the drainage rates often decline drastically, usually as a negative-power function of time (Hillel, 1998); thus, for practical purposes, there is a quasi-steady state water content (FC) distribution in the wet upper layers shortly after the end of wetting. Thus, FC has been assumed to be a practical upper limit of soil water storage for plant use, and its corresponding air content could be considered a lower air capacity limit of the rhizosphere. The above concept corresponds to the original definition of FC by Veihmeyer & Hendrickson (1949), which was slightly modified in the Glossary of Soil Science Terms (SSSA, 1984), as: “FC is the amount of water remaining in soil two or three days after having been wetted and after free drainage is negligible”. Despite the broad application of FC, its concept bears substantial uncertainty (Cassel & Nielsen, 1986; Hillel, 1998; Nachabe et al., 2003). Indeed, for a more precise definition of FC, what a negligible free drainage rate
is must be better stated. In addition, profile wetting and initial soil moisture before water application are not precisely described, which may be relevant, particularly when hysteresis in soil water redistribution after infiltration (Hillel, 1998) is significant. Evapotranspiration is not specifically mentioned in the original definition of Veihmeyer and Hendrickson either, nor is it recognized in the Glossary of Soil Science. Another question is the presence of impeding or highly permeable layers and phreatic levels, as well as the influence of lateral flow in sloping landscapes. Indeed, all these factors must be clarified before FC can be considered a reproducible, consistent, and intrinsic soil water variable as it has generally been accepted. By intrinsic soil property we mean (as in Hillel, 1998) a soil datum whose magnitude does not depend on the way it is measured. Despite the fact that the above factors are not clearly identified in
the FC definition, in situ-determined FC reportedly
Parkin et al. (1995) presented an analytical solution for transient water storage and the hydraulic gradient at any finite depth within a deeply wetted, homogeneous soil profile subjected to vertical drainage (with zero evapotranspiration). These authors showed that the hydraulic gradient, which somewhat depends on depth, time, and soil properties, is slightly less than 1.0 in this profile. Hence, it is possible that virtually uniform water content distributions may not develop after a given drainage time, even in homogeneous soils (Reichardt, 1993). Considering weather-related factors, we are not aware of studies designed to specifically correlate rain and/or evapotranspiration regimes to the FC concept. The slopes and shapes of the landscape can influence FC by deforming the infiltration and drainage flow geometry and flow rates with respect to the standard vertical pattern assumed for nearly flat lands. Some studies previously determined infiltration and related vertical and lateral percolation fluxes in hillside lands (Mendoza & Steenhuis, 2002; Bodhinayake et al., 2004), but, to our knowledge, no studies have shown the dependence of FC on landscape slopes or shapes.
Nemes et al. (2011) stated that an international effort seems to be desirable to improve and standardize the FC estimation. The most common procedure for evaluating FC is based on the same field experiment used in the instantaneous profile method for determining the vertical unsaturated hydraulic
conductivity function K(θ) (Cassel & Nielsen, 1986;
Paige & Hillel, 1993; Romano & Santini, 2002), in which a plot on a bare field is flooded and, after irrigation, covered with a plastic sheet to avoid evaporation. The vertical distribution of moisture in the upper part of the soil profile, which was fully moistened (quasi-saturated) at the end of infiltration, usually measured two or three days after water application, defines the FC profile. The FC profile determined by the above procedure usually depends on the texture and structure of the individual soil layers (Salter & Williams, 1965b). Based on this dependence and on the operational difficulties of the field test, FC is also commonly evaluated in a laboratory setting as the water content of undisturbed soil samples (or disturbed samples, which is less acceptable) at a specific soil water matric potential. Cassel & Nielsen (1986), Romano & Santini (2002) and Nemes et al. (2011) reported that a wide range of matric potentials (from -2.5 to -50 kPa) have been used for this purpose, although suctions of 5, 6, 10, and 33 kPa are more common choices; however, there is no satisfactory general criterion for the selection of the suction values for this kind of FC determination (Hillel, 1998; Twarakavi et al., 2009; Nemes et al., 2011). Taking into account the dynamic nature of drainage in field FC evaluations, some authors (Nachabe et al., 2003) argue that the definition of FC must be based on a particular choice for the “negligible” downward flux, instead of the usual drainage time of two or three days, or the suction at FC. Meyer & Gee
(1999) considered that such selected small fluxes could
be between 0.01 and 1.0 mm d-¹, depending on the
type of application, and Andrade & Stone (2011) used the “negligible” flux of 1 % of the soil saturated hydraulic conductivity. Based on a flux-based FC criterion and on simplifying assumptions (unit hydraulic gradients in homogeneous profiles, among others), Nachabe (1998) and Romano & Santini (2002) derived expressions for FC that are dependent on the choice of the “negligible” flux, as well as on soil properties. When FC is evaluated by the flux-based method, the drainage times can vary greatly, even for an individual soil, from dozens of hours to dozens of days, depending on the chosen flow rate, as clearly demonstrated in Hillel (1998). Overall, although FC is a widely applied basic soil parameter, there is no unified or exact understanding of it.
In this study, a variation of the definition of FCis
proposed and empirically tested, while maintaining its practical meaning. The goal is to minimize the problems associated with the FC measurement in the field by creating a theoretical and practical framework for the proper and reproducible evaluation of the sequenced processes of infiltration (ponding) and internal drainage in the top soil layer. This will enable the standardization of experimental procedures, as well as the use of current mathematical tools, such as analytical and numerical modeling, and pedotransfer functions (Pachepsky & Rawls, 2005) to determine FC profiles as required by engineers and land use planners. To our knowledge, Cassel et al. (1983) were the first to apply pedotransfer functions (PTFs) to evaluate field-determined FC. Based on the same data set used by them (312 soil samples from the USA), which was well described by Ratliff et al. (1983), Ritchie et al. (1999) presented a simple PTF, here called the Ritchie equation, based only on soil bulk density and two granulometric fractions, which gave similar or better results than the model of Cassel et al. (1983). Using particle size distribution, bulk density, and the Arya & Paris (1981) model to predict water retention curves, Gerakis & Zalidis (1998) proposed a physical method to estimate field-determined FC. The method considers similarities between the particle size distribution curve and the soil water retention curve. However, it does not perform as well as the Ritchie equation for the data set mentioned above. Subsequently, Macedo et al.
(2002) derived PTFs for the in situ determination of
FC of four Brazilian soils (n=44 soil samples) with the same predictor variables commonly used in PTFs for soil water retention, namely textural contents, organic matter content, bulk density, and water content at a specific suction (Williams et al., 1992; Nemes et al., 2003; Saxton & Rawls, 2006). Potential
use of PTFs for in situ FC prediction was also indicated
by Bell & van Keulen (1996) and Nemes et al. (2011).
In this study, PTFs for in situ FC are derived from
in the analysis. This extended data set has also been used to evaluate the Ritchie equation. However, we emphasize that, in this paper, PTFs are used mainly
to prove that, for some soil profiles, the in situ FC
measured by the standardized method proposed below can be considered an intrinsic soil property.
MATERIAL AND METHODS
Variation of the FC definition
Field Capacity (FC) is here defined as “the vertical distribution of the volumetric water content in the upper part of a soil profile that, in the course of ponded infiltration (of water of any source and with ponding depth smaller than 10 cm), becomes fully wetted at the end of infiltration and remains exposed to the subsequent process of drainage without evapotranspiration or rain for 48 h.”
We propose the above definition to standardize FC measurements and to minimize uncertainties and difficulties in the FC field experiments. In this definition, FC is considered to be a moisture profile [FC(z)] (Figure 1), instead of a strict water content value of a soil sample, since it is conceived to somehow represent the drainability of the upper part of a soil under standardized field conditions. For the sake of brevity, we will call it FC, instead of FC(z), in most of the text. Since the water source is not specified, water quality effects are ignored. Shallow ponding is considered as the irrigation method and FC is the soil water distribution in the profile 48 h after infiltration is complete. Measurements are made only in the upper part of the profile, above the infiltration wetting
front, which ismonotonically drained from saturation
or quasi-saturation so that the hysteresis effects are minimized (Hillel, 1998). Figure 1 presents the three main soil moisture profiles associated with the FC definition. Based on the initial water content distribution θi(z) (before irrigation) and applied water
depth W, the two other vertical distributions can be measured or modeled: the water content at the beginning of drainage (at the end of infiltration of W),
θo(z), and the water content after 48 h of drainage,
θ48(z). Therefore, θ48(z), z< D, is the FC distribution,
where D is the wetting front depth at the end of
infiltration, which is dependent on θi(z) and W. Thus,
for a given soil, it is assumed that:
FC(z) = FC (θi(z),W) = θ48(z), z< D, (1)
where
(2)
The period of 48 h was chosen as a classical value (Cassel & Nielsen, 1986), and also because two days of drainage is a frequently used time period to infer crop damage through lack of soil aeration (Ochs et al., 1980; Hillel, 1998). As a result, FC data can be used to evaluate soil profile aeration. Moreover, if a longer period were chosen, rain between irrigation and FC measurement would be more probable, which is an obvious inconvenience. We have not adopted a negligible constant downward flux, due to the difficulties in measuring small deep percolation flows in the field and due to the long test duration required for slow-draining profiles, sometimes over a week, which is particularly deleterious in wet climates because of the high frequency of rain.
Lateral soil water flows in sloping landscapes were indirectly taken into account in this FC definition, which is the reason why, considering the water balance in the soil profile, the terms of equation 2 are not exactly equal. Rain and evapotranspiration effects were considered null during the 48 h of drainage; for that reason, a soil surface shelter has to be used. However, rain and evapotranspiration regimes influence the genesis of the θi profile; therefore, these
weather-related factors may interfere, but only indirectly. In addition, it is apparent that the FC profile may depend on soil conditions below depth D,
but above z48 (Figure 1). Extreme examples of such
dependency are shallow R-layers (rock) and phreatic levels below D.
The horizontal areal extent of the infiltration and drainage processes cited in the definition was not mentioned because it was implicitly assumed to be infinite. Thus, the dimensions of the experimental plot for the FC test must be large enough to adequately simulate the actual, infinitely large, soil water flow of the definition at the test site. For this reason, measurements must be made at the center of the plot. At the same time, for practical purposes, the flooded
area must be minimized. We address this problem in another paper (Ottoni Filho et al., 2014), where the use of double-ring infiltrometers (Bouwer, 1986) is proposed in the determination of FC. These are devices that cover a limited surface area and are largely utilized in infiltration and hydraulic conductivity tests.
Experimental procedure
The main FC data set of this study was collected
in a 13 km2 pastured watershed located in the
municipality of São José de Ubá (S. J. Ubá), RJ, Brazil (21o 21' 58" S and 41o 57' 04" W). Bhering et al. (2005) surveyed the soils of this basin and 12 units were identified as being representative of the area. One extra unit of the basin, PE (Table 1), was added to the data set. The climate of the region is tropical humid, with a rainy summer. Fieldwork was performed during the dry season of 2004, late fall and winter. The land is nearly level at the bottom of the valley and the hillsides have a rolling topography, ranging from gently sloping to steep.
For the FC test, at each site, two (replicates) metal frame dikes (1.0 × 1.0 m × height = 0.25 m), as recommended by Embrapa (1979), were driven about 5 cm into the soil, 10 m apart from each other, near the soil survey trench. The landscape slopes at the experimental sites ranged from zero to approximately 20 %. At the highest slopes, it was necessary to level
the terrain in the upper half of the 1.0 m2-plot area
(maximum cut depth of 10 cm) in order to make ponding uniform. The grass was mowed, but the roots were kept in the soil in the plots within dikes. Irrigation depths of W = 350 mm (350 L) were applied to soils (Table 1) P4, P5, P15, P21, P24, and PE; W = 300 mm to P22; W = 250 mm to P6, P27, P32, P34, and P36; and W = 100 mm to P20. The ponding depth of all the sites was always maintained less than 10 cm. The last soil has a shallow profile, with rocks at a depth of 30 cm, which is the reason for the small value of W. Determination of antecedent soil moisture profiles near the experimental plots indicated that the water volumes used were sufficient to saturate the
Soil identification Soil classification Depth Texture Porosity (4)
Field Total Micro(5) Macro(6) capacity(7)
cm m³ m-³
P5 Lithic Eutrudept 0-30 sandy loam 0.477 0.238 0.240 0.219
30-50(1) sandy loam 0.457 0.228 0.229 0.184
P22 Lithic Eutrudept 0-30 clay loam 0.469 0.307 0.162 0.282
30-60(2) clay loam 0.438 0.342 0.096 0.306
P34 Typic Eutrudept 0-30 sandy loam 0.445 0.258 0.187 0.195
30-70 sandy clay loam 0.408 0.258 0.151 0.192
P27 Typic Hapludalf 0-30 sandy clay loam 0.476 0.308 0.168 0.244
30-70 sandy clay loam 0.448 0.318 0.131 0.254
P24 Typic Paleudalf 0-30 sandy clay 0.419 0.314 0.105 0.293
30-70 clay 0.445 0.418 0.028 0.385
P32 Typic Paleudalf 0-30 clay 0.508 0.270 0.238 0.211
30-70 clay 0.461 0.330 0.131 0.273
P20 Lithic Quartzipsamment 0-30(3) sandy loam 0.469 0.296 0.173 0.232
P6 Typic Fluvaquent 0-30 sandy clay loam 0.389 0.228 0.161 0.177
30-70 clay 0.414 0.258 0.156 0.195
P21 Mollic Fluvaquent 0-30 loam 0.432 0.345 0.087 0.323
30-70 clay 0.459 0.438 0.050 0.403
P15 Aquic Hapludult 0-30 loamy sand 0.455 0.155 0.300 0.159
30-70 sandy loam 0.457 0.179 0.278 0.183
P36 Aquic Hapludult 0-30 sandy loam 0.400 0.223 0.177 0.209
30-70 sandy clay loam 0.381 0.297 0.084 0.280
P4 Kanhaplic Haplustult 0-30 sandy clay loam 0.395 0.330 0.065 0.300
30-70 clay 0.427 0.409 0.019 0.378
PE Non-classified 0-30 sandy loam 0.449 0.197 0.252 0.192
30-70 sandy clay loam 0.396 0.264 0.132 0.233 Table 1. Surveyed soils: classification and mean textural and water retention properties along the profile
(1) A transition for a R-layer was found at the 50-cm depth; (2) A transition for a R-layer was found at the 60-cm depth; (3) A R layer
was found at the 30-cm depth; (4, 7) Water retention properties obtained by the methods presented in the Experimental Procedure
soil profiles in the depth ranges shown in table 1. The greatest depth shown in table 1 for each soil defined the profile length (smaller than D - Figure 1) at which the FC determinations were made. At the end of infiltration, the wetted areas were covered with a plastic sheet and, 48 h later, two undisturbed core samples (55-mm diameter, 40-mm height) were taken in each frame at each chosen depth, near the center of the plot and opposed to each other in relation to the center of the plot, generally from the middle of each identified soil horizon. The value of any soil property that was evaluated from these samples was taken as the arithmetic mean of the measurements made for each pair of samples at the corresponding depth and plot. The samples were sealed to prevent water loss, weighed for FC calculation, and then capillary-saturated for Richards pressure plate chamber determinations at matric potentials of 6.0, 33, and -1,500 kPa, which yielded volumetric water contents of θ(6), θ(33), and θ(1500), respectively. Bulk density (BD) was obtained from the weight of the dried cores after water retention measurements. Disturbed samples were also taken from the center of the plot at the same depths as the core samples and used to determine the sand, silt, and clay contents according to the USDA classification through the densimeter method (Embrapa, 1997), particle density (PD) through the volumetric flask method (Embrapa, 1997), and organic matter content (OM) by multiplying the organic carbon content as determined by the Walkley-Black method by 1.72 (Nelson & Sommers, 1982). Total porosity was calculated from bulk density and particle density [TP = 1 - (BD/PD)].
An additional experiment was conducted for six soils (P4, P5, P6, P15, P22, and P34) to investigate the FC dependence on the water depth W. Triplicate
1.0 m2 frames were installed in a triangular
configuration with sides 1.0 m apart to minimize spatial variability effects. Each plot was subjected to different water depths (W = 100, 200, or 300 mm) and the FC measurement was conducted as previously described. Bulk density was also determined for the samples used in the FC measurement. Initial water
content (θi) was determined by applying the
gravimetric method in duplicate for disturbed samples taken outside of each plot area in the center of two opposing sides of the dikes. The bulk density was used to transform gravimetric content into volumetric
content, θi. FC, BD, and θi were determined for each
soil at the same depths (three or four, at the center of the soil horizons) in the three plots.
Data analysis
Correlation and linear regression analyses (13 soils, n=92) were applied to examine the relationships
between FC and sand, silt, and clay contents, θ(6),
θ(33), θ(1500), BD, and OM. Our focus was on testing
the use of PTFs obtained by linear regression in the determination of FC. Root mean squared residues
(RMSRs) and the non-parametric Wilcoxon test (Bradley, 1968; Zar, 1999) were used to evaluate performance of FC estimation. The analysis was extended by the inclusion of data from nine additional previously surveyed Brazilian soils from the literature, largely from the State of Rio de Janeiro. Soil data for these profiles, including FC, were gathered by the same methods described before. Detailed descriptions of the soils and soil data are found in Fabian & Ottoni Filho (2000), Thurler (2000), and Macedo et al. (2002). Most of the units are Udic Kandiustalfs. Thus, our extended data set consists of 22 (13+9) soils (n=165) and includes all USDA textural classes, with the exception of the four silty classes.
RESULTS AND DISCUSSION
FC dependence on θθθθθi and W
According to our FC definition, the proposed field method indicates that the FC profile [FC(z)] is a
function of θi(z) and W (Equation 1). This section
examines whether this dependence is relevant. Figure
2 shows the FC and θi data for six soils (n=22) from
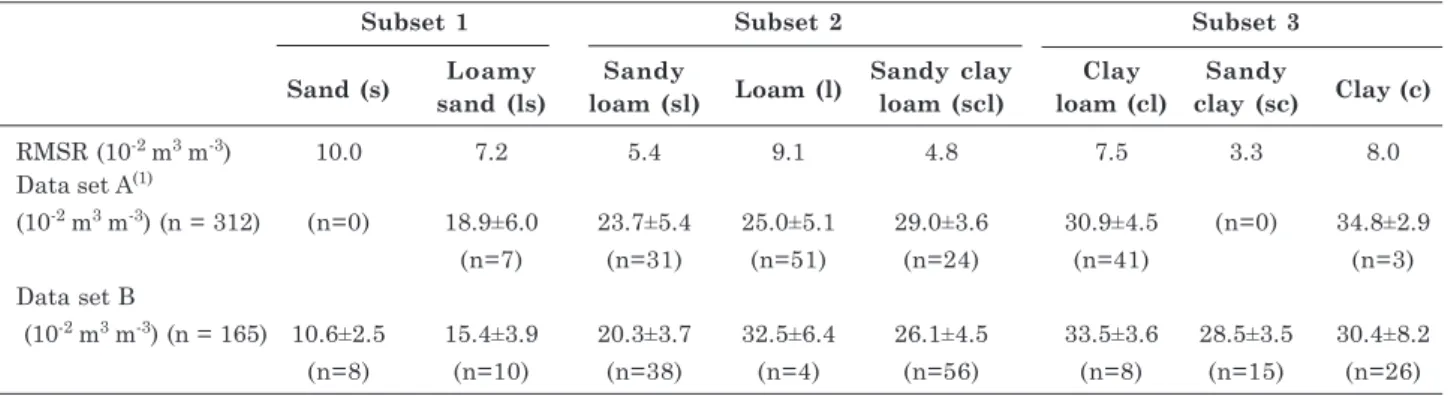
the S.J. Ubá region when three closely spaced FC trials were performed with the simultaneous application of distinct water depths. As indicated in figure 2 and supported by Wilcoxon test results, FC was not sensitive to W, at least in the 100 to 300 mm range. The data point scattering around the 1:1 line, given
by RMSR, is partly due to spatial variability. θi is
more scattered than FC, which indicates greater
similarity among FC values as compared to θi. However,
the total porosity of the 22 samples, calculated from bulk density and particle density determinations, indicates that five out of the six soils were not saturated at the end of infiltration with W = 100 mm at all of their sampled depths. For W = 200 or 300 mm, the infiltration wetting front was below the sampled depths in all profiles. Therefore, although not recommended by our definition, FC may be reproduced by using less water than the amount that fully wets the upper soil profile.
In the following discussion, the FC dependence on
θi and W is analyzed for soils outside our database.
From an analytical solution of the Richards equation applied to a homogeneous silty clay loam profile and ignoring hysteresis, Warrick et al. (1990) (in their
examples 1 and 2) showed that θ12(z) and θ24(z), the
soil moisture profiles at 12 and 24 h of drainage without evaporation, were both nearly invariant with W for the deeply wetted (W = ) and partially wetted profiles (finite W), z<D = 0.25 m, which is the wetting front depth of finite W. In both wetting situations
θi = 0.11 m3 m-3 (dry soil), and the wetted soils were
of Warrick et al. (1990). From the experiment of Gardner et al. (1970), it is possible to infer the
influence of both W and θi on the θ48-profiles from
ponded infiltration-drainage trials (with suppressed evaporation) in two 1.60-m long homogeneous packed soil columns. The material was a fine, sandy loam that was wetted by keeping a 1 cm head of water above the surface, in the following two trials: (a) three successive applications of W = 50 mm, followed by drainage intervals of about 30 days; (b) two successive applications of W = 100 mm, followed by a drainage interval of 33 days. The antecedent moisture of the first irrigation was about the same in the two columns
(θi 0.04 m3 m-3). From figures 2 and 3 in Gardner et
al. (1970), it is possible to infer the depths of the infiltration wetting fronts and the values of the uniform FC profiles during the irrigation-drainage cycles (our Table 2). With the exception of the first
cycles, the θi(z) of the other cycles varied strongly,
since it coincided with the soil moisture distribution at the end of the previous redistribution. An analysis of table 2 indicates that, except in the case of the first cycle of W = 50 mm, for practical purposes, FC was
invariant with respect to θi(z) and W. When a small
W (W = 50 mm) was applied to a dry soil, the suction gradients during the first two days of redistribution
were likely to be strong enough to force θ48(z) in the
top of the column to become 0.25 m3 m-3, making it
significantly less than the FC for the other cases, which
was about 0.33 m3 m-3. In a study by Salter &
Williams (1965a), the θ48(z) of 11 soils (about 88
samples), representing a wide range of textures, were determined under field conditions for two distinct θi(z)
profiles, in early spring (March) and in mid-summer (July). Concerning the FC trials repeated in these two months, soil evaporation was suppressed and the samples were collected from identical sites and depths. Although the infiltration application was not detailed, the authors noticed that the soil profiles were wetted with sufficient water, which could have been from rain or irrigation. That study demonstrated that the summer FC was lower than the spring FC in approximately 40 % of the cases, as shown in their figure 1b, coinciding in the other instances. We can infer that a significant number of their FC plots may have been wetted by summer rain of unknown intensity and time distribution and which did not necessarily wet the soils by ponded infiltrations. Therefore, it can be considered that this experiment
supports an invariance of FC with respect to θi.
FC dependence on basic soil properties
The Pearson correlation coefficients (r) between FC and the soil properties for the S. J. Ubá experiment (n=92) and for the extended data set (n=165) are given in table 3. Both data groups present significant
Cycle W = 50 mm W = 100 mm
θ θθ
θθi D FC θθθθθi D FC
m3 m-3 m m3 m-3 m3 m-3 m m3m-3
1st 0.04 0.05 0.25 0.03 0.14 0.33
2nd - 0.10 0.33 - 0.23 0.33
3rd - 0.17 0.34
Table 2. Results of infiltration-drainage trials conducted in two homogeneous packed fine sandy loam columns where successive ponded irrigations with water applications of W = 50 mm (one soil column) and W = 100 mm (other soil column) were made. Soil moisture after 48 h of drainage (FC) presented quite a uniform distribution in the length D profile, which is the depth of the infiltration wetting front. Antecedent moisture θθθθθi(z) in the 2nd and 3rd cycles was the soil moisture profile at the end of the
previous redistribution process
Figure 2. Field capacity (FC) and initial soil water content (θθθθθi) at the plot where water application is W = 200 mm,
compared: (a) FC and θθθθθi where W = 300 mm; (b) FC and θθθθθi where W = 100 mm. *: means that the variables
correlations between FC and basic soil properties, excluding BD and OM for the S. J. Ubá data. The most significant correlations were between moisture retention data [θ(6), θ(33), and θ(1500)], especially for
θ(6), where r 0.94. This is an indication of the
important influence of soil structure on FC, which was greater than the influence of texture. However, according to the data set (n=44) in table 3 of Macedo et al. (2002), the dependence of FC on texture, as well as on OM, is much stronger than in our results (n=92). Their coefficient of correlation between FC and OM was about 0.60. In both studies and considering the
variables in our table 3, θ(6) is the property with the
highest correlation with FC, and silt is the least correlated textural content.
FC dependence on soil morphology and phreatic level
FC was estimated by linear regression analysis of
FC and θ(6) data for the S.J. Ubá experiment. The
regression equation is:
FCc = -0.01184 + 0.9178 θ(6) (3)
where θ(6) and FCc are in m3 m-3, with R² = 0.9076
and RMSR = 0.0222 m3 m-3. Since this calculated field
capacity (FCc) is based only on θ(6), it is an intrinsic
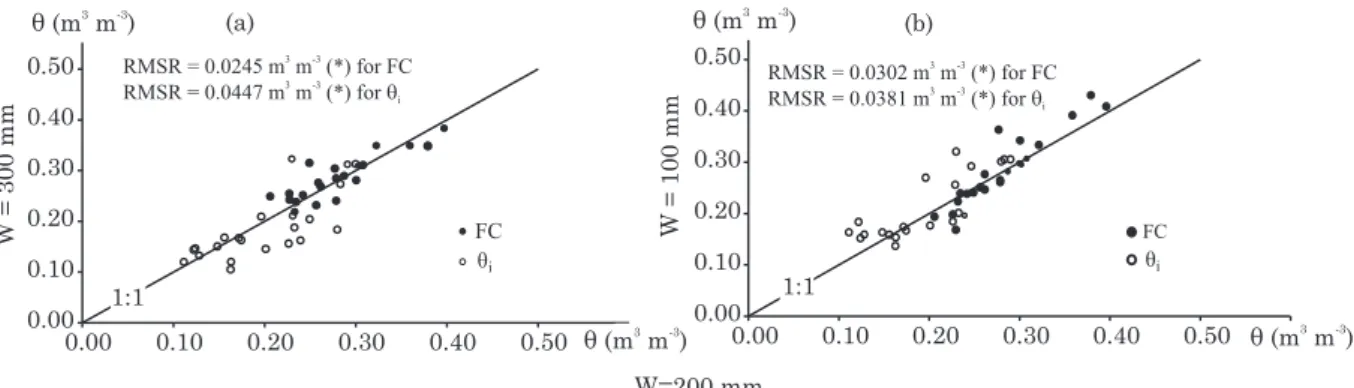
soil property to the same extent that θ(6) is. Therefore, if there were a trend for measured FC to vary strictly with depth, there would be a bias in figure (3a or b),
which show the curves of FCcvs FC for the shallowest
and deepest samples of the profiles of the 13 soils, respectively. Such a bias is not observed in figure 3, and its absence is confirmed by the Wilcoxon test. This indicates that there was no overall tendency for
the variation of FC data with depth due to a layering sequence, departure from the unit hydraulic gradient, or other reasons that are not strongly dictated by variations in the basic soil properties that are related
to FC, such as θ(6). The same conclusion can be drawn
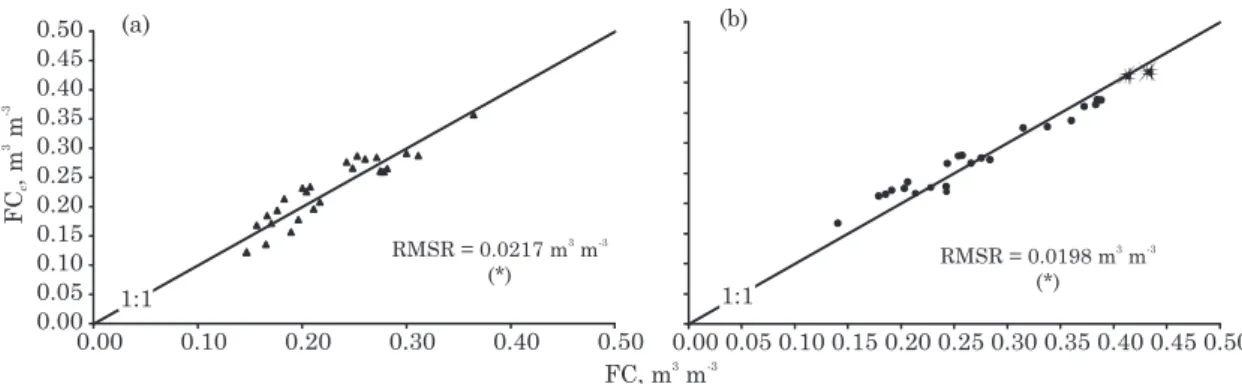
from the data of Macedo et al. (2002), based on a similar analysis. Such a conclusion can be partially explained by the fact that, among the 12 soils identified in S.J. Ubá, none had an abrupt discontinuity layer (such as a permeable pan or impeding layer) in the sampled profile (Table 1). Most of the profiles showed increasing clay content with depth, which was also verified in the soils studied by Fabian & Ottoni Filho (2000), Thurler (2000), and Macedo et al. (2002). However, below the infiltration wetting fronts of the FC trials, the lowland (Fluvaquent) soils P6 and P21 had a high phreatic level, and P5, P20, and P22 had a shallow R-layer or CR-horizon, which may interfere with topsoil drainage. In order to determine whether such interference is
effective, the scattergrams of FCc vs FC were plotted
for P6 and P21 (Figure 4a), and for P5, P20, and P22 (Figure 4b). Again, an apparent bias was not demonstrated in figure 4(a,b). Additionally, the RMSRs between the measured and calculated FC data in figure
4 are small (around 0.021 m3 m-3). This suggests that
FC(z) depended largely only on intrinsic soil properties at any depth z, even for the soil profiles with probable limiting characteristics with respect to drainage.
FC determination by PTFs
In this study, PTFs are employed primarily for
testing if FC, as an in situ-determined parameter
measured by standard procedures, can be considered
Figure 3. Relationship between measured field capacity (FC) and FC calculated by equation 3 (FCc) for: (a)
shallowest samples (n=26), and (b) deepest samples (n=25). *: means that FCc is statistically
indistinguishable from FC (at p<0.05), according to the Wilcoxon test.
Sand Silt Clay θθθθθ(6) θ(33)θθθθ θθθθθ(1500) Organic matter Bulk density
n = 92 -0.652* 0.408* 0.481* 0.953* 0.923* 0.891* 0.174 -0.018
n = 165 -0.720* 0.371* 0.628* 0.926* 0.795*(1) 0.825*(1) 0.223* -0.213*
Table 3. Pearson correlation coefficients between the field capacity and basic soil properties from two data sets (n= 92 and 165)
(1) Calculated for n= 149, since the study of Fabian & Ottoni Filho (2000) (n= 16) does not include information on θ(33) and
an intrinsic soil variable, i.e., a variable that can be determined simply from basic soil data. In order to test PTF effectiveness in calculating FC, the broader data set (n=165) was divided into the three following subgroups, each one composed of soils from similar parent material and from geographically close locations: (1) S. J. Ubá (n=92); (2) Seropédica (n=60) -one soil from Fabian & Ottoni Filho (2000), and four soils from Macedo et al. (2002); and (3) Campos (n=13) - four soils from Thurler (2000). The first PTF tested was the linear regression equation between FC and
θ(6) data from the S.J. Ubá samples (Equation 3).
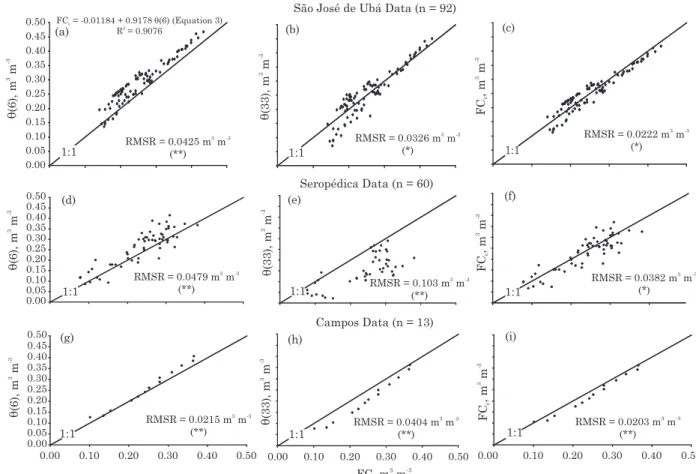
The performance of equation 3 was tested against the method that considers FC as the water content at a
selected suction. Figure 5 gives the results for θ(6)
and θ(33) as FC estimates, as well as for the values
calculated by equation 3, for the three data sets listed above. In all cases, equation 3 gives better
estimates than the values of θ(6) or θ(33). Even for
the sample sets used to validate equation 3 (Seropédica and Campos), the resulting mean residues were not significant (Figure 5f,i). The largest RMSR
(0.0382 m3 m-3) obtained by applying equation 3 was
for the Seropédica data; but, in this case no bias was indicated by the Wilcoxon test (Figure 5f). FC was slightly underestimated by equation 3 (Figure 5i)
in the Campos soils, with an RMSR (0.0203 m3 m-3)
even smaller than the corresponding residue
(RMSR= 0.0222 m3 m-3, Figure 5c) for the calibration
data set. Only for the S.J. Ubá soils did θ(33) perform
better than θ(6). In this case, θ(33) is an unbiased FC
estimate, with RMSR = 0.0326 m3 m-3 (Figure 5b).
However, it poorly estimated FC for the Seropédica
data set (Figure 5e). Although θ(6) performed fairly
in the three locations, it tended to be larger than FC. The Seropédica site had the greatest mean residue
when θ(6) was used as an estimate of FC (RMSR =
0.0479 m3 m-3, Figure 5d).
According to the above analysis, a linear function of water content at a given matric potential can
estimate FC better than the traditional choice of a particular value of water content [θ(6) or θ(33)] in itself. This analysis can be extended by considering other PTF models for FC. Thus, a multiple linear regression was developed to express the relationships between the FC data and the variables in table 3 [excluding
θ(1500)], considering the complete available data set
(n=165). Six PTF models (M1 to M6) were evaluated. Their coefficients and RMSRs are shown in table 4. The RMSRs are within the range commonly found in the literature for soil water content PTFs (Nemes et al., 2003; Saxton & Rawls, 2006). Better FC predictions were obtained when BD and OM were added to sand, silt, and clay contents as input variables, coinciding with Romano & Santini (2002). When these five variables were considered (model M4), the resulting
RMSR was 0.0458 m3 m-3. When θ(6) was added as
an input variable (model M6), FC estimation improved
significantly. However, for model M5, in which θ(6)
was the sole predictor, RMSR (0.0281 m3 m-3) was
only marginally larger than its correspondent, M6, a sophisticated model that had six predictors. Model M3
had only one predictor, θ(33), and, as its RMSR was
0.0463 m3 m-3, it performed as model M4. This
suggests that the soil water content is a useful input
variable in the prediction of in situ FC (Nemes et al.,
2011), which is generally the case with soil water content evaluation by PTFs (Nemes et al., 2003; Schaap et al., 2004).
PTF effectiveness was also evaluated on the scale of a single soil profile. Therefore, models M5, M6, and equation 3 were applied to each of the 22 soils. The respective RMSRs are shown in table 5. The mean RMSR (mRMSR) and its sum with the corresponding standard deviation (mRMSR+ sdRMSR) were also calculated for each soil subgroup. Thus, for most individual soils from the S.J. Ubá or Campos regions, the corresponding FC residues would be expected to
be less than 0.0304 or 0.0251 m3 m-3 (Table 5),
respectively, if any of the three models were applied.
Figure 4. Relationship between measured field capacity (FC) and FC calculated by equation 3 (FCc) for: (a)
soils (P6 and P21) with shallow phreatic level (n=16); and (b) soils (P5, P20, P22) with shallow R-layer or CR-horizon (n=18). *: means that FCc is statistically indistinguishable from FC (at p<0.05), according to
The values of these statistics were larger for the
Seropédica area (mRSMR + sdRMSR 0.0437 m3 m-3),
but they were still within a reasonable range for PTF evaluation. As shown in table 5, the performances of M5 and M6 are close to each other on the single soil
scale, confirming the high predictive power of θ(6).
As expected, the local performance of equation 3 was slightly inferior to that of M5 and M6 for the Seropédica and Campos soils, as data from these soils were not used in its adjustment.
The good performance of PTFs, even at the single-soil scale, demonstrates that is possible to determine
in situ FC from basic soil properties with relatively small errors. In the present case, the maximum RMSR
for any individual soil was around 0.04 m3 m-3 (Table
5). As the test sites of the extended data set are located on landscapes with varying slopes, ranging from nearly level to moderately sloping lands (maximum slope around 20 %), we infer that slope effects on FC were marginal as compared to the effects of basic soil
Figure 5. Relationships between measured field capacity (FC) and θθθθθ(6), θθθθθ(33), and FCc = - 0.01184 + 0.9178 θθθθθ(6)
(Equation 3) for the S.J. Ubá data (a, b, c, n=92), Seropédica data (d, e, f, n=60), and Campos data (g, h, i, n=13). * and **: mean that the variable at the vertical axis is statistically indistinguishable (at p<0.05) or statistically distinguishable (at p<0.01) from FC, respectively, according to the Wilcoxon test.
Model Sand Silt Clay OM BD θθθθθ (6) θθθθθ (33) Constant RMSR
m3 m-3
M1 0.08478 0.4048 0.3792 0.03533 0.05140
M2 -0.02310 0.3912 0.3010 0.1077 -0.04645 0.04970
M3 0.6561 0.1043 0.04630
M4 0.1678 0.5967 0.4977 2.241 0.1190 -0.2877 0.04580
M5 0.8476 0.01181 0.02810
M6 0.03160 0.09379 0.03302 -0.3359 0.05547 0.8638 -0.1156 0.02700
Table 4. Coefficients of multi-linear PDFs for field capacity, calibrated from the extended data set (n=165). Models are enumerated in a decreasing order of the corresponding RMSRs
data. This is at least partially consistent with the experimental findings of Bodhinayake et al. (2004), who demonstrated that ponded infiltration in double-ring infiltrometers was not affected by slopes smaller than 20 %.
In the following analysis, we evaluated the Ritchie equation:
FCR = 0.186 (BD/ρw) (sand/clay)-0.141 (4)
where FCR is in m3 m-3, BD in kg dm-3, ρ
w = 1.0 kg dm-3,
and sand and clay in kg kg-1, for our extended data set
(n=165). Using the least squares method and our data
of BD, sand, and clay, we first adjusted the two parameters of the Ritchie model to minimize FC estimation errors (Equation 5):
FCR,a = 0.193 (BD/ρw) (sand/clay)-0.289 (5)
The resulting RMSRs, 0.0618 m3 m-3 (Equation 4)
and 0.0550 m3 m-3 (Equation 5), are greater than the
corresponding RMSR for Model M2 (0.0497 m3 m-3)
which is shown in table 4. M2 is the linear model that includes the same predictors as the Ritchie equation (particle size fractions and BD). Hence, the inverse power-function form of equations 4 and 5 performed worse for our data than the corresponding multi-linear form.
It should be emphasized that the FC data used to calibrate the Ritchie equation (Equation 4) may not represent the same FC variable as in the current paper. In the following discussion, the soil data used by Ritchie et al. (1999) to calibrate equation 4 (n=312 samples) we called “A”, and our extended data set, “B”. The main reasons for possible discrepancies between the measured FC of A and B are: i) the wetting method used with A was not always the same as that of B; ii) there were water losses and gains due to evaporation and rain occurrence in some soil sites of A that were not covered with impermeable material; iii) in A, many soil samples were taken deeper than 1.0 m. Thus, it is probable that the amount of infiltrated water was not sufficient to fully wet (saturation or quasi saturation) the profile up to such depth before monotonic drainage started. This is especially relevant for hydrologic processes which cause hysteresis in water retention, as is the case of moisture redistribution in partially wetted profiles (Hillel, 1998); and iv) in A, some FC measurements were taken at drainage times quite different from the 48 h duration of B. In A, the measurement was performed only when the drainage rate was from about
0.001 to 0.002 m3 m-3 per day at all depths, which
usually occurred after 2-12 days of water application (in some fine-textured and slowly draining profiles, it took up to 20 days). If there are no restrictive layers to internal drainage, this cause (iv) for FC differences between A and B will probably be more relevant for fine-textured samples. It may be the most relevant reason that explains the possible discrepancies in the measured FC of the two field data sets.
Since we had no detailed information on soil data set A, the Ritchie equation was applied to set B in order to speculate and discuss the possible differences between measured FCs from both data groups. As a
result of the high RMSR (0.0618 m3 m-3) found when
the Ritchie equation was applied to B, each data set (A and B) was divided into three subsets (1, 2, and 3) according to textural class groupings (Table 6), following Cassel et al. (1983): A1 and B1 (coarse-textured), A2 and B2 (medium-(coarse-textured), A3 and B3 (fine-textured). The mean and standard deviation of the measured FC in various textural classes are shown in table 6, as well as the RMSR values when equation
Soil n RMSR
M5 M6 Eq.3
10-2 m3 m-3 S. J. Ubá
P5 6 1.68 1.78 1.61
P22 6 1.47 1.34 1.58
P34 6 3.78 3.86 3.22
P4 8 1.53 1.02 1.23
P24 8 1.72 1.63 1.52
P32 8 2.48 1.20 2.16
P20 6 3.10 2.42 2.81
P6 8 3.20 3.52 2.60
P21 8 1.99 1.28 1.70
P15 8 1.83 2.41 2.96
P36 8 1.99 1.49 2.18
P27 4 3.06 2.13 2.87
PE 8 1.32 1.51 1.82
mRMSD 2.42 1.97 2.17
mRMSD + sdRMSD 3.04 2.85 2.83
Seropédica
PVd5 11 4.14 4.04 4.26
PVe1 12 4.01 4.16 4.17
PVe6 11 2.60 2.57 2.77
PVe3 10 3.70 3.64 3.77
P(Fabian) 16 3.40 2.97 3.90
mRMSD 3.57 3.48 3.77
mRMSD + sdMRSD 4.18 4.16 4.37
Campos
P(1-5) 5 1.39 2.41 1.23
P(6-10) 5 2.04 2.10 2.70
P(11) 1 0.73 1.49 1.98
P(12-13) 2 1.50 1.27 1.65
mRMSD 1.42 1.82 1.89
mRMSD + sdRMSD 1.95 2.35 2.51
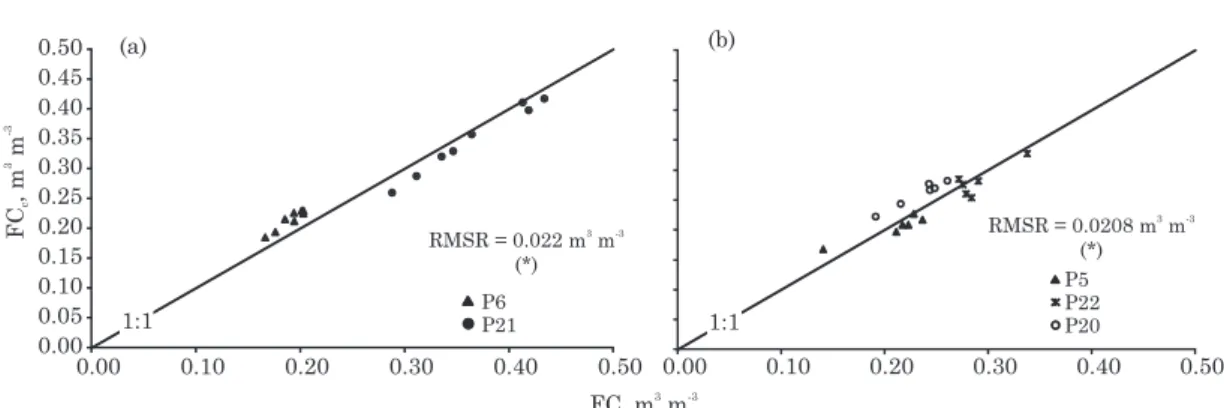
Subset 1 Subset 2 Subset 3
Sand (s) Loamy Sandy Loam (l) Sandy clay Clay Sandy Clay (c) sand (ls) loam (sl) loam (scl) loam (cl) clay (sc)
RMSR (10-2 m3 m-3) 10.0 7.2 5.4 9.1 4.8 7.5 3.3 8.0
Data set A(1)
(10-2 m3 m-3) (n = 312) (n=0) 18.9±6.0 23.7±5.4 25.0±5.1 29.0±3.6 30.9±4.5 (n=0) 34.8±2.9
(n=7) (n=31) (n=51) (n=24) (n=41) (n=3)
Data set B
(10-2 m3 m-3) (n = 165) 10.6±2.5 15.4±3.9 20.3±3.7 32.5±6.4 26.1±4.5 33.5±3.6 28.5±3.5 30.4±8.2
(n=8) (n=10) (n=38) (n=4) (n=56) (n=8) (n=15) (n=26)
Table 6 Root mean squared residues (RMSRs) of the field capacity (FC) estimation for data set B of this paper, based upon the Ritchie equation (Equation 4). The last two lines indicate the mean values and standard deviations for field-determined FC for the various textural classes where FC was available in data set B
(1) Statistics are from Ratliff et al. (1983).
4 was used to evaluate our FC data. If we disregard
one odd measured FC value of 0.42 m3 m-3 in the
loam-textural class (n=4), the Ritchie equation worked reasonably well for subset B2, but poorly for subsets B1 and B3, with the exception of the sc-class. The performance of equation 4 for medium-textured soils, as well as of its equivalent linear model (M2), can be seen in figure 6. As expected, equation 4 (RMSR =
0.0527 m3 m-3, n=98) performed worse than M2 (RMSR
= 0.0467 m3 m-3) in B2, but the corresponding
individual values calculated by both equations were
generally compatible with each other, although FCR
was larger than FCM2 in most cases. Additionally,
there was a trend in overestimation of FC by equation 4 in B2, as indicated by the Wilcoxon test (Figure 6). Figure 6 also shows that most FCs measured in medium-textured soil data of B were in the range of
0.15 to 0.33 m3 m-3 and were in close agreement with
the expected ranges of variation of FCs in A (Table 6) for the three corresponding textural classes (sl, l, scl). Overall, considering the distinct soil and experimental conditions of data sets A and B, the result shown in figure 6 and table 6 is promising in terms of consistency of the values of the measured FC and the FC calculated by equation 4 (calibrated for data set A) and M2 (calibrated for data set B). This suggests that our FC data measured in medium-textured samples (n=98) may fit the corresponding data set of Ritchie et al. (1999), i.e., A and B may contain the same intrinsic soil variable (FC) in this textural range in spite of the differences in soils and field determination methods.
It is apparent that equation 4 overestimates FC for data set B (Figure 7, Table 6) for coarse-textured samples. The values calculated through equation 4
were always greater than 0.19 m3 m-3 and clearly
overestimated FC, as also noted by Gerakis & Zaladis (1998). This is at least partly due to the fact that only seven coarse-textured samples were used in the
adjustment of equation 4. Figure 7 also compares FCR
with the measured FC for fine-textured samples (B3).
Figure 7. Relationship between measured field capacity (FC) for coarse and fine-textured soils (n=67) of the extended data set (n=165) and FC estimated by equation 4 (FCR).
Figure 6. Relationship between measured field capacity (FC) for medium-textured soils (n=98) of the extended data set (n=165) and FC estimated by equation 4 (FCR) and model M2
(FCM2). * and **: mean that the variable at the
It is also clear that the Ritchie equation is unable to describe the large range of the measured FC values for data set B of fine-textured soils. When the measured
FC is over 0.33 m3 m-3 (most c and cl samples), the
air content at field capacity (porosity minus FC) is
less than 0.10 m3 m-3 for most samples, suggesting
slow profile internal drainage. For such samples, the FC values based on 48 h of drainage are expected to be greater than the FC measured according to Ritchie et al. (1999). This partially explains why the highest measured FC values of subset B3 are underestimated by equation 4. PTFs based primarily on texture may not effectively predict water retention and drainage for fine-textured profiles, due to aggregation and other soil structure forming processes, as evidenced by clayey profiles P32 and P6 (Table 1). Most of their
measured FCs were low, around 0.20 m3 m-3, a value
typically found for medium-textured profiles. For these soils, equation 4 clearly overestimates FC (Figure 7). The fact that the drainage of clayey profiles is similar to that of coarser soils is a common feature of some tropical soils, which highlights the inadequacy of equation 4 in these cases, as recognized by Ritchie et al. (1999). Such hybrid and often-observed behavior of clayed materials of tropical soils was explained by Tomasella et al. (2002). However, the FCs of P32 and P6 are better estimated using a PTF based only on
θ(6), as indicated in figure 5c. Overall, the Ritchie
equation was not efficient in subset B3 for various reasons. Without applying a filtering criterion to data set A (related to sample depths, wetting information, drainage times, etc), it may not be advantageous to aggregate FC data from both databases (A and B) in the fine-textured range.
CONCLUSIONS
Field Capacity (FC) has been defined here as the vertical distribution of water content in the soil profile as a result of sequential ponded infiltration and drainage without evapotranspiration or rain, at 48 h after the end of infiltration. It requires measuring the FC distribution only in the upper part of the profile, above the infiltration wetting front. FC(z) for a given soil is assumed to be dependent on the amount of irrigation (W) and antecedent moisture profile [θi(z)]. Therefore, FC(z) can be determined by hydraulic
or numerical experiments that reproduce the above processes. Hysteresis effects are minimal in the above context. For this conceptual framework to have practical significance and for FC to be determined as an intrinsic soil property, it is necessary that the
dependence of FC on W and θi(z) be insignificant. For
measurement standardization and to minimize the
dependence of FC on θi(z), FC should be measured in
the dry season whenever possible, as proposed by Cassel & Nielsen (1986). The depth W should be one that saturates the profile length whose FC(z) needs to be
determined. The above conditions with respect to W,
θi, and field procedures have been considered in the
FC measurements of 22 Brazilian soils with a wide range of texture, resulting in FC independence from
W and θi, confirming reports of three drainage studies
in the literature. The land slope effects on FC were also shown not to be significant in this study. Therefore, FC(z) depended only on basic soil properties at depth z for all soils. Strict FC dependence on z due to morphological or phreatic level effects in the soil profile was also shown to be minor. It is therefore concluded that, following the proposed standardization, FC can be considered an intrinsic soil variable for the soil profiles under study, in other words, a variable that can be determined from basic soil properties, as confirmed by its accurate prediction from PTFs. Further studies should delineate possible limitations of this empirical finding and identify soil profiles in which the FC(z) distributions may not be largely determined by the basic soil properties at depth z as a result of soil structure and/or morphology, phreatic level, or even topographical features, such as land slopes and/or shapes. This study has demonstrated the applicability of PTFs in the prediction of FC. The soil data input for these PTFs was that typically used in soil moisture prediction, but the volumetric water content at 6 kPa suction was demonstrated to be a better predictor than the textural fractions, OM, and BD. This is consistent with the traditional prediction of FC as the water content value at a chosen suction. Indeed, a simple linear function of water content at 6 kPa (model M5) predicted FC with root mean
squared residues less than 0.04 m3 m-3 in most of
the individual soils studied. This PTF had better predictive ability than the method that considered water content at a selected suction.
We recommend a standardized procedure to
determine in situ FC as a reproducible soil parameter
to infer water availability and air capacity in soil profiles for plant and soil management. The field procedures and the FC definition used by Ritchie et al. (1999) are distinct from ours, but the FC data sets seem to be comparable, although only for medium-textured samples. Field procedures must be standardized for the consistent reproduction of FC, otherwise alternative laboratory, statistical, or numerical methods for determining FC will remain ambiguous.
ACKNOWLEDGMENTS
LITERATURE CITED
ANDRADE, R.S. & STONE, L.F. Estimativa da umidade na capacidade de campo em solos sob Cerrado. R. Bras. Eng. Agric. Amb., 15:111-116, 2011.
ARYA, L.M. & PARIS, J.F. A physicoempirical model to predit the soil moisture characteristic from particle-size distribution and bulk density data. Soil Sci. Soc. Am. J., 45:1023-1030, 1981.
BELL, M.A. & van KEULEN, H. Effect of soil disturbance on pedotransfer function development for field capacity. Soil Technol., 8:321-329, 1996.
BHERING, S.B.; PEREIRA, N.R.; MACEDO, J.R.; CHAGAS, C.S.; SILVA, E.F.; PRADO, R.B. & S. NETO, N.C. Caracterização edafoambiental daa microbacias de Cambiocó e Santa Maria no município de São José de Ubá, noroeste do estado do Rio de Janeiro, para fim de planejamento conservacionista. In: BRAZILIAN CONGRESS OF SOIL SCIENCE, 30., Recife, 2005. Anais… Recife, SBCS, 2005. CD-ROM
BODHINAYAKE, W.; SI, B.C. & NOBORIO, K. Determination of hydraulic properties in sloping landscapes from tension and double-ring infiltrometers. Vadose Zone J., 3:964-970, 2004.
BOUWER, H. Intake rate. Cylinder infiltrometer. In: KLUTE, A., ed. Methods of soil analysis: Physical and mineralogical methods. 2.ed. Madison, American Society of Agronomy/ Soil Science Society of America, 1986. Part 1. p. 825-843. BRADLEY, J.V. Distribution-free statistical tests. New Jersey,
Prentice Hall, 1968. 388p.
CASSEL, D.K.; RATLIFF, L.F. & RITCHIE, J.T. Models for estimating in situ potential extractable water using soil physical and chemical properties. Soil Sci. Soc. Am. J., 47:764-769, 1983.
CASSEL, D.K. & NIELSEN, D.R. Field capacity and available water capacity. In: KLUTE, A., ed. Methods of soil analysis: Physical and mineralogical methods. 2.ed. Madison, American Society of Agronomy and Soil Science Society of America, 1986. Part 1, p.901-926.
EMPRESA BRASILEIRA DE PESQUISA AGROPECUÁRIA -EMBRAPA. Centro Nacional de Pesquisa de Solos. Manual de métodos de análise de solo. Rio de Janeiro, 1979. 235p.
EMPRESA BRASILEIRA DE PESQUISA AGROPECUÁRIA -EMBRAPA. Centro Nacional de Pesquisa de Solos. Manual de métodos de análise de solo. 2.ed. Rio de Janeiro, 1997. 212p.
FABIAN, A.J. & OTTONI FILHO, T.B. Determinação de capacidade de campo “in situ” ou através de equações de regressão. Pesq. Agropec. Bras., 35:1029-1036, 2000. GARDNER, W.R.; HILLEL, D. & BENYAMINI, Y.
Post-irrigation movement of soil water. 1- Redistribuition. Water Resour. Res., 6:851-861, 1970.
GERAKIS, A. & ZALADIS, G. Estimating field-measured, plant extractable water from soil properties: Beyond statistical models. Irrig. Drain. Syst., 12:311-322, 1998.
HILLEL, D. Environmental soil physics. London, Academic Press, 1998. 771p.
HILLEL, D. & TALPAZ, H. Simulation of soil water dynamics in layered soils. Soil Sci., 123:54-62, 1977.
HILLEL, D. & van BAVEL, C.H.M. Simulation of profile water storage as related to soil hydraulic properties. Soil Sci. Soc. Am. J., 40:807-815, 1976.
MACEDO, J.R.; MENEGUELLI, N.A.; OTTONI FILHO, T.B. & LIMA, J.A.S. Estimation of field capacity and moisture retention based on regression analysis involving chemical and physical properties in Alfisols and Ultisols of the state of Rio de Janeiro. Soil Sci. Plant Anal., 33:2037-2055, 2002.
MENDOZA, G. & STEENHUIS, T.S. Determination of hydraulic behavior of hillsides with a hillslope infiltrometer. Soil Sci. Soc. Am. J., 66:1501-1504, 2002. MEYER, P.D. & GEE, G. Flux-based estimation of field capacity.
ASCE J. Geotech. Geoenviron. Eng., 125:595-599, 1999. NACHABE, M.H. Refining the interpretation of field capacity in the literature. ASCE J. Irrig. Drain. Eng., 124:230-232, 1998.
NACHABE, M.H.; AHUJA, L.P. & ROKICKI, R. Field capacity of water in soils: Concepts, measurement, and approximation. In: STEWARD, B.A. & HOWEL, T.A., eds. Encyclopedia of water science. London, Taylor & Francis, 2003. p.915-918.
NELSON, D.W. & SOMMERS, L.E. Total carbon, organic carbon, and organic matter. In: PAGE, A.L.; MILLER, R.H. & KEENEY, D.R., eds. Methods of soil analysis. 2.ed. Madison, American Society of Agronomy/Soil Science Society of America, 1982. Part 2. p.539-579.
NEMES, A.; PACHEPSKY, Y.A. & TIMLIN, D.J. Towards improving global estimates of field soil water capacity. Soil Sci. Soc. Am. J., 75:807-812, 2011.
NEMES, A.; SCHAAP, M.G. & WÖSTEN, J.H.M. Functional evaluation of pedotransfer functions derived from different scales of data collection. Soil Sci. Soc. Am. J., 67:1093-1102, 2003.
OCHS, W.J.; WILLARDSON, L.S.; CAMP JR., C.R.; DONNAN, W.W.; WINGER JR., R.J. & JOHNSTON, W.R. Drainage requirements and systems. In: JENSEN, M.E., ed. Design and operation of farm irrigation systems. St. Joseph, American Society of Agricultural Engineering, 1980. p.235-277.
OTTONI FILHO, T.B.; OTTONI, M.V.; OLIVEIRA, M.B. & MACEDO, J.R. Estimation of field capacity from ring infiltrometer-drainage data. R. Brs. Ci. Solo, 38:1765-1771, 2014.
PACHEPSKY, Y.A. & RAWLS, W.J., eds. Development of pedotransfer functions in soil hydrology. Amsterdam, Elsevier/Development in Soil Science, 2005. v.30. 512p. PAIGE, G.B. & HILLEL, D. Comparison of three methods for
PARKIN, G.W.; WARRICK, A.W.; ELRICK, D.E. & KACHANOSKI, R.G. Analytical solution for one-dimensional drainage: Water stored in a fixed depth. Water Resour. Res., 31:1267-1271, 1995.
RATLIFF, L.F.; RITCHIE, J.T. & CASSEL, D.K. Field-measured limits to soil water availability as related to laboratory- measured properties. Soil Sci. Soc. Am. J., 47:770-775, 1983.
REICHARDT, K. Unit gradient in internal drainage experiments for the determination of soil hydraulic conductivity. Sci. Agric., 50:151-153, 1993.
RITCHIE, J.T.; GERAKIS, A. & SULEIMAN, A. A simple method to estimate field-measured soil water limits. Trans. ASAE, 42:1609-1614, 1999.
ROMANO, N. & SANTINI, A. Field water capacity. In: DANE, J.H. & TOPP, C.G., eds. Methods of soil analysis: Physical methods. Madison, Soil Science Society of America, 2002. Part 4. p.723-729. (SSSA Book Series, 5)
SALTER, P.J. & WILLIAMS, J.B. The influence of texture on the moisture characteristics of soils. I. A critical comparison of techniques for determining the available-water capacity and moisture characteristic curve of a soil. J. Soil Sci., 16:1-15, 1965a.
SALTER, P.J. & WILLIAMS, J.B. The influence of texture on the moisture characteristics of soils. II. Available-water capacity and moisture release characteristics. J. Soil Sci., 16:310-317, 1965b.
SAXTON, K.E. & RAWLS, W.J. Soil water characteristic estimates by texture and organic matter for hydrologic solutions. Soil Sci. Soc. Am. J., 70:1569-1578, 2006.
SCHAAP, M.G.; NEMES, A. & van GENUCHTEN, M.TH. Comparison of models for indirect estimation of water retention and available water in surface soils. Vadose Zone J., 3:1455-1463, 2004.
SOIL SCIENCE SOCIETY OF AMERICA - SSSA. Glossary of soil science terms. Madison, 1984. 38p.
THURLER, A.M. Determinação da capacidade de campo e retenção de umidade em solos do Terciário da Formação Barreira em função de suas características granulométricas e fatores estruturais. Seropédica, Universidade Federal Rural do Rio de Janeiro, 2000. 128p. (Tese de Doutorado)
TOMASELLA, J.; HODNETT, M.G. & ROSSATO, L. Pedotransfer functions for the estimation of soil retention in Brazilian soils. Soil Sci. Soc. Am. J., 64:327-338, 2000. TWARAKAVI, N.K.C.; SAKAI, M. & SIMUNEK, J. An objective analysis of the dynamic nature of field capacity. Water Resour. Res., 45:W10410. doi: 10.1029/2009 WR007944, 2009. VEIHMEYER, F.J. & HENDRICKSON, A.H. Methods of determining field capacity and wilting percentages of soils. Soil Sci., 68:75-94, 1949.
WARRICK, A.W.; LOMEN, D.O. & ISLAS, A. An analytical solution to Richards’ equation for a draining soil profile. Water Resour. Res., 26:253-258, 1990.
WILLIAMS, R.D.; AHUJA, L.R. & NANEY, J.W. Comparison of methods to estimate soil water characteristics from soil texture, bulk density, and limited data. Soil Sci., 153:172-184, 1992.
![Table 5. Local evaluation of three selected PTFs for field capacity (models M5 and M6, and Equation 3), based on the RMSR values in each soil and their statistics [mRMSR (mean) and sdRMSR (standard deviation)] for the S](https://thumb-eu.123doks.com/thumbv2/123dok_br/15892190.669457/11.892.85.434.208.865/table-evaluation-selected-capacity-equation-statistics-standard-deviation.webp)