Received 4/30/2013 Accepted 9/11/2013 (006081)
1 Department of Chemistry, State University of Maringá – UEM, Av. Colombo, 5790, CEP 87020-900, Maringá, PR, Brazil, e-mail: mmakoto@uem.br 2 Food Technology Department, Federal University of Technology – Paraná State – UTFPR, Londrina, PR, Brazil
*Corresponding author
Evaluation of antioxidant potential of Brazilian rice cultivars
Sylvio Vicentin PALOMBINI1, Swami Arêa MARUYAMA1, Thiago CLAUS1, Fabiana CARBONERA1,
Nilson Evelázio de SOUZA2, Jesuí Vergílio VISENTAINER1, Sandra Teresinha Marques GOMES1,
Makoto MATSUSHITA1*
1 Introduction
Rice (Oryza sativa L.) is a staple food in many countries, especially in developing countries. It is an important crop in Africa, Latin America, and the Middle East, representing the second largest crop produced worldwide (FOOD..., 2013; SELLAPAN et al., 2009). It is an important source of vitamins, minerals, fibers, and other bioactive compounds (MONKS et al., 2013). Brazil is among the ten greatest producers of this grain, with an annual production of more than 13 million tons (FOOD..., 2013).
Many studies in the literature report the antioxidant activity of different rice genotypes (QIU; LIU; BETA, 2010; SOMPONG et al., 2011; ZIGONEANU et al., 2008). In general, an antioxidant compound is any substance that when present at low concentrations compared to that of an oxidizable substrate, effectively delays or inhibits its oxidation (SIES; STAHL, 1995). Nowadays, there is great concern about the damage caused by oxidative stress, which can harm DNA inducing carcinogenic effects (KLAUNIG et al., 2011). As a result, the importance of studying the antioxidant capacity of foods has increased.
Currently, there are many analytical methods to determine the antioxidant capacity in different food matrices (BENZIE; STRAIN, 1996; BRAND-WILLIAMS; CUVELIER; BERSET, 1995; CAO; ALESSIO; CUTLER, 1993; RE et al., 1999). These assays make use of analyte extraction steps with solvents for later analysis. They often substantially increase total procedure time and require toxic solvents, which do not extract all of the compounds that can be detected by total antioxidant activity (TAA) determination techniques. Therefore, it leads to an underestimation of the final results (GÖKMEN; SERPEN; FOGLIANO, 2009) since molecules with antioxidant capacity can also act in synergy with themselves (LEVINE et al., 1996).
However, there is a procedure, called Quencher, which overcomes this problem. It is directly applied to the food matrix, avoiding solvent extraction and sample hydrolysis steps. The radical compounds that are used in the assays, combined by this direct procedure, come into contact with both the soluble and insoluble parts of foods, hence increasing the accuracy of the TAA measurement. Moreover, the results generated by this procedure are more realistic since they take into consideration the effects that occur between the antioxidant compounds in a food matrix (synergism, for example), while in multiple extraction procedures, the total antioxidant capacity is only represented by the sum of the antioxidant capacities of the soluble and insoluble fractions measured at different times (GÖKMEN; SERPEN; FOGLIANO, 2009).
The Quencher procedure has been previously employed in different food matrices, such as cereals, beef and walnuts (AÇAR; GÖKMEN; PELLEGRINI, 2009; SERPEN; GÖKMEN; FOGLIANO, 2012a; SERPEN et al., 2008). However, no author has ever used this procedure in Brazilian rice cultivars. Thus, this study aimed to determine the TAA of different Brazilian rice cultivars using DPPH and ABTS radical capture assays and the ferric reduction antioxidant power (FRAP) method, all combined with the Quencher procedure. Furthermore, the proximate composition and the total amount of phenolic compounds present in the studied cultivars were also determined, and their fatty acids were quantified.
2 Experimental
2.1 Grain sampling
All the rice cultivars (BRS Primavera, BRS Querência, BRS Sertaneja, BRS Tropical, BRS Taim, BRS Jaçanã, and BRS Pampa) Abstract
This study quantified the fatty acids and evaluated the proximate composition, antioxidant activity (using the Quencher procedure), and total phenolic compound concentrations in Brazilian rice cultivars. The cultivars studied showed high amounts of unsaturated fatty acids, such as linoleic and oleic acid. The ratios of polyunsaturated and saturated fatty acids obtained were high. Regarding the antioxidant activity, the best results were found using the ABTS method and the worst in the DPPH assay. The results of the DPPH and FRAP assays showed the highest correlation. The antioxidant capacity results obtained were also much higher than those reported for other varieties worldwide. Therefore, the Quencher procedure is highly suitable for application in cereals such as rice, especially when combined with the ABTS radical capture method.
temperature for 12-16 hours before use. The working solution of ABTS•+ was prepared by diluting 10 mL of stock solution
with 800 mL of a water/ethanol (50:50, v/v) mixture to obtain an absorbance of 0.75-0.80 at 734 nm (SERPEN; GÖKMEN; FOGLIANO, 2012a).
The FRAP solution was prepared as described by Benzie and Strain (1996), diluting an aqueous solution of 10 mmol L–1 TPTZ (2,4,6-tripyridyl-s-triazine) and 20 mmol L–1 ferric
chloride in 300 mmol L–1 sodium acetate buffer (pH 3.6) at the
ratio of 1:1:10 (v/v/v).
Ten milligrams of each previous ground sample was weighed in a centrifuge tube. For the DPPH, ABTS•+, and
FRAP assays, 10 mL of the respective working solutions were added to start the reactions. All tubes were shaken for 1 hour and centrifuged at 9200 g for 5 minutes. The absorbance of the supernatants was measured at 734 nm (for ABTS assay), 525 nm (for DPPH assay) and 593 nm (for FRAP assay) (SERPEN; GÖKMEN; FOGLIANO, 2012a).
Trolox (6-hydroxy-2,5,7,8-tetramethychroman-2-carboxylic acid) was used as a standard reference to convert the inhibition capability of each sample into the trolox equivalent antioxidant capacity (TEAC), as described by Serpen, Gökmen and Fogliano (2012a).
The extraction of the antioxidant compounds needed for the total phenolic assay was carried out using 10 g of each ground grain and 100 mL of a mixture of ethanol and water (50:50, v/v), stirring for 4 hours with a magnetic bar (SANTOS et al., 2011). The total phenolic content was determined according to the method of Shahidi and Naczk (1995). A 0.25 mL aliquot of the extract solution was mixed with 0.25 mL of Folin-Ciocalteu’s reagent previously diluted with water (1:1, v/v), 0.5 mL of a saturated sodium carbonate solution, and 4 mL of water. The mixture was allowed to rest at room temperature for 25 minutes and was then centrifuged at 3800 g for 10 minutes. The supernatant absorbance was measured at 725 nm using a spectrophotometer (Cary Win UV 50, Varian). Gallic acid (GA) was used as the standard, and the results were expressed as gallic acid equivalents (mg GAE 100g–1).
2.5 Statistical analysis
The results were submitted to analysis of variance (ANOVA), and the means were compared by the Tukey’s test using the Statistica program, version 7.0. The significance level used for rejection of the null hypothesis was 5% (p<0.05). The correlation coefficients (R) used to determine the relationship between the antioxidant activity measured and total phenolic content were calculated using Microsoft Office Excel software, version 2010.
3 Results and discussion
Table 1 shows the results of the proximate composition analyses for the rice cultivars. Total lipid contents ranged between 1.77-3.12 %, higher than the value found by Oduguwa, Edema and Ayeni (2008) (1.42 %) and 11 times greater than that obtained by Padovani et al. (2007) (0.27 %), both for white rice. were harvested from the experimental area of the Capivara farm
(Latitude: 16° 28’ 00’’ Longitude: 49° 17’ 00’’ Altitude: 823.00 meters) of the EMBRAPA Arroz e Feijão unit in 2012 and stored until analysis. All samples were ground separately.
2.2 Chemical analysis
All analyses were performed in three replicates. Total lipids (TL) of the rice samples were determined according to the method of Bligh and Dyer (1959). Moisture content was determined using the AOAC Official Method 930.15, ash content using the AOAC Official Method 942.05, and crude protein (CP) following the AOAC Official Method 960.52 (ASSOCIATION..., 1990), using a factor of 6.25 to convert the percentage of nitrogen into protein percentage. The Nifext fraction was estimated by difference.
2.3 Fatty acid composition
Fatty acid methyl esters (FAME) were prepared by total lipid methylation following the method of Hartman and Lago (1973). The methyl esters were separated by gas chromatography in a Varian 3380 (USA) gas chromatography fitted with a flame ionization detector (FID) and a fused-silica capillary column (100 m × 0.25 mm id., 0.25 µm cyanopropyl CP-7420 select FAME). The injector and detector temperatures were 200 and 240 °C, respectively. The column temperature was maintained at 185 °C for 8 minutes, followed by a heating rate of 4 °C min–1
up to 235 °C, which was maintained for 0.5 minute. The ultra-pure gas flows were 1.2mL min–1 for the carrier gas (hydrogen),
30 mL min–1 for the make-up gas (nitrogen), 350 mL min–1 for
the synthetic air, and 35 mL min–1 for the hydrogen flame gas,
with a split injection ratio of 1/80.
For the identification of fatty acids, the retention times were compared to those of standard methyl esters (Sigma, USA). Quantification of fatty acids was performed using tricosanoic acid methyl ester (Sigma, USA) as an internal standard, according to Joseph and Ackman (1992). Peak areas were determined using the software Star 5.0 (Varian, USA).
2.4 Antioxidant capacity analysis
For the antioxidant capacity analysis, all previously ground samples were passed through an 80 mesh (0.177 mm) sieve to avoid any influence of different particle sizes on the Quencher procedures (GÖKMEN; SERPEN; FOGLIANO, 2009).
The work solutions used in this study were prepared according to Serpen, Gökmen and Fogliano (2012a). The stock solution of 2,2-diphenyl-1-picrylhydrazyl (DPPH) used was obtained by dissolving 40 mg of DPPH in 200 mL of ethanol/ water mixture (50:50, v/v). The absorbance value of 0.75-0.80 was set by diluting the stock solution in approximately 800 mL of a water/ethanol (50:50, v/v) mixture.
For the ABTS assay, the stock solution of ABTS•+
(2,2’-azinobis-(3-ethylbenzothiazoline-6-sulfonic acid)) was prepared according to Re et al. (1999), by reacting the ABTS stock solution (7 mol L–1) with potassium persulfate (2.45 mol
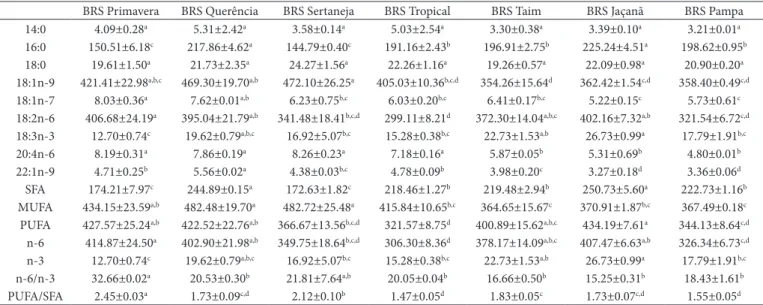
18:1n-9 and SFA, respectively) and Kitta et al. (2005) (36.9% and 24.3% for 18:1n-9 and AGS, respectively) in different rice cultivars. The intake of 18:1n-9 instead of saturated fatty acids helps reduce the low density lipoprotein levels in the blood and therefore reduces the risk of cardiovascular disease (ELMADFA; KORNSTEINER, 2009). As for the α-linolenic acid levels, The Brazilian cultivars showed an amount ranging from 1.24-2.57%, higher than the values found by Kitta et al. (2005) (1.2 %, mean). According to Perini et al. (2010), α-linolenic acid is an essential fatty acid that is not synthetized by humans and must be provided by an adequate diet.
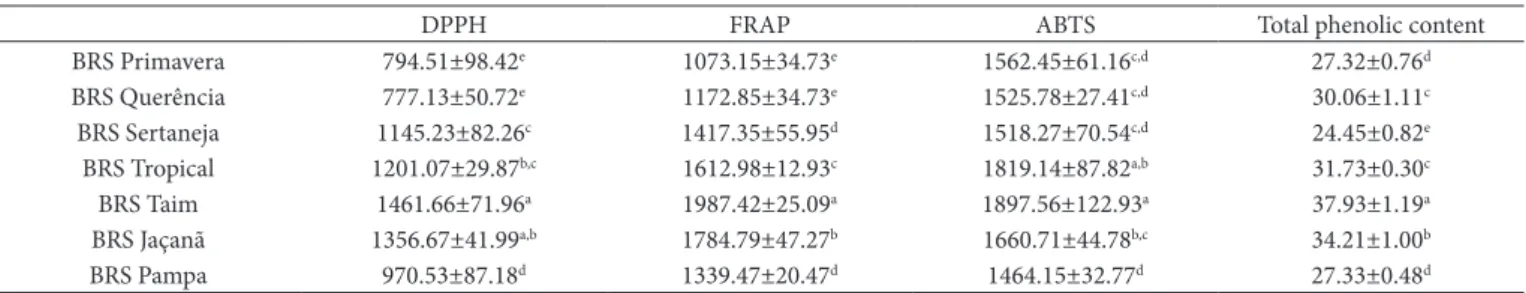
Regarding the antioxidant activity and the total content of phenolic compounds (Table 3), all cultivars, except for BRS Taim and BRS Jaçanã, showed the highest in the ABTS assay, followed by FRAP and DPPH. BRS Taim showed the best results and the highest concentrations of total phenolic compounds (TPC) in all assays.
In the DPPH assay, the values ranged from 794.51 to 1461.66 µmol TEAC g–1. This range was much higher than
that determined by Qiu, Liu and Beta (2010) (159 to 540 µmol TEAC 100g–1) for different rice types. As for the ABTS assay,
the cultivars showed an average value (164 mmol 100g–1) higher
than those reported for other species, such as black and red rice As for the crude protein contents, the values that were obtained
for Brazilian rice cultivars were similar to that (approximately) reported by Sompong et al. (2011) (9 %) for red and black species of rice and slightly higher than the range found by Juliano (2004) (7.1-8.3 %) for different rice types. The average value of ash content of the studied samples (1.15 %) was within the 1.0-1.5 % range, determined by this same author (JULIANO, 2004). These results show that the cultivars that have been adapted for farming and consumption in Brazil are good lipid and crude protein sources compared to other rice varieties (black and red, for example).
In terms of lipid profile (Table 2), BRS Primavera and BRS Jaçanã cultivars stand out from the others. BRS Primavera had the lowest value of total saturated fatty acids (SFA) and the highest value of total polyunsaturated fatty acids (PUFA), leading to the highest PUFA/SFA ratio among the cultivars. The values of this ratio were above the minimum required (0.45) for a foodstuff to be considered healthy for all samples (LONDON, 1994). The cultivar BRS Jaçanã showed the highest concentration of α-linolenic acid and the lowest n-6/n-3 ratio.
All cultivars showed high amounts of oleic acid (39.86%) and lower values of total SFA (20.71%) when compared to the values obtained by Monks et al. (2013) (38.5% and 24.4% for
Table 1. Proximal composition of rice cultivars (%).
Moisture Ash Crude protein Total lipids Nifext
BRS Primavera 11.88±0.03c,d 1.03±0.07c 11.65±0.49a 3.12±0.13a 72.25±0.50d
BRS Querência 11.75±0.02d 1.18±0.04a,b 7.71±0.18d 2.08±0.10c 77.39±0.36a
BRS Sertaneja 11.46±0.05e 1.12±0.02b,c 11.88±0.65a 2.05±0.15c 71.97±2.35d
BRS Tropical 11.96±0.09b,c 1.23±0.06a,b 9.46±0.48b,c 2.63±0.10b 74.65±0.78b,c
BRS Taim 11.23±0.05f 1.28±0.04a 11.81±0.36a 1.95±0.01c,d 73.52±0.18c,d
BRS Jaçanã 12.08±0.04a,b 1.15±0.02b 10.51±0.21b 1.77±0.07d 74.49±0.15b,c
BRS Pampa 12.18±0.09a 1.18±0.07a,b 8.69±0.02c,d 1.91±0.13c,d 76.05±0.28a,b
Results expressed as mean±standard deviation from the analysis of three replicates. Means followed by different superscript letters (a) in the same column are significantly different
according to Tukey’s test (p<0.05).
Table 2. Fatty acid quantification (mg g–1 of total lipid) and n-6/n-3 and PUFA/SFA ratio of the rice cultivars.
BRS Primavera BRS Querência BRS Sertaneja BRS Tropical BRS Taim BRS Jaçanã BRS Pampa 14:0 4.09±0.28a 5.31±2.42a 3.58±0.14a 5.03±2.54a 3.30±0.38a 3.39±0.10a 3.21±0.01a
16:0 150.51±6.18c 217.86±4.62a 144.79±0.40c 191.16±2.43b 196.91±2.75b 225.24±4.51a 198.62±0.95b
18:0 19.61±1.50a 21.73±2.35a 24.27±1.56a 22.26±1.16a 19.26±0.57a 22.09±0.98a 20.90±0.20a
18:1n-9 421.41±22.98a,b,c 469.30±19.70a,b 472.10±26.25a 405.03±10.36b,c,d 354.26±15.64d 362.42±1.54c,d 358.40±0.49c,d
18:1n-7 8.03±0.36a 7.62±0.01a,b 6.23±0.75b,c 6.03±0.20b,c 6.41±0.17b,c 5.22±0.15c 5.73±0.61c
18:2n-6 406.68±24.19a 395.04±21.79a,b 341.48±18.41b,c,d 299.11±8.21d 372.30±14.04a,b,c 402.16±7.32a,b 321.54±6.72c,d
18:3n-3 12.70±0.74c 19.62±0.79a,b,c 16.92±5.07b,c 15.28±0.38b,c 22.73±1.53a,b 26.73±0.99a 17.79±1.91b,c
20:4n-6 8.19±0.31a 7.86±0.19a 8.26±0.23a 7.18±0.16a 5.87±0.05b 5.31±0.69b 4.80±0.01b
22:1n-9 4.71±0.25b 5.56±0.02a 4.38±0.03b,c 4.78±0.09b 3.98±0.20c 3.27±0.18d 3.36±0.06d
SFA 174.21±7.97c 244.89±0.15a 172.63±1.82c 218.46±1.27b 219.48±2.94b 250.73±5.60a 222.73±1.16b
MUFA 434.15±23.59a,b 482.48±19.70a 482.72±25.48a 415.84±10.65b,c 364.65±15.67c 370.91±1.87b,c 367.49±0.18c
PUFA 427.57±25.24a,b 422.52±22.76a,b 366.67±13.56b,c,d 321.57±8.75d 400.89±15.62a,b,c 434.19±7.61a 344.13±8.64c,d
n-6 414.87±24.50a 402.90±21.98a,b 349.75±18.64b,c,d 306.30±8.36d 378.17±14.09a,b,c 407.47±6.63a,b 326.34±6.73c,d
n-3 12.70±0.74c 19.62±0.79a,b,c 16.92±5.07b,c 15.28±0.38b,c 22.73±1.53a,b 26.73±0.99a 17.79±1.91b,c
n-6/n-3 32.66±0.02a 20.53±0.30b 21.81±7.64a,b 20.05±0.04b 16.66±0.50b 15.25±0.31b 18.43±1.61b
PUFA/SFA 2.45±0.03a 1.73±0.09c,d 2.12±0.10b 1.47±0.05d 1.83±0.05c 1.73±0.07c,d 1.55±0.05d
Results expressed as mean±standard deviation from the analysis of three replicates. Means followed by different superscript letters (a) in the same row are significantly different according
the FeIII-TPTZ
2 complex (in FRAP) and the ABTS•+ radical
(MÜLLER; FRÖHLICH; BÖHM, 2011).
A greater correlation between the results from the DPPH and ABTS assays was expected due to the fact that both methods share the same reaction mechanism, electron transfer (HUANG; OU; PRIOR, 2005). However, there are some important differences among these methods. The solvent used for solubilization of the DPPH and ABTS radicals in the Quencher procedure was a mixture of ethanol and water (50:50, v/v), based on the yield results reported by Serpen, Gökmen and Fogliano (2012b), who found the best results with the direct procedure using this mixture. The DPPH radical, for example, is more suitable for application in hydrophobic systems since it is better solubilized in solvents with low polarity. On the other (approximately 12 mmol 100g–1) (SOMPONG et al., 2011). The
TPC content of the cultivars varied slightly (24.45 to 37.93 mg GAE 100–1); these values were within the range determined by
Goffman and Bergman (2004) (25 to 246 mg GAE 100g–1) for
white rice and indicate that the cultivars analyzed in this study had good antioxidant activity compared to that of other rice cultivars from around the world.
The correlation values obtained (Table 4) may explain the TAA value in the rice cultivars. A high correlation was observed between the FRAP and DPPH assays, suggesting a possible antioxidant activity relationship of the compounds that react in both methods although they that have different reaction mechanisms. The same did not occur in FRAP × ABTS and DPPH × ABTS correlations even though the FRAP and ABTS assays showed similarities with regard to the redox potential (0.70 V for ferric reduction and 0.68 V for reaction with ABTS). It can be said that there are some differences between the methods studied. Unlike the ABTS procedure, the FRAP assay, for example, is conducted at controlled pH (3.6), changing the conditions of the reaction in the samples. Moreover, there are different steric effects between the oxidant molecules and
Table 3. Results of antioxidant capacity (µmol TEAC g–1) and total phenolic content (mg GAE 100g–1) of the rice cultivars using different assays.
DPPH FRAP ABTS Total phenolic content
BRS Primavera 794.51±98.42e 1073.15±34.73e 1562.45±61.16c,d 27.32±0.76d
BRS Querência 777.13±50.72e 1172.85±34.73e 1525.78±27.41c,d 30.06±1.11c
BRS Sertaneja 1145.23±82.26c 1417.35±55.95d 1518.27±70.54c,d 24.45±0.82e
BRS Tropical 1201.07±29.87b,c 1612.98±12.93c 1819.14±87.82a,b 31.73±0.30c
BRS Taim 1461.66±71.96a 1987.42±25.09a 1897.56±122.93a 37.93±1.19a
BRS Jaçanã 1356.67±41.99a,b 1784.79±47.27b 1660.71±44.78b,c 34.21±1.00b
BRS Pampa 970.53±87.18d 1339.47±20.47d 1464.15±32.77d 27.33±0.48d
Results of the analysis of three replicates expressed as mean±standard deviation. Means followed by different superscript letters in the same column are significantly different according to Tukey’s test (p>0.05).
Table 4. Correlation coefficients (R) between the analyses’ results.
DPPH FRAP ABTS
Total phenolic content 0.462 0.646 0.693
DPPH - 0.957 0.538
FRAP - - 0.634
used for the analyte extraction thus limiting the synergism of the compounds.
4 Conclusions
The rice cultivars analyzed in this study can be considered healthy due to their PUFA/SFA ratios and to the fact that they have higher concentrations of oleic and α-linolenic fatty acids compared to that of other rice samples reported in the literature. Their antioxidant capacities were also much higher than those reported for other varieties worldwide. Thus, the Quencher procedure is highly suitable for application in cereals such as rice, especially when combined with the ABTS radical capture method, which showed the best results.
Acknowledgments
The authors are grateful for the financial support provided by Capes and to the Brazilian Agricultural Research Corporation, Unit Arroz e Feijão, Santo Antônio de Goiás, Goiás, Brazil, for donating the grains.
References
AÇAR, Ö. Ç.; GÖKMEN, V.; PELLEGRINI, N. Direct evaluation of the total antioxidant capacity of raw and roasted pulses, nuts and seeds.
European Food Research and Technology, v. 229, p. 961-969, 2009. http://dx.doi.org/10.1007/s00217-009-1131-z
ASSOCIATION OF OFFICIAL ANALYTICAL CHEMISTS - AOAC.
Official Methods of Analysis. 15th ed. Arlington: AOAC, 1990. BENZIE, I. F. F.; STRAIN, J. J. The Ferric Reducing Ability of Plasma
(FRAP) as a Measure of “Antioxidant Power”: The FRAP Assay.
Analytical Biochemistry, v. 239, p. 70-76, 1996. PMid:8660627. http://dx.doi.org/10.1006/abio.1996.0292
BLIGH, E. G.; DYER, W. J. A rapid method of total lipid extraction and purification. Canadian Journal of Biochemistry and Physiology, v. 37, p. 911-917, 1959. PMid:13671378. http://dx.doi.org/10.1139/ o59-099
BRAND-WILLIAMS, W.; CUVELIER, M. E.; BERSET, C. Use of a free radical method to evaluate antioxidant activity. LWT- Food Science and Technology, v. 28, p. 25-30, 1995.
CAO, C.; ALESSIO, H. M.; CUTLER, R. G. Oxygen-radical absorbance capacity assay for antioxidants. Free Radical Biology & Medicine, v. 14, p. 303-311, 1993. http://dx.doi.org/10.1016/0891-5849(93)90027-R
ELMADFA, I.; KORNSTEINER, M. Fats and fatty acid requirements for adults. Annals of Nutrition and Metabolism, v. 55, p. 56-75, 2009. PMid:19752536. http://dx.doi.org/10.1159/000228996 FOOD AND AGRICULTURE ORGANIZATION OF THE UNITED
NATIONS. FAOSTAT. 2013. Disponível em: <http://faostat.fao. org/site/339/default.aspx>. Acesso em 25 mar. 2013.
GOFFMAN, F. D.; BERGMAN, C. J. Rice kernel phenolic content and its relationship with antiradical efficiency. Journal of the Science of Food and Agriculture, v. 84, p. 1235-1240, 2004. http://dx.doi. org/10.1002/jsfa.1780
GÖKMEN, V.; SERPEN, A.; FOGLIANO, V. Direct measurement of the total antioxidant capacity of foods: the ‘QUENCHER’ approach. Trends LWT- Food Science and Technology, v. 20, p. 278-288, 2009.
hand, the ABTS radical can be used in both hydrophilic and lipophilic systems (SERPEN; GÖKMEN; FOGLIANO, 2012b; KIM et al., 2002). This difference of action between the DPPH and ABTS radicals can also explain the trend identified in the TAA results (Figure 1), in which higher values were obtained for the cultivars in the ABTS assay compared to those of the DPPH assay. Since the radical acts directly in the food matrix during the quenching process, the ABTS radical can react with a greater amount of compounds than the DPPH because it is applicable to both hydrophilic and lipophilic systems, which are present in the reactional media.
The correlation between the TPC and TAA results was not as high as expected, and greater values were observed in the FRAP and ABTS assays. There are some factors that may help explain this situation. The first one is the difference in the steps applied in each method. In the TAA assays, the direct procedure (Quencher) was applied, and it did not use analyte extraction steps or solvents. This procedure is widely recognized because it covers a greater range of compounds by reacting directly in the food matrix and reaching extensive range of compound polarities that are present in the samples (GÖKMEN; SERPEN; FOGLIANO, 2009). The same was not observed in the TPC assay, which included an extraction step with a mixture of ethanol and water (50:50, v/v), thus reducing the range of detectable compounds. This idea is reinforced by Pérez-Jiménez and Saura-Calixto (2005), who claimed that the antioxidant capacity of the non-extractable polyphenol portion in cereals greatly exceeded the TAA of the usual extracts. As already known, the method used in this study only detects the extractable portion of phenolic compounds. Even with this evident procedural difference, the correlation between the TPC and ABTS data was greater than that reported by Shen et al. (2009) (r = 0.231) for white rice. This shows that the correlation value can be affected depending on whether or not the Quencher procedure should be used; however, this issue is not problematic enough to avoid its use in determining TAA.
Another factor that might have influenced the relative low correlation observed between the TPC and TAA results can be, according to Rocha-Guzmán et al. (2007), the presence of carbohydrates in the reactional media. On a study on bean samples, which is as rich in carbohydrates as rice, these authors found a poor correlation between TAA and TPC (r = 0.0694). They explained that the carbohydrates in the media take up an electron but cannot form a stable free radical, and thus the electron that was taken returns to the reactional media soon after. This is a plausible explanation in for the results obtained in the present study since the solvent that was used to solubilize the radicals in the Quencher procedure was a mixture of ethanol and water (50:50, v/v), which also solubilizes carbohydrates.
PERINI, J. A. L. et al. Omega-3 and omega-6 polyunsaturated fatty acids: metabolism in mammals and immune response. Brazilian Journal of Nutrition, v. 23, p. 1075-1086, 2010.
QIU, Y.; LIU, Q.; BETA, T. Antioxidant properties of commercial wild rice and analysis of soluble and insoluble phenolic acids.
Food Chemistryistry, v. 121, p. 140-147, 2010. http://dx.doi. org/10.1016/j.foodchem.2009.12.021
RE, R. et al. Antioxidant activity applying an improved ABTS radical cation decolorization assay. Free Radical Biology & Medicine, v. 26, p. 1231-1237, 1999. http://dx.doi.org/10.1016/S0891-5849(98)00315-3
ROCHA-GUZMÁN, N. E. et al. Antioxidant and antimutagenic activity of phenolic compounds in three different colour groups of common bean cultivars (Phaseolus vulgaris). Food Chemistry, v. 103, p. 521-527, 2007. http://dx.doi.org/10.1016/j.foodchem.2006.08.021 SANTOS, L. P. et al. Phenolic compounds and fatty acids in different
parts of Vitis labrusca and V. vinifera grapes. Food Research International, v. 44, p. 1414-1418, 2011. http://dx.doi.org/10.1016/j. foodres.2011.02.022
SELLAPAN, K. et al. Rice caryopsis structure in relation to distribution of micronutrients (iron, zinc, β-carotene) of rice cultivars including transgenic indica rice. Plant Science, v. 177, p. 557-562, 2009. http:// dx.doi.org/10.1016/j.plantsci.2009.07.004
SERPEN, A. et al. Direct measurement of the total antioxidant capacity of cereal products. Journal of Cereal Science, v. 48, p. 816-820, 2008. http://dx.doi.org/10.1016/j.jcs.2008.06.002
SERPEN, A.; GÖKMEN, V.; FOGLIANO, V. Total antioxidant capacities of raw and cooked meats. Meat Science, v. 90, p. 60-65, 2012a. PMid:21684086. http://dx.doi.org/10.1016/j.meatsci.2011.05.027 SERPEN, A.; GÖKMEN, V.; FOGLIANO, V. Solvent effects on total
antioxidant capacity of foods measured by direct QUENCHER procedure. Journal of Food Composition and Analysis, v. 26, p. 52-57, 2012b. http://dx.doi.org/10.1016/j.jfca.2012.02.005 SHAHIDI, F.; NACZK, M. Methods of analysis and quantification
of phenolic compounds. In: SHAHIDI, F.; NACZK, M. Food phenolics: Sources, chemistry, effects and applications. Lancaster: Technomic Publishing Company, 1995. p. 287-293.
SHEN, Y. et al. Total phenolics, flavonoids, antioxidant capacity in rice grain and their relations to grain color, size and weight. Journal of Cereal Science, v. 49, p. 106-111, 2009. http://dx.doi.org/10.1016/j. jcs.2008.07.010
SIES, H.; STAHL, W. Vitamins E and C, β-carotene, and other carotenoids as antioxidants. American Journal of Clinical Nutrition, v. 62, p. 1315-1321, 1995.
SOMPONG, R. et al. Physicochemical and antioxidative properties of red and black rice varieties from Thailand, China and Sri Lanka.
Food Chemistryistry, v. 124, p. 132-140, 2011. http://dx.doi. org/10.1016/j.foodchem.2010.05.115
TANANUWONG, K.; TEWARUTH, W. Extraction and application of antioxidants from black glutinous rice. LWT- Food Science and Technology, v. 43, p. 476-481, 2010.
ZIGONEANU, I. G. et al. Determination of antioxidant components in rice bran oil extracted by microwave-assisted method. Bioresource Technology, v. 99, p. 4910-4918, 2008. PMid:17996444. http:// dx.doi.org/10.1016/j.biortech.2007.09.067
HARTMAN, L.; LAGO, R. C. A. Rapid preparation of fatty acid methyl esters from lipids. Laboratory Practice, v. 22, p. 475-476, 1973. PMid:4727126.
HUANG, D.; OU, B.; PRIOR, R. L. The Chemistry Behind Antioxidant Capacity Assays. Journal of Agricultural and Food Chemistry, v. 53, p. 1841-1856, 2005. PMid:15769103. http://dx.doi. org/10.1021/jf030723c
JOSEPH, J. D.; ACKMAN, R. G. Cappilary column gas chromatography method for analysis of encapsulated fish and oil ethyl esters: collaborative study. Journal of AOAC International, v. 75, p. 488-506, 1992.
JULIANO, B. O. Rice. In: WRIGLEY, C.; CORKE, H.; WALKER, C. E. (Ed.). Encyclopedia of Grain Science. North Ryde: Academic Press; 2004. p. 41-85. http://dx.doi.org/10.1016/B0-12-765490-9/00209-3 KIM, D. O. et al. Vitamins C Equivalent Antioxidant Capacity (VCEAC) of Phenolic Phytochemicals. Journal of Agricultural and Food Chemistry, v. 50, p. 3713-3717, 2002. PMid:12059148. http://dx.doi. org/10.1021/jf020071c
KITTA, K. et al. Variations in lipid content and fatty acid composition of major non-glutinous rice cultivars in Japan. Journal of Food Composition and Analysis, v. 18, p. 269-278, 2005. http://dx.doi. org/10.1016/j.jfca.2004.10.001
KLAUNIG, J. E. et al. Oxidative stress and oxidative damage in chemical carcinogenesis. Toxicology and Applied Pharmacology, v. 254, p. 86-99, 2011. PMid:21296097. http://dx.doi.org/10.1016/j. taap.2009.11.028
LEVINE, M. et al. Vitamin C pharmacokinetics in healthy volunteers: evidence for a recommended dietary allowance. Proceedings of the National Academy of Sciences of the USA, v. 93, p. 3704-3709, 1996. PMid:8623000 PMCid:PMC39676. http://dx.doi.org/10.1073/ pnas.93.8.3704
LONDON. Department of Health. Nutritional aspects of cardiovascular disease. Report of the cardiovascular review group of the committee on medical aspects of food policy. London: HMSO, 1994. In Report on health and social objects.
MONKS, J. L. F. et al. Effects of milling on proximate composition, folic acid, fatty acids and technological properties of rice. Journal of Food Composition and Analysis, v. 30, n. 2, p. 73-79, 2013. http://dx.doi.org/10.1016/j.jfca.2013.01.009
MÜLLER, L.; FRÖHLICH, K.; BÖHM, V. Comparative antioxidant activities of carotenoids measured by ferric reducing antioxidant power (FRAP), ABTS bleaching assay (αTEAC), DPPH assay and peroxyl radical scavenging assay. Food Chemistryistry, v. 129, p. 139-148, 2011. http://dx.doi.org/10.1016/j.foodchem.2011.04.045 ODUGUWA, O. O.; EDEMA, M. O.; AYENI, A. O. Physico-chemical
and microbiological analyses of fermented corn cob, rice bran and cowpea husk for use in composite rabbit feed. Bioresource Technology, v. 99, p. 1816-1820, 2008. PMid:17502134. http:// dx.doi.org/10.1016/j.biortech.2007.03.036
PADOVANI, R. M. et al. Comparison of proximate, mineral and vitamin composition of common Brazilian and US foods. Journal of Food Composition and Analysis, v. 20, p. 733-738, 2007. http:// dx.doi.org/10.1016/j.jfca.2007.03.006