Article
Printed in Brazil - ©2013 Sociedade Brasileira de Química0103 - 5053 $6.00+0.00A
*e-mail: [email protected].
Antioxidant Activity of Brazilian Bean Cultivars
Sylvio V. Palombini,a Swami A. Maruyama,a Thiago Claus,a Paula F. Montanher,a
Nilson E. de Souza,b Jesuí V. Visentainer,a Sandra Terezinha Marques Gomesa and
Makoto Matsushita*,a
aDepartamento de Química Universidade Estadual de Maringa,
Av. Colombo, 5790, 87020-900 Maringa-PR, Brazil.
bDepartamento de Tecnologia de Alimentos, Universidade Tecnológica Federal do Paraná,
Rua dos Pioneiros, 3131, 86036-370. Londrina-PR, Brazil.
Este estudo avaliou a composição proximal, quantificação de ácidos graxos, atividade antioxidante por diferentes metodologias empregando procedimento Quencher e o conteúdo de fenólicos totais em diferentes cultivares brasileiros de feijão. As amostras apresentaram altas concentrações em ácidos graxos poli-insaturados, tais como ácido linoleico (191,54 a 329,50 mg g−1 de lipídios totais) e ácido α-linolênico (228,03 a 367,27 mg g−1 de lipídios totais).
As razões dos somatórios de ácidos graxos ômega 6 e 3 foram baixas, entre 0,71 e 1,12. Em relação aos ensaios de atividade antioxidante, as cultivares apresentaram maiores resultados pela técnica de ácido 2,2-azinobis (3-etilbenzotiazolino-6-sulfônico) (ABTS), de 2401,34 a 4394,80 µmol equivalente Trolox g−1. Os menores resultados foram observados no ensaio de
poder antioxidante de redução do ferro (FRAP), de 530,93 a 1440,13 µmol equivalente Trolox g−1.
Os resultados dos ensaios 2,2-difenil-1-picrilhidrazilo (DPPH) e ABTS apresentaram a maior correlação (r = 0,619). As cultivares também apresentaram altas concentrações em compostos fenólicos totais, que variaram de 81,85 a 173,65 mg equivalente ácido gálico 100g−1.
This study quantified fatty acids and evaluated the proximate composition, antioxidant activity paired with Quencher procedure and total phenolic compounds in Brazilian bean cultivars. The samples showed high amounts of polyunsaturated fatty acids, such as linoleic acid (191.54 to 329.50 mg g−1 of total lipids) and α-linolenic acid (228.03 to 367.27 mg g−1 of
total lipids). The obtained ratios between Omega 6 and 3 fatty acids were low, between 0.71 and 1.12. In relation to antioxidant activity assays, the cultivars showed the best results upon employing the 2,2-azinobis (3-ethyl-benzothiazoline-6-sulfonic acid) (ABTS) method (2401.34 to 4394.80 µmol Trolox equivalent g−1). The lowest results were observed in the ferric reducing
antioxidant power (FRAP) assays, 530.93 to 1440.13 µmol Trolox equivalent g−1. The results from
2,2-diphenyl-1-picrylhydrazyl (DPPH) and ABTS methods showed the greatest correlation between themselves (r = 0.619). High concentrations of total phenolic compounds were also detected in the studied cultivars, which varied from 81.85 to 173.65 mg gallic acid equivalent 100g−1.
Keywords: brazilian beans, antioxidant assays, Quencher procedure
Introduction
The common bean (Phaseolus vulgaris L.) is the most important pulse (annual leguminous food crops, such as chickpea, cowpea, lentils, pea and others that are harvested for dry seeds) in the world, among the approximately twenty species of legumes most consumed by humans.1,2
It is an important source of protein, minerals, and vitamins for millions of people in developing and developed nations and is a staple food of the South American, and Eastern and Southern African populations.3 Among these
countries, Brazil is not only the second largest world producer of beans, with approximately 3.1 millions of tons produced, but is also one of most important consumers (16.30 kg per capita year−1).4
inhibitors, polyphenols and tannins, which possess antioxidant activity.5,6
Some researchers reported the potential of common beans as antioxidant compound sources,7-9 both eaten alone
or employed in meals.10 In general, an antioxidant compound
is any substance which is present in low concentrations when compared to an oxidizable substrate and effectively delays or inhibits its oxidation.11 Nowadays, there is great concern
about the damage caused by oxidative stress, which can cause damage to DNA, giving carcinogenic effects.12 As a
result, the importance of studying the antioxidant capacity of foods has been increasing.
Actually, there are many analytical methods aimed at the determination of antioxidant capacity in foods.13-16 Among
these methods, the ones which use solvents to extract antioxidant analytes exhibit certain limitations. Most foods contain a mixture of hydrophilic and lipophilic compounds that exist in free form or bound to other macromolecules. Therefore, the use of mixture/unique solvents does not cover all compounds responsible for antioxidant activity in foods, underestimating the final results,17 since they do
not act alone, but in synergy.18
However, the Quencher procedure for measuring antioxidant capacity overcame this limitation. This procedure avoids the solvent extraction and hydrolysis steps. As both soluble and insoluble parts of foods simultaneously come into contact with radical compounds, the measure of the total antioxidant capacity of a given food becomes more accurate. Furthermore, these results are more realistic regarding the antioxidant activity of food in the human gastrointestinal tract, since the simultaneous actions of all of the antioxidants present in the samples is taken into account, while in the multiple extraction procedures, the total antioxidant capacity is only represented by the sum of antioxidant capacity of soluble and insoluble fractions measured at different times.17
The Quencher procedure was employed in cereals, beef, walnuts and in some bean varieties.19-21 However,
it was not used in legumes of Brazilian origin. This fact, allied with the scarce reports regarding their physicochemical composition, suggests that deeper studies about these subjects are needed. Thus, this work aimed at the antioxidant capacity determination of bean cultivars planted in different regions of Brazil, through the employment of the ferric reduction antioxidant power method, as well as 2,2-diphenyl-1-picrylhydrazyl (DPPH) and 2,2-azinobis (3-ethyl-benzothiazoline-6-sulfonic acid) (ABTS) radical capture assays, paired with the Quencher procedure. The proximate composition and the total amount of phenolic compounds of the studied cultivars were also determined, and their fatty acids were quantified.
Experimental
Grain sampling
All of the bean cultivars (BRS Esplendor, BRS Valente, BRS Notável, BRS Ametista, BRS Campeiro, BRS Agreste, BRS Pontal, and BRS Requinte) were harvested in the Capivara farm experimental area (South latitude: 16°28’00’’, West longitude: 49°17’00’’ and Altitude: 823.00 meters) of EMBRAPA Arroz e Feijão unit in the year 2012, and they were stored until analysis. All samples were ground separately.
Chemical analysis
All analyses were accomplished in three replicates. Total lipids (TL) in the bean samples were determined according to Bligh and Dyer.22 The moisture content was
determined using AOAC Official Method 930.15, ash content using AOAC Official Method 942.05, and crude protein (CP) was measured following AOAC Official Method 960.52,23 using a factor of 6.25 to convert the
percentage of nitrogen into protein percentage and the nifext fraction was estimated by the difference.
Fatty acid composition
Fatty acid methyl esters (FAME) were prepared by total lipid methylation following Hartman and Lago.24
The methyl esters were separated by gas chromatography in a Varian 3380 (USA) gas chromatograph fitted with a flame ionization detector (FID) and a fused-silica capillary column (100 m × 0.25 mm id., 0.25 µm cyanopropyl CP-7420 select FAME). The injector and detector temperatures were 200 and 240 ºC, respectively. The column temperature was maintained at 185 °C for 8 min, followed by a heating rate of 4 °C min−1 until 235 °C, which
was maintained for 0.5 min. The ultra-pure gas flows were 1.2 mL min−1 carrier gas (hydrogen), 30 mL min−1 make-up
gas (nitrogen), 350 mL min−1 synthetic air, and 35 mL min−1
hydrogen flame gas, split injection ratio 1/80.
For the identification of fatty acids, the retention times were compared to those of standard methyl esters (Sigma, USA). Quantification of fatty acids was performed using tricosanoic acid methyl ester (Sigma, USA) as an internal standard, according to Joseph and Ackman.25 Peak areas
were determined using the software Star 5.0 (Varian, USA).
Antioxidant capacity analysis
(0.177 mm) sieve, to avoid any influence of different particle sizes in the Quencher procedures.17
The work solutions used in this study were prepared according to Serpen, Gökmen and Fogliano.20 The stock
solution of 2,2-diphenyl-1-picrylhydrazyl (DPPH) used was obtained by dissolving 40 mg of DPPH in 200 mL of ethanol/water mixture (50:50, v/v). The absorbance value of 0.75-0.80 was set diluting the stock solution in approximately 800 mL of water/ethanol (50:50, v/v) mixture.
For the ABTS assay, the stock solution of ABTS•+ was
prepared according to Re et al.,15 reacting the ABTS stock
solution (7 mol L−1) with potassium persulfate (2.45 mol L−1).
The final solution was allowed to stand in the dark at room temperature for 12-16 h before use. The working solution of ABTS•+ was prepared by diluting 10 mL of stock solution
with 800 mL of a water/ethanol (50:50. v/v) mixture, to obtain an absorbance of 0.75-0.80 at 734 nm.20
The ferric reducing antioxidant power (FRAP) solution was prepared as described by Benzie and Strain,14 diluting
an aqueous solution of 10 mmol L−1 TPTZ
(2,4,6-Tris(2-pyridyl)-s-triazine) and 20 mmol L−1 ferric chloride in
300 mmol L−1 sodium acetate buffer (pH 3.6) at a ratio of
1:1:10 (v:v:v).
Ten milligrams of each previously ground sample was weighed into a centrifuge tube. For the DPPH, ABTS•+ and
FRAP assays, 10 mL of respective working solutions were added to start the reactions. All tubes were shaken for 1 h, and centrifuged at 9200 g for 5 min. The absorbance of the supernatants were measured at 734 nm (for ABTS assay), 525 nm (for DPPH assay) or 593 nm (for FRAP assay).20
Trolox was used as a standard reference to convert the inhibition capability of each sample to the trolox equivalent antioxidant capacity (TEAC), as described by Serpen et al.20
The extraction of antioxidant compounds needed for the total phenolic assay was carried out with 10 g of each ground grain, 100 mL of a mixture of ethanol and water (50:50, v/v) and stirring for 4 h with a magnetic bar.
The total phenolic content was determined according to the method of Shahidi and Naczk.26 A 0.25 mL
aliquot of extract solution was mixed with 0.25 mL of Folin-Ciocalteu’s reagent previously diluted with water (1:1; v/v), 0.5 mL of a saturated sodium carbonate solution and 4 mL of water. The mixture was allowed to rest at room temperature for 25 min and then was centrifuged at 3800 g for 10 min. The supernatant absorbance was measured at 725 nm using a spectrophotometer (Cary Win UV 50, Varian). Gallic acid (GA) was used as a standard and the results are expressed as gallic acid equivalents (mg GAE 100 g−1).
Statistical analysis
The results were submitted to variance analysis (ANOVA) and means were compared using the Tukey test through the Statistica program, version 7.0 (STATSOFT, 1996). The significance level used for rejection of the null hypothesis was 5% (p < 0.05). Correlation coefficients (R) used to determine the relationship between antioxidant activity measured and total phenolic content were calculated by using Microsoft Office Excel software, version 2007 (MICROSOFT, 2007).
Results and discussion
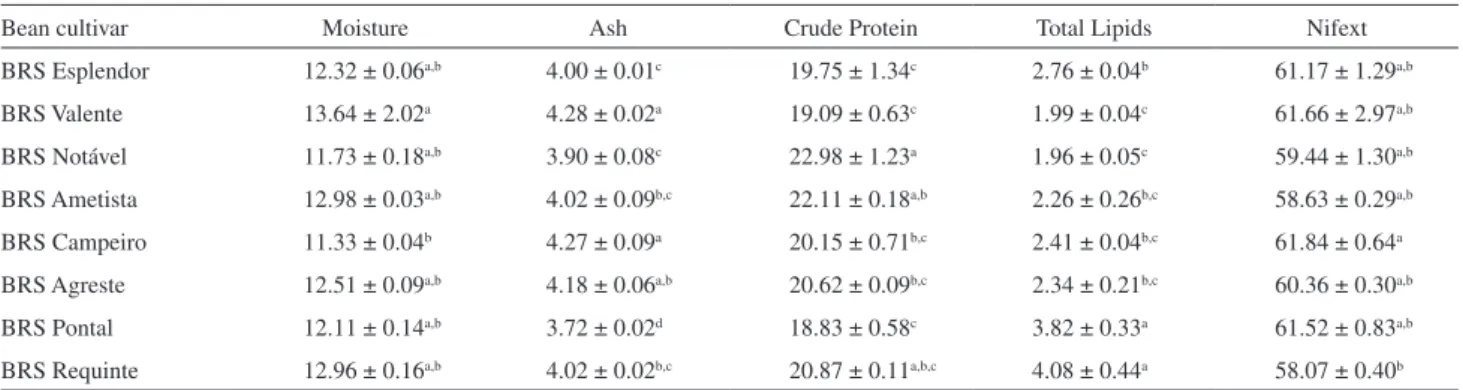
Table 1 shows the obtained physicochemical composition results from the analyzed cultivars. BRS Ametista, BRS Campeiro and BRS Requinte showed the greatest concentrations of gross protein. Their values are slightly superior to the 19.5% found by Vargas-Torres et al.27 and similar to the 22% determined by
Shimelis and Rakshit.28 In relation to total lipid contents,
BRS Pontal and BRS Requinte showed the highest values, being greater than the 1.24 and 1.59% obtained by Padovani et al.29 and Berrios et al.,30 respectively. BRS
Table 1. Proximate composition of bean cultivars (%)
Bean cultivar Moisture Ash Crude Protein Total Lipids Nifext
BRS Esplendor 12.32 ± 0.06a,b 4.00 ± 0.01c 19.75 ± 1.34c 2.76 ± 0.04b 61.17 ± 1.29a,b
BRS Valente 13.64 ± 2.02a 4.28 ± 0.02a 19.09 ± 0.63c 1.99 ± 0.04c 61.66 ± 2.97a,b
BRS Notável 11.73 ± 0.18a,b 3.90 ± 0.08c 22.98 ± 1.23a 1.96 ± 0.05c 59.44 ± 1.30a,b
BRS Ametista 12.98 ± 0.03a,b 4.02 ± 0.09b,c 22.11 ± 0.18a,b 2.26 ± 0.26b,c 58.63 ± 0.29a,b
BRS Campeiro 11.33 ± 0.04b 4.27 ± 0.09a 20.15 ± 0.71b,c 2.41 ± 0.04b,c 61.84 ± 0.64a
BRS Agreste 12.51 ± 0.09a,b 4.18 ± 0.06a,b 20.62 ± 0.09b,c 2.34 ± 0.21b,c 60.36 ± 0.30a,b
BRS Pontal 12.11 ± 0.14a,b 3.72 ± 0.02d 18.83 ± 0.58c 3.82 ± 0.33a 61.52 ± 0.83a,b
BRS Requinte 12.96 ± 0.16a,b 4.02 ± 0.02b,c 20.87 ± 0.11a,b,c 4.08 ± 0.44a 58.07 ± 0.40b
Valente, BRS Campeiro and BRS Agreste beans showed the greatest ash contents. They are slightly superior to the 3.79 % proposed by Padovani et al.29 and similar to the 4%
found by Costa et al.31 All of these comparisons were made
in relation to the common bean.
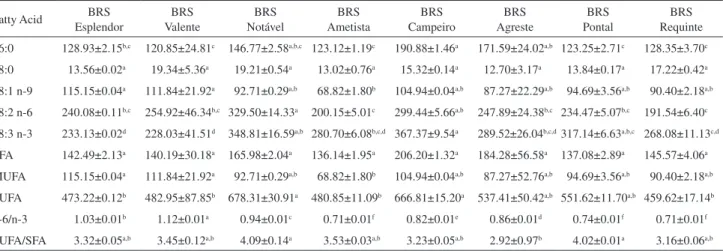
The lipid profile (Table 2) showed that the studied bean cultivars possess high amounts of polyunsaturated fatty acids (PUFA), especially α-linolenic acid. The highest values of this
strictly essential fatty acid, which is not produced by humans de novo,32 were detected in BRS Notável, BRS Campeiro
and BRS Pontal. The obtained α-linolenic percentages from
the analyzed cultivars (mean 36.67%) are superior than the reported for other crops, such as rye (6.80%), butter bean (18.34%), maize (1.62%),33 and common bean (12.4%).34
The studied samples also possess good levels of oleic acid, which helps to reduce the low density lipoprotein levels in blood and, therefore, cardiovascular diseases will occur with a lesser probability.35
The greatest values of PUFA sums (Table 2) were detected in BRS Notável and BRS Campeiro cultivars. Every sample showed low concentrations of saturated fatty acids (SFA), which led to PUFA/SFA ratios (2.92 to 4.09) superior to the minimum value required to consider a certain food as healthy.36 The average values of SFA and
PUFA sums for every studied cultivar (19.44 and 67.75%, respectively) are in concordance with the limits established by Sathe and Venkatachalam2 for the common bean,
which were 12-28% for SFA and 55-87% for PUFA. The analyzed samples also had low n-6/n-3 ratios. A value of 1:1 for this ratio is recommended because high ratios may result in allergy or anti-inflammatory disorders, and in the irregular proliferation of cells.37 Thus, every cultivar, with
the exception of BRS Valente and BRS Esplendor, are in accordance with such recommendations.
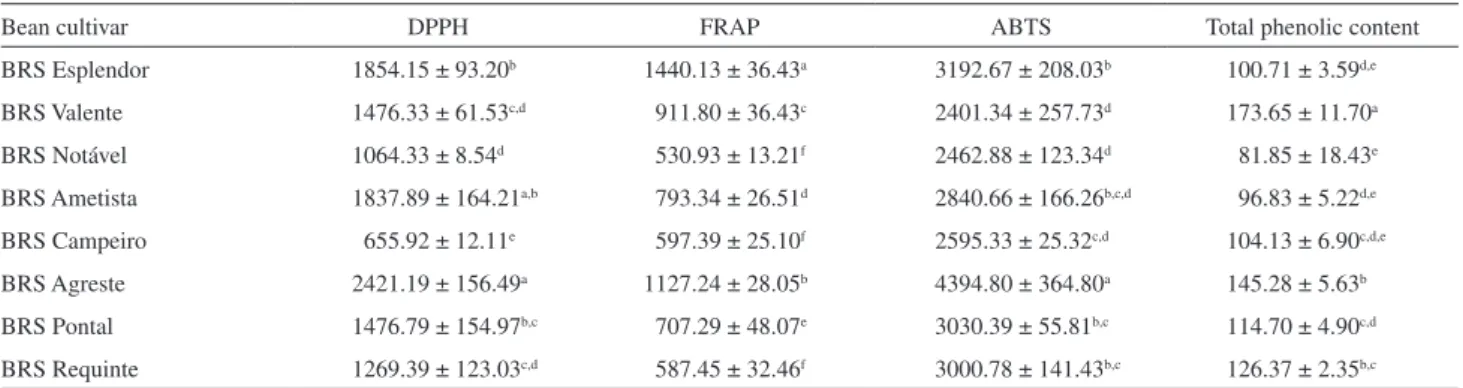
Table 3 shows the antioxidant activity results of the analyzed cultivars, as well as their total phenolic compound contents. The DPPH radical assay revealed that BRS Agreste and BRS Ametista possess the greatest antioxidant capacities. However, the best result in the FRAP assay was observed in BRS Esplendor, while the BRS Amestista showed a poor performance in this experiment. In relation to the ABTS radical capture method, BRS Agreste provided the best results.
The DPPH and ABTS radical capture assays showed closer results, which can be confirmed by the correlation obtained between their results (r = 0.619), better than the values which were observed between the FRAP × DPPH and FRAP × ABTS correlations (r = 0.316 and r = 0.152, respectively). The three techniques which were used in this work are based on the electron transfer (ET) mechanism. This mechanism is determined by the pH and solvent type of the reactional media.38 In this study, even with the
employment of a direct procedure (Quencher) without the analyte extraction step, there is some solvent in the media which solubilizes the used radicals in each assay. Regarding the DPPH and ABTS methods, a 50:50 (v/v) mixture of ethanol and water solubilizes the radicals, while in the FRAP assay the radical is solubilized in pure water. Besides this, the only radical capture method which employed pH control in this study was the FRAP assay (pH = 3.6). All of these facts can lead to the low correlation observed between FRAP and the other methods.
The obtained values in the DPPH assay for BRS Valente, BRS Requinte and BRS Pontal cultivars were approximately four times superior to the 303, 315 and 369 µmol TE g−1 determined by Ranilla et al.39 for the
same cultivars. All of the studied samples showed values superior to the 374.7 mmol kg−1 detected by Siddhuraju
Table 2. Fatty acid quantification (mg g−1 of total lipid), n-6/n-3 ratios and PUFA/SFA of bean cultivars
Fatty Acid BRS Esplendor
BRS Valente
BRS Notável
BRS Ametista
BRS Campeiro
BRS Agreste
BRS Pontal
BRS Requinte 16:0 128.93±2.15b,c 120.85±24.81c 146.77±2.58a,b,c 123.12±1.19c 190.88±1.46a 171.59±24.02a,b 123.25±2.71c 128.35±3.70c
18:0 13.56±0.02a 19.34±5.36a 19.21±0.54a 13.02±0.76a 15.32±0.14a 12.70±3.17a 13.84±0.17a 17.22±0.42a
18:1 n-9 115.15±0.04a 111.84±21.92a 92.71±0.29a,b 68.82±1.80b 104.94±0.04a,b 87.27±22.29a,b 94.69±3.56a,b 90.40±2.18a,b
18:2 n-6 240.08±0.11b,c 254.92±46.34b,c 329.50±14.33a 200.15±5.01c 299.44±5.66a,b 247.89±24.38b,c 234.47±5.07b,c 191.54±6.40c
18:3 n-3 233.13±0.02d 228.03±41.51d 348.81±16.59a,b 280.70±6.08b,c,d 367.37±9.54a 289.52±26.04b,c,d317.14±6.63a,b,c 268.08±11.13c,d
SFA 142.49±2.13a 140.19±30.18a 165.98±2.04a 136.14±1.95a 206.20±1.32a 184.28±56.58a 137.08±2.89a 145.57±4.06a
MUFA 115.15±0.04a 111.84±21.92a 92.71±0.29a,b 68.82±1.80b 104.94±0.04a,b 87.27±52.76a,b 94.69±3.56a,b 90.40±2.18a,b
PUFA 473.22±0.12b 482.95±87.85b 678.31±30.91a 480.85±11.09b 666.81±15.20a 537.41±50.42a,b 551.62±11.70a,b 459.62±17.14b
n-6/n-3 1.03±0.01b 1.12±0.01a 0.94±0.01c 0.71±0.01f 0.82±0.01e 0.86±0.01d 0.74±0.01f 0.71±0.01f
PUFA/SFA 3.32±0.05a,b 3.45±0.12a,b 4.09±0.14a 3.53±0.03a,b 3.23±0.05a,b 2.92±0.97b 4.02±0.01a 3.16±0.06a,b
for moth bean extracts through the ABTS method.40 In the
articles cited above, the antioxidant activity assays were done with analyte extraction steps, unlike the procedure that was employed in this study. Thus, the Quencher procedure provided better results for the determination of the antioxidant capacity in beans.
The studied cultivars showed good concentrations of total phenolic compounds (Table 3), which ranged from 81.85 to 173.65 mg GAE 100g−1, with BRS Valente showing
the greatest value. These amounts were superior to the limit of 19.1-48.3 mg GAE 100g−1 reported by Luthria and
Pastor-Corrales for the common bean.41 Every cultivar, with the
exception of BRS Notável, showed higher concentrations regarding those determined by Marathe et al.42 for
other legumes, such as pea (0.491 mg GAE g−1), lentil
(0.914 mg GAE g−1) and white bean (1.014 mg GAE g−1).
It can be observed that the concentrations of total phenolic compounds did not show good correlation with the antioxidant activity results (r = 0.104, r = 0.055, r = 0.051 for DPPH, FRAP and ABTS, respectively). Rocha-Guzmán et al.8 also found a poor correlation
between antioxidant activity and total phenolics in the common bean (r = 0.0694). In their work, the solvent which was used to prepare the extract for analysis was a mixture of methanol and water (50:50, v/v). The authors suggest that the low correlation can be attributed to the presence of carbohydrates in the extracts. They take up an electron, but carbohydrates cannot form a stable free radical, thus the electron which was taken is returned to the reactional media soon after. This explanation can be applied to this work, since the solvent which was employed to solubilize the radicals in the Quencher procedure is a 50:50 (v/v) mixture of ethanol and water, which also solubilizes carbohydrates. Another factor that can explain the low correlation obtained in this study is the difference between the employed methods. The antioxidant activity assays
which were used are based on the Quencher procedure (applied directly in the sample), while the total phenolic compounds assay proposed by Shahidi and Naczk 26
demands analyte extraction. The Quencher procedure, as previously mentioned, can be applied to a wider range of compounds with antioxidant activity in relation to a mixture or pure solvents, due to the varied polarity of the antioxidant compounds found by Gökmen et al.,17 differing for the
total phenolics assay, which employs only one solvent, and reduces the range of possibly detectable compounds.
Conclusions
The bean cultivars that were analyzed in this study can be considered healthy because of the greater PUFA/SFA ratios, lower values for n-6/n-3 ratio and higher concentrations of n-3 fatty acids that were observed when compared to common bean and other cereals. The antioxidant capacity results also were positive. The Brazilian cultivars showed higher values of this capacity in comparison with varieties from other regions. Besides this, the data obtained for BRS Valente, BRS Requinte and BRS Pontal are considerably greater than those reported for the same cultivars in previous studies. Thus, the Quencher procedure is highly suitable regarding its application to legumes, such as bean, especially when paired with the ABTS radical capture method, which showed the best results.
Acknowledgments
The authors would like to thank the Brazilian Federal Agency for Support and Evaluation of Graduate Education (CAPES) for financial support and the Brazilian Agricultural Research Corporation (EMBRAPA) - Arroz e Feijão unit, Santo Antônio de Goiás, Goiás, Brazil, for the donation of the grains.
Table 3. Results of antioxidant capacity by different assays (µmol TEAC g−1) and total phenolic content (mg GAE 100g−1) of bean cultivars
Bean cultivar DPPH FRAP ABTS Total phenolic content
BRS Esplendor 1854.15 ± 93.20b 1440.13 ± 36.43a 3192.67 ± 208.03b 100.71 ± 3.59d,e
BRS Valente 1476.33 ± 61.53c,d 911.80 ± 36.43c 2401.34 ± 257.73d 173.65 ± 11.70a
BRS Notável 1064.33 ± 8.54d 530.93 ± 13.21f 2462.88 ± 123.34d 81.85 ± 18.43e
BRS Ametista 1837.89 ± 164.21a,b 793.34 ± 26.51d 2840.66 ± 166.26b,c,d 96.83 ± 5.22d,e
BRS Campeiro 655.92 ± 12.11e 597.39 ± 25.10f 2595.33 ± 25.32c,d 104.13 ± 6.90c,d,e
BRS Agreste 2421.19 ± 156.49a 1127.24 ± 28.05b 4394.80 ± 364.80a 145.28 ± 5.63b
BRS Pontal 1476.79 ± 154.97b,c 707.29 ± 48.07e 3030.39 ± 55.81b,c 114.70 ± 4.90c,d
BRS Requinte 1269.39 ± 123.03c,d 587.45 ± 32.46f 3000.78 ± 141.43b,c 126.37 ± 2.35b,c
References
1. Singh, S. P. In Common bean improvement in the twenty-first
century; Singh, S., ed.; Kluwer: Dordrecht, Netherlands, 1999. 2. Sathe, S. K.; Venkatachalam, M.; Beans. In Encyclopedia of
Grain Science; Wrigley, C.; Corke, H.; Walker, C. E., eds.; Academic Press: North Ryde, Australia, 2004.
3. Lin, L. Z.; Harnly, J. M.; Pastor-Corrales, M. S.; Luthria, D. L.; Food Chem. 2008, 107, 399.
4. http://faostat3.fao.org/home/index.html#DOWNLOAD accessed in October 2012.
5. Oomah, B. D.; Cardador, A.; Loarca, G.; J. Sci. Food Agric. 2005, 85, 935.
6. Parr, A. J.; Bolwell, G. P.; J. Agric. Food Chem.2000, 80, 982. 7. Cardador-Martínez, A.; Loarca-Piña, G.; Oomah, B. D.; J. Agric.
Food Chem. 2002, 50, 6975.
8. Rocha-Guzmán, N. E.; Herzog, A.; González-Laredo, R. F.; Ibarra-Pérez, F. J.; Zambrano-Galván, G.; Gallegos-Infante, J. A.; Food Chem.2007, 103, 521.
9. Madhujith, T.; Shahidi, F.; J. Food Sci.2005, 70, 85. 10. Faller, A. L. K.; Fialho, E.; Food Res. Int.2012, 49, 508. 11. Sies, H.; Stahl. W.; Am. J. Clin. Nutr.1995, 62, 1315. 12. Klaunig, J. E.; Wang, Z.; Pu, X.; Zhou, S.; Toxicol. Appl.
Pharmacol. 2011, 254, 86.
13. Brand-Williams, W.; Cuvelier, M. E.; Berset, C.; LWT-Food
Sci. Technol. 1995, 28, 25.
14. Benzie, I. F. F.; Strain, J. J.; Anal. Biochem.1996, 239, 70. 15. Re, R.; Pellegrini, N.; Proteggente, A.; Pannala, A.; Yang, M.;
Rice-Evans, C.; Free Radical Biol. Med. 1999, 26, 1231. 16. Cao, C.; Alessio, H. M.; Cutler, R. G.; Free Radical Biol. Med.
1993, 14, 303.
17. Gökmen, V.; Serpen, A.; Fogliano, V.; Trends Food Sci. Technol. 2009, 20, 278.
18. Levine, M.; Conry-Cantilena, C.; Wang, Y.; Welch, R. W.; Washko, P. W.; Dhariwal, K. R.; Park, J. B.; Lazarev, A.; Graumlich, J. F.; King, J.; Cantilena, L. R.; Proc. Natl. Acad. Sci. U. S. A.1996, 93, 3704.
19. Serpen, A.; Gökmen, V.; Pellegrini, N.; Fogliano, V.; J. Cereal Sci. 2008, 48, 816.
20. Serpen, A.; Gökmen, V.; Fogliano, V.; Meat Sci.2012, 90, 60. 21. Açar, O. C.; Gökmen, V.; Pellegrini, N.; Fogliano, V.; Eur. Food
Res. Technol. 2009, 229, 961.
22. Bligh, E. G.; Dyer, W. J.; Can. J. Biochem. Physiol. 1959, 37, 911.
23. American Organization of Analytical Chemists (AOAC);
Official Methods of Analysis, 15th ed., Association of Official Analytical Chemists: Arlington, USA, 1990.
24. Hartman, L.; Lago, R. C. A.; Lab. Pract. 1973, 22, 475. 25. Joseph, J. D.; Ackman, R. G.; J. AOAC Int. 1992, 75, 488. 26. Shahidi, F.; Naczk, M.; Food phenolics: Sources, chemistry,
effects and applications. Technomic Publishing Company: Lancaster, USA, 1995.
27. Vargas-Torres, A.; Osorio-Díaz, P.; Tovar, J.; Paredes-López, O.; Ruales, J.; Bello-Pérez, L. A.; Starch/Stärke2004, 56, 74. 28. Shimelis, E. A.; Rakshit, S. K.; LWT-Food Sci. Technol.2005,
38, 331.
29. Padovani, R. M.; Lima, D. M.; Colugnati, F. A. B.; Rodriguez-Amaya, D. B.; J. Food Comp. Anal.2007, 20, 733. 30. Berrios, J. J.; Swanson, B. G.; Cheong, W. A.; Food Res. Int.
1999, 32, 669.
31. Costa, G. E. A.; Queiroz-Monici, K. S.; Reis, S. M. P. M.; Oliveira, A. C.; Food Chem.2006, 94, 327.
32. Perini, J. A. L.; Stevanato, F. B.; Sargi, S. C.; Visentainer, J. E. L.; Dalalio, M. M. O.; Matsushita, M., Souza, N. E.; Visentainer, J. V.; Braz. J. Food Nutr.2010, 23, 1075. 33. Ryan, E.; Galvin, K.; O´Connor, T. P.; Maguire, A. R.; O’Brien,
N. M.; Plant. Foods Hum. Nutr.2007, 62, 85.
34. Grela, E. R.; Günter, K. D.; Anim. Feed Sci. Technol.1995, 52, 325.
35. Elmadfa, I.; Kornsteinter, M.; Ann. Nutr. Metab.2009, 55, 56. 36. United Kingdom Department of Health., Nutritional aspects
of cardiovascular disease. Report of the cardiovascular review
group of the committee on medical aspects of food policy, Report
on health and social subjects. No. 46; HMSO : London, UK, 1994.
37. Simopoulos, A. P.; Mol. Neurobiol.2011, 44, 203.
38. Apak, R.; Güçlü, K.; Demirata, B.; Özyürek, M.; Çelik, S. E.; Bektaşoğlu, B.; Berker, K. I.; Özyurt, D.; Molecules2007, 12, 1496.
39. Ranilla, L. G.; Genovese, M. I.; Lajolo, F. M.; J. Agric. Food Chem. 2007, 55, 90.
40. Siddhuraju, P.; Food Chem. 2006, 99, 149.
41. Luthria, D. L.; Pastor-Corrales, M. A.; J. Food Comp. Anal.
2006, 19, 205.
42. Marathe, S. A.; Rajalakshmi, V.; Jamdar, S. N.; Sharma, A.;
Food Chem. Toxicol.2011, 49, 2005.
Submitted: November 30, 2012