Article
J. Braz. Chem. Soc., Vol. 24, No. 5, 797-804, 2013. Printed in Brazil - ©2013 Sociedade Brasileira de Química 0103 - 5053 $6.00+0.00
A
*e-mail: [email protected]
Antioxidant Capacity, Total Phenolic Content, Fatty Acids and Correlation by
Principal Component Analysis of Exotic and Native Fruits from Brazil
Alessandra B. Ribeiro,a Elton G. Bonafé,b,c Beatriz C. Silva,b Paula F. Montanher,*,b
Oscar O. Santos Júnior,b Joana S. Boeingb and Jesuí V. Visentainerb
aGraduate Program on Food Science and bDepartment of Chemistry,
State University of Maringá, 87020-900 Maringá-PR, Brazil
cDepartment of Chemistry, Federal Technologic University of Paraná,
86812-460 Apucarana-PR, Brazil
As capacidades antioxidante de sete frutas nativas e exóticas do Brasil foram avaliadas usando os métodos DPPH•, ABTS•+ e FRAP, além da determinação do conteúdo de fenólicos totais e composição de ácidos graxos. Murici e dovialis apresentaram os maiores conteúdos de compostos fenólicos (243,42 e 205,98 mg EAG 100 g-1, respectivamente), e maiores capacidades
antioxidante pelo método de FRAP (24,97 e 23,70 µmol Fe2+ g-1, respectivamente). Pelos métodos
de DPPH• e ABTS•+, dovialis apresentou a maior capacidade antioxidante, 9,59 e 10,41 ET g-1,
respectivamente. Os maiores teores dos ácidos alfa-linolênico e linoleico foram encontrados na siriguela (107,86 mg AG g-1 LT) etomatinho do mato (215,50 mg AG g-1 LT), respectivamente.
A análise de componentes principais (PCA) dos ácidos graxos gerou três significantes PCs, que representaram 99,75% do conjunto de dados da variância. Os dados de PCA das análises de antioxidantes geraram dois significantes PCs, representando 97,00% do total de variância.
The antioxidant capacities of seven exotic and native fruits from Brazil were evaluated using DPPH•, ABTS•+ and FRAP assays, in addition to their total phenolic content and fatty acid composition.
Murici and dovialis presented the highest total phenolic contents (243.42 and 205.98 mg GAE 100 g-1,
respectively), and the highest antioxidant capacities by the FRAP assay (24.97 and 23.70 µmol Fe2+ g-1,
respectively). In the DPPH• and ABTS•+ assays, dovialis presented the highest antioxidant capacity, 9.59 and 10.41 TE g-1, respectively. The highest alpha-linolenic and linoleic acid contents were found
in siriguela (107.86 mg FA g-1 TL) and tomatinho do mato (215.50 mg FA g-1 TL), respectively. The
principal component analysis (PCA) of fatty acids yielded three significant PCs, which accounted for 99.75% of the data set total variance. The PCA data of the antioxidant analyses yielded two significant PCs, which accounted for 97.00% of the total variance.
Keywords: fruits, antioxidant capacity, fatty acids, alpha-linolenic acid, principal component
analysis
Introduction
Reactive oxygen species (ROS) represent the most important class of radical species generated in living systems. ROS are an umbrella term that includes both oxygen radicals (•OH, ROO• and O
2•−) and certain non-radical (H2O2) oxidizing agents and/or compounds that are easily converted into radicals.1 The overproduction of ROS and the insufficiency of antioxidant mechanisms result in oxidative stress, a deleterious process that can be an
important mediator of damage to cell structures, including lipids, membranes, proteins and DNA.2
ROS are correlated with chronic health problems such as cancer, cardiovascular disease, neurodegenerative diseases, inflammation, atherosclerosis and aging.3,4 The interest in foods containing antioxidants has increased because they are able to retard oxidation, which is a normal process of body functions.5
The increasing consumption of fruits is associated not only to a matter of taste and personal preference, but also to a concern with health improvement through the enhancement of the nutritional composition of food sources rich in essential nutrients and micronutrients, such as fiber, vitamins, minerals and secondary phenolic compounds.7,8
The antioxidant capacity of fruits vary according to their composition in phenolic compounds, vitamins C and E, carotenoids, flavonoids and other polyphenols.9 In addition to antioxidant compounds, fruit has essential polyunsaturated fatty acids, linoleic acid (LA, 18:2n-6) and alpha-linolenic acid (LNA, 18:3n-3). These fatty acids are considered strictly essential because they cannot be synthesized by the human body and must be supplied through the diet.10
FRAP (ferric reducing antioxidant power), ABTS•+
(2,2'-azino-bis-3-ethylbenzthiazoline-6-sulphonic acid) and DPPH• (1,1-diphenyl-2-picrylhydrazyl) assays
are the most widely used methods for determining the antioxidant capacity of in vitro fruit. The results obtained depend upon the method used.7,11 These methods differ in terms of assay principles and experimental conditions. Because multiple reaction characteristics and mechanisms are usually involved, no single assay accurately quantifies all antioxidants in a mixed or complex system.12 Thus, the use of two or more methods has been shown to provide greater confidence in the elucidation of the complete profile of the total antioxidant capacity of foodstuff.13
The aim of this study was to evaluate the determination of the antioxidant capacity of seven exotic and native fruits from Brazil by DPPH•, ABTS•+ and FRAP assays and their
total phenolic content (TPC) and fatty acid composition using principal component analysis (PCA).
Experimental
Chemical reagents
The reagents used were DPPH•, ABTS,
6-hydroxy-2,5,7,8-tetramethyl chroman-2-carboxylic acid (Trolox), 2,4,6-tris(2-pyridyl)-s-triazine (TPTZ) methyl tricosanoate (23:0), fatty acid methyl ester mixture standard 189-19 and
Folin-Ciocalteu phenol reagent from Sigma-Aldrich (São Paulo, Brazil). Potassium persulfate from Neon, ferrous sulfate heptahydrate and gallic acid from Vetec and sodium carbonate from J. T. Baker were also used. All solvents and chemicals were of analytical grade.
Sample preparation
The respective botanical identifications and geographical origin of the seven exotic and native fruits from Brazil under investigation are provided in Table 1. Fresh fruit samples (ca. 2 kg for each fruit) were acquired from a farm located in Monte Alegre city, São Paulo state (23o35’31”S and 48o38’38”W). The fruits were washed with tap water and the peels and seeds were removed manually. The pulps of the different fruits were chopped and homogenized in a blender until obtain a uniform sample before analysis.
Extraction of antioxidants
The extracts were prepared using approximately 10.00 g of homogenized sample in 100.0 mL of ethanol under magnetic stirring for 4 h. After filtration, the extracts were concentrated under reduced pressure at 40 ºC to determine their antioxidant capacity by the DPPH•, ABTS•+,
FRAP assays and their TPC. The extract solutions for the different fruits for each methodology were prepared with the appropriate solvents. The absorbance values obtained were in accordance with the range of the respective method calibration curves. The results are expressed in fresh weight (FW).
DPPH• (free radical-scavenging) assay
The DPPH• scavenging capacity was measured using
the method described by Brand-Williams et al.14 with modifications.12 Briefly, the fruit extract solutions (25 µL) were added to 2 mL of a 6.25 × 10⁻⁵ mol L-1 DPPH• methanol
solution. The absorbance of the resulting solutions was measured at 517 nm after gently mixing and then letting the solutions stand at room temperature for 30 min. Methanolic
Table 1. List of the seven exotic and native fruits from Brazil included in this study
Common name Scientific name Family Origin
Araçá boi Eugenia stipitata Myrtaceae Brazil
Cajamanga Spondias dulcis Anacardieceae Islands of Polynesia
Siriguela Spondias purpurea L. Anacardiacea Central America
Dovialis Dovyalis caffra Flacourtiaceae South Africa
Landim Posoqueira acutifólia Rubiaceae Brazil
Murici Byrsonima crassifolia (L.) Kunth Malpighiaceae Brazil
solutions of known Trolox concentrations in the range of 0-2000 µmol L-1 were used for calibration. The results were expressed as µmol Trolox equivalents (TE) g-1 FW using a calibration curve (y = 0.686 − 2.90 × 10⁻⁴x, r2 = 0.997).
ABTS•+ assay
The ABTS•+ assay was based on a method developed by Re et al.15 with modifications.7 ABTS•+ radical cations
were produced by reacting 7.0 mmol L-1 of an ABTS stock solution with 145.0 mmol L-1 of potassium persulfate and allowing the mixture to stand in the dark at room temperature for 12-16 h before use. The ABTS•+solution
was diluted with ethanol to obtain absorbance at 0.70 ± 0.02 at 734 nm. Absorbance was recorded 6 min after the addition of 30 µL of either fruit extract solutions or a Trolox standard to 3 mL of a diluted ABTS•+solution and mixing.
Known concentrations of ethanolic solutions of Trolox in the range of 0-2000 µmol L-1 were used for calibration (y = 0.682 – 2.91.10-4x, r2 = 0.999), and the results were expressed as µmol Trolox equivalents (TE) g-1 FW.
FRAP (ferric reducing antioxidant power) assay
The FRAP assay was determined as previously described by Benzie and Strain16 with modifications. The FRAP reagent was prepared by mixing of acetate buffer (0.3 mol L-1, pH 3.6), TPTZ (10.0 mmol L-1) and FeCl
3 (20.0 mmol L -1)
solutions in the ratio 10:1:1, respectively. 100 µL fruit extract solutions and 300 µL of distilled water were added to 3.0 mL of the FRAP reagent, which was kept in the dark for 30 min at 37 °C. The absorbance was measured in comparison with a blank at 593 nm. Aqueous solutions of known Fe(II) concentrations in the range of 0-1500 µmol L-1 (FeSO
4.7H2O) were used for the calibration curve (y = 0.006 + 6.55.10-4x, r2 = 0.999), and the results were expressed as µmol Fe2+ g-1 FW.
Total phenolic content (TPC)
TPCs of fruit extracts were analyzed using Folin-Ciocalteu reagent.17 Fruit extract solutions (250 µL) were mixed with 250 µL of the Folin-Ciocalteu reagent (diluted in distilled water, 1:1 v/v), 500 µL of a sodium carbonate saturated solution and 4 mL of distilled water. After 25 min of rest, the mixture was centrifuged for 10 min at 3000 rpm (1638 g) and the absorbance was read on a spectrophotometer at 725 nm. Methanolic solutions of known gallic acid concentrations in the range of 0-250 mg L-1 were used for calibration. The results were expressed as mg gallic acid equivalents (GAE) 100 g-1 FW using the calibration curve (y = −0.0273 + 0.00517 x, r2 = 0.999).
Chromatographic analysis
Total lipids (TL) were extracted by the Bligh and Dyer method.18 Fatty acid methyl esters (FAME) were prepared by methylation of TL as described by Joseph and Ackman.19 Methyl esters were separated by gas chromatography in a Trace Ultra 3300 model (Thermo Scientific) equipped with flame ionization detector (FID) and a cyanopropyl capillary column (100 m × 0.25 mm i.d., 0.25 µm film thickness, CP-7420). The gas flow rates used were 1.2 mL min-1 carrier gas (H
2), 30 mL min-1 make-up gas (N
2), and 35 and 350 mL min-1 flame gases (H2 and synthetic air, respectively). The sample splitting rate was 1:80 and the samples (2 µL) were injected in triplicate. The operational parameters were as follows: detector and injection port temperature of 240 °C, column temperature of 185 °C for 7.5 min, programmed to increase at 4 °C min-1 to 235 °C and kept at this temperature for 1.5 min. The peak areas were determined by the ChromQuest 5.0 software. For fatty acid identification, retention times were compared with those of standard methyl esters.
Quantification (in mg fatty acid g-1 of TL) was made against tricosanoic acid methyl ester as an internal standard (23:0), as described by Joseph and Ackman.19 Theoretical FID correction factor values were used to obtain concentration values.20 Fatty acid contents were calculated in mg g-1 of TL by using equation 1:
(1)
where FA is mg of fatty acids per g of TL, AX is the peak area (fatty acids), AIS is the peak area of internal standard (IS) methyl ester of tricosanoic acid (23:0), WIS is the mass (mg) of IS added to the sample (in mg), WX is the sample mass (in mg), CFX is the theoretical correction factor, and CFAE is the conversion factor necessary to express the results as mg of fatty acids rather than as methyl esters.
Statistical analysis
All analyses were carried out in triplicate. The results were submitted to PCA using Statistica 7.0 software. Data pre-treatment was not necessary.
Results and Discussion
Antioxidant capacity and total phenolic content
capacity using DPPH•, ABTS•+ and FRAP methods. The
results are shown in Table 2.
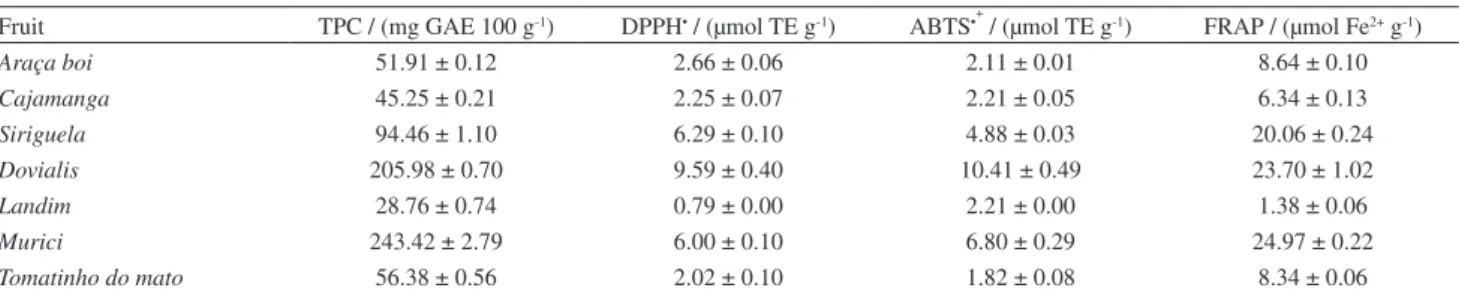
Murici (243.42 mg GAE 100 g-1) and dovialis (205.98 mg GAE 100 g-1) presented the highest TPC, and
landim the lowest value (28.76 mg GAE 100 g-1). Comparing our results with results reported by Barreto et al.,21murici and
dovialis presented higher TPC than buriti (Mauritia vinifera), banana (Musa x paradisiaca L.), marimari (Geoffroea striata (Willd.) Morong.) and egg fruit (Pouteria campechiana (Kunth) Baehni) other tropical fruits from Brazil.
Almeida et al.22 found 159.9 mg GAE 100 g-1 for edible part of murici, being this value lower than the value found by us. Souza et al.6 and Barreto et al.21 reported higher values for murici pulp, 334.37 and 384.5 mg GAE 100 g-1, respectively. This variation may happen because the composition of fruit depends on factors like climate conditions, geographic location, stage of maturation, variety and extraction method.21,23
The antioxidant capacity of the fruit extracts analyzed by the DPPH• assay varied from 0.79 to 9.59 µmol TE g-1. The lowest antioxidant capacity was observed in landim, followed by tomatinho do mato, cajamanga, araça boi,
murici, siriguela and dovialis. In comparison, dovialis,
siriguela and murici presented antioxidant capacity higher than some commercial cultivars of citrus from Brazil that ranged from 2.656 to 4.567 µmol TE g-1 FW measured by DPPH• assay.24
The analyzed fruits displayed a range of antioxidant capacity of 1.82-10.41 µmol TE g-1 measured by the ABTS•+
method, and 1.38-24.97 µmol Fe2+ g-1 measured by the FRAP method. The antioxidant capacity rank based on the ABTS•+ method was: tomatinho do mato < araça boi <
cajamanga = landim < siriguela < murici < dovialis, and by using the FRAP method: landim < cajamanga < tomatinho do mato < araça boi < siriguela < dovialis < murici.
Fu et al.25 evaluated the antioxidant capacity of ethanolic extracts (water-ethanol, 1:1, v/v) of 62 fruits by the FRAP and ABTS•+ methods. Comparatively to our results,
dovialis, murici and siriguela presented a higher antioxidant
capacity than jackfruit (2.57 µmol Fe2+ g-1 and 2.37 µmol TE g-1), litchi (7.22 µmol Fe2+ g-1 and 4.63 µmol TE g-1), avocado (2.76 µmol Fe2+ g-1 and 1.16 µmol TE g-1) and grapefruit (6.74 µmol Fe2+ g-1 and 3.04 µmol TE g-1) measured by FRAP and ABTS•+ methods, respectively.
The DPPH•, FRAP and ABTS•+ methods indicated that
siriguela, murici and dovialis have the highest levels of antioxidants probably due to their highest TPC.
Correlation between study variables
The correlations between the results of the DPPH•,
FRAP and ABTS•+ methods and TPCs are shown in
Figure 1.
A positive correlation was found between TPC-DPPH•
(0.8277), TPC-ABTS•+ (0.8835) and TPC-FRAP (0.9153).
These results suggest that phenolic compounds, such as phenolic acids and flavonoids, may be important contributors to the antioxidant capacity. Other studies such as those by Rufino et al.,7 Almeida et al.22 and Vasco et al.23 report a relationship between TPC and antioxidant capacity. T h e c o r r e l a t i o n s b e t w e e n D P P H•- A B T S• +,
FRAP-DPPH• and FRAP-ABTS•+ were high, 0.9554,
0.9251 and 0.8663, respectively. Ma et al.12 evaluated the fruits of eight mango tree genotypes for antioxidant capacity and found high linear correlation coefficients between the DPPH•, FRAP and ABTS•+ methods.
According to Huang et al.,26 antioxidant capacity methods can be divided into two types, hydrogen atom transfer (HAT) reaction and electron transfer (ET) reaction-based methods, depending how the radicals are deactivated by the antioxidants. HAT-based methods measure the classical ability of an antioxidant to scavenge free radicals by hydrogen donation and form stable compounds. ET-based methods detect the ability of an antioxidant to transfer one electron and reduce any compound. The TPC determination by the Folin-Ciocalteu reagent, ABTS•+, FRAP and DPPH•
methods are considered ET methods. This classification can explain the high correlation coefficients shown in Figure 1,
Table 2. Antioxidant capacity and total phenolic content (TPC) in ethanolic extracts of fruits from Brazil based on fresh weight (FW)a
Fruit TPC / (mg GAE 100 g-1) DPPH• / (µmol TE g-1) ABTS•+ / (µmol TE g-1) FRAP / (µmol Fe2+ g-1)
Araça boi 51.91 ± 0.12 2.66 ± 0.06 2.11 ± 0.01 8.64 ± 0.10
Cajamanga 45.25 ± 0.21 2.25 ± 0.07 2.21 ± 0.05 6.34 ± 0.13
Siriguela 94.46 ± 1.10 6.29 ± 0.10 4.88 ± 0.03 20.06 ± 0.24
Dovialis 205.98 ± 0.70 9.59 ± 0.40 10.41 ± 0.49 23.70 ± 1.02
Landim 28.76 ± 0.74 0.79 ± 0.00 2.21 ± 0.00 1.38 ± 0.06
Murici 243.42 ± 2.79 6.00 ± 0.10 6.80 ± 0.29 24.97 ± 0.22
Tomatinho do mato 56.38 ± 0.56 2.02 ± 0.10 1.82 ± 0.08 8.34 ± 0.06
aMean value ± standard deviation; n = 3. GAE: gallic acid equivalents; TE: Trolox equivalents; DPPH•: 1,1-diphenyl-2-picrylhydrazyl; ABTS•+:
all methods act through the same mechanism.
Fatty acids
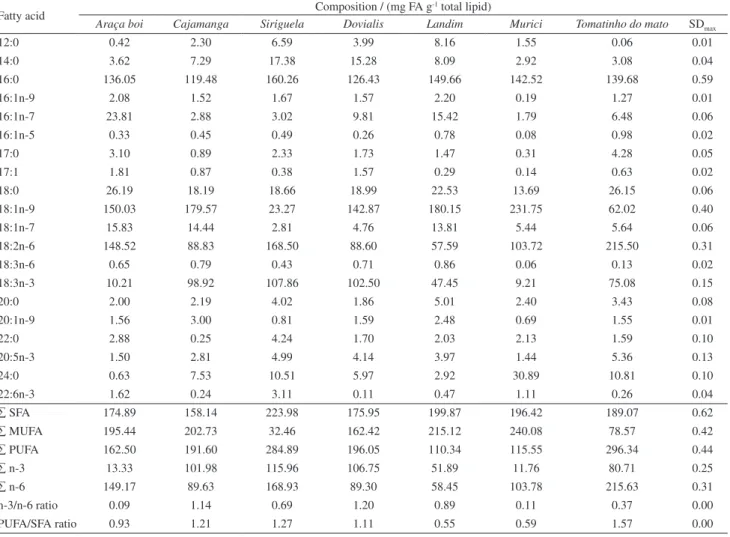
The fatty acid (FA) composition of the investigated fruit is shown in Table 3. A total of twenty fatty acids in the pulp of the fruit was detected, quantified and characterized as saturated (SFA), monounsaturated (MUFA) or polyunsaturated (PUFA) fatty acids. These classes of fatty acids were also found by Santos et al.27 in different parts of grapes and Yi et al.28 in two varieties of grape pomace powder. The lowest content of total SFA was found in
cajamanga (158.14 mg FA g-1 TL) and the highest content in siriguela (223.98 mg FA g-1 TL). However, the MUFA content presented a significant variation, between 32.46 and 240.08 mg FA g-1 TL for the siriguela and murici samples. The PUFA content of the fruit had a minimum value of 110.34 and a maximum value of 296.34 mg FA g-1 TL in landim and tomatinho do mato, respectively.
Palmitic acid (PA, 16:0) was the major SFA in all of the analyzed fruit. The main MUFA in fruit was oleic acid (OA, 18:1n-9), and the highest amount obtained was in murici
(Table 3). According to Bellido et al.,29 the ingestion of Figure 1. Correlation coefficients between the methods DPPH•, FRAP,
ABTS•+ and total phenolic content (TPC).
Table 3. Fatty acid compositions in different fruits from Brazil quantified in mg FA g-1 total lipidsa
Fatty acid Composition / (mg FA g
-1 total lipid)
Araça boi Cajamanga Siriguela Dovialis Landim Murici Tomatinho do mato SDmax
12:0 0.42 2.30 6.59 3.99 8.16 1.55 0.06 0.01
14:0 3.62 7.29 17.38 15.28 8.09 2.92 3.08 0.04
16:0 136.05 119.48 160.26 126.43 149.66 142.52 139.68 0.59
16:1n-9 2.08 1.52 1.67 1.57 2.20 0.19 1.27 0.01
16:1n-7 23.81 2.88 3.02 9.81 15.42 1.79 6.48 0.06
16:1n-5 0.33 0.45 0.49 0.26 0.78 0.08 0.98 0.02
17:0 3.10 0.89 2.33 1.73 1.47 0.31 4.28 0.05
17:1 1.81 0.87 0.38 1.57 0.29 0.14 0.63 0.02
18:0 26.19 18.19 18.66 18.99 22.53 13.69 26.15 0.06
18:1n-9 150.03 179.57 23.27 142.87 180.15 231.75 62.02 0.40
18:1n-7 15.83 14.44 2.81 4.76 13.81 5.44 5.64 0.06
18:2n-6 148.52 88.83 168.50 88.60 57.59 103.72 215.50 0.31
18:3n-6 0.65 0.79 0.43 0.71 0.86 0.06 0.13 0.02
18:3n-3 10.21 98.92 107.86 102.50 47.45 9.21 75.08 0.15
20:0 2.00 2.19 4.02 1.86 5.01 2.40 3.43 0.08
20:1n-9 1.56 3.00 0.81 1.59 2.48 0.69 1.55 0.01
22:0 2.88 0.25 4.24 1.70 2.03 2.13 1.59 0.10
20:5n-3 1.50 2.81 4.99 4.14 3.97 1.44 5.36 0.13
24:0 0.63 7.53 10.51 5.97 2.92 30.89 10.81 0.10
22:6n-3 1.62 0.24 3.11 0.11 0.47 1.11 0.26 0.04
∑ SFA 174.89 158.14 223.98 175.95 199.87 196.42 189.07 0.62
∑ MUFA 195.44 202.73 32.46 162.42 215.12 240.08 78.57 0.42
∑ PUFA 162.50 191.60 284.89 196.05 110.34 115.55 296.34 0.44
∑ n-3 13.33 101.98 115.96 106.75 51.89 11.76 80.71 0.25
∑ n-6 149.17 89.63 168.93 89.30 58.45 103.78 215.63 0.31
n-3/n-6 ratio 0.09 1.14 0.69 1.20 0.89 0.11 0.37 0.00
PUFA/SFA ratio 0.93 1.21 1.27 1.11 0.55 0.59 1.57 0.00
aResults expressed as average total fatty acids of tree replicates. SFA: saturated fatty acid; AGMI: monounsaturated fatty acid; AGPI: polyunsaturated fatty
OA is related to the reduction of the level of low-density lipoproteins (LDL) and, consequently, the prevention of arteriosclerosis. All of the studied fruit are sources of OA, with values ranging from 23.27 to 231.75 mg FA g-1 TL of fruit.
The main PUFA were alpha-linolenic acid (LNA, 18:3n-3) in dovialis (102.50 mg FA g-1 TL) and siriguela (107.86 mg FA g-1 TL), and linoleic acid (LA, 18:2n-6) in landim, siriguela, tomatinho do mato, araça boi and
murici. The major concentrations of LA were found in
tomatinho do mato, 215.50 mg FA g-1 TL. LA and LNA are essential fatty acids metabolized by the same sequential denaturation and elongation enzyme systems, which results in the production of long-chain polyunsaturated fatty acids (LC-PUFA) of the n-3 and n-6 series.30
The n-3/n-6 ratio reference value in the human diet varies between 0.1 and 0.2. In the last few years, some studies
have proposed that this ratio has moved from 0.033 to 0.05 in Western diets, a value considered extremely low since the ideal value is between 0.5 and 1.0.30 Thus, landim and
siriguela samples presented ideal n-3/n-6 ratio values, whereas araça boi and murici showed concentrations in excess of n-6 fatty acids, and cajamanga and dovialis had extreme amounts of n-3 fatty acids (Table 3). The n-3/n-6 ratio is considered crucial for the conversion of LNA into long-chain n-3 PUFA, as n-6 PUFA (LA) also competes for ∆-6-desaturase enzyme.31
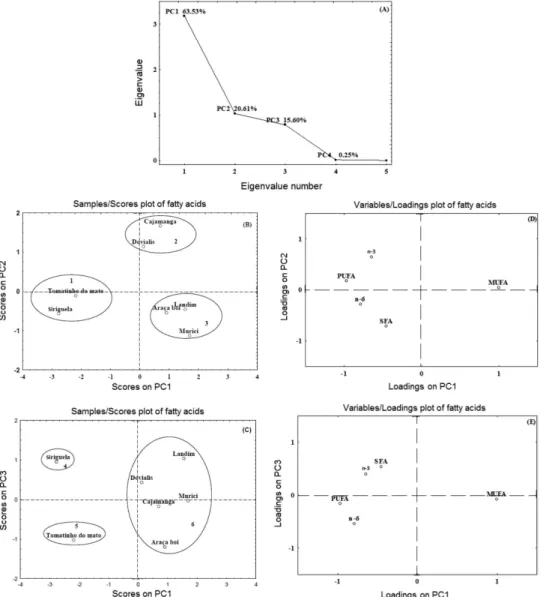
PCA analysis
Multivariate analysis can summarize the variability of a complex data set and present it in a most interpretable form, such as principal components. The PCA analysis of antioxidants and fatty acid analyses of different fruits
were carried out because this matrix is a very complex mixture.32 Figures 2a and 3a show that the eigenvalues and approximately 100% of the variance of the original data were explained by both analyses. Thus, three components were retained for the principal component analysis for the fatty acids and two components for the antioxidant analyses (TPC, DPPH•, ABTS•+ and FRAP assays).
The first component (PC1) for fatty acids (Figure 2a) explained 63.53% of the total variance of the data set, and the loadings indicated high positive contributions from MUFA and negative contributions from PUFA. The second component (PC2) was associated with 20.61% and the third component (PC3) explained 15.60% the total variance. The n-3 presented a positive contribution to both PCs, SFA and n-6 presented negative contributions to PC2 and PC3, respectively. The total variance of the data set for the fatty acid analysis was 99.75%.
Figures 2b-2e show the principal component analysis of fatty acids in the fruit samples. Analyzing Figures 2b and 2c, it is possible to observe that three groups were formed. In Figure 2b, the groups were: tomatinho do mato and
siriguela (1), cajamanga and dovialis (2), araça boi,
landim and murici (3), and in Figure 2c the groups were:
siriguela (4), tomatinho do mato (5), dovialis, landim,
murici, cajamanga and araça boi (6). The evaluation of the importance of the loadings (Figures 2d and 2e) for the separation of the score groups indicated that the major contributors to PC1 were MUFA and PUFA, respectively. The contributors to PC2 (Figure 2d) were n-3 and SFA, and to PC3 (Figure 2e) n-3 and n-6. Analyzing Figure 2b (score on PC1 × PC2), Figure 2d (loadings PC1 × PC2) and Figure 2e (loadings PC1 × PC3), PUFA was the variable responsible for the formation of group 1, for group 2, it was the sum of omega-3 fatty acids (n-3), and for group 3, it was MUFA. Moreover, the correlation between Figures 2b and 2c shows that variable n-3 contributed to group 4, for group 5, it was the sum of omega-6 fatty acids (n-6), and for group 6, it was both SFA and MUFA.
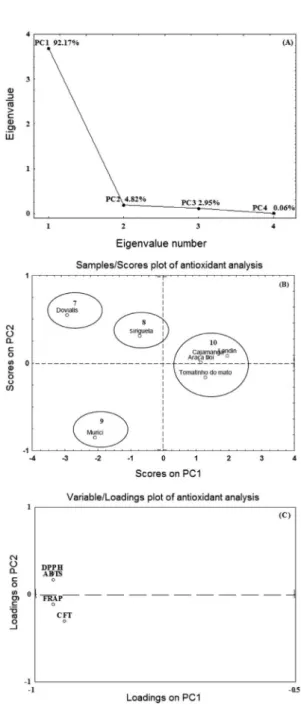
In the antioxidant analyses by TPC, DPPH•, ABTS•+ and
FRAP assays, two components explained about 97.00% of the total variance (Figure 3a), PC1 (92.17%) and PC2 (4.82%). The DPPH•, ABTS•+ and FRAP variables
contributed negatively to PC1. The loadings on PC2 indicated high contributions from DPPH• and TPC, with
positive and negative values, respectively.
Figures 3b and 3c show PCA, samples/score and variables/loadings of antioxidant analyses of the fruit samples. In Figure 3b, the formation of four groups can be observed: dovialis (7), siriguela (8), murici (9) and
cajamanga, landim, araça boi and tomatinho do mato (10). The DPPH• and ABTS•+ variables were responsible for the
separation of group 7, FRAP and TPC for group 9, DPPH•,
ABTS•+ and FRAP for group 8, with group 10 presenting
the lowest values in all analyses.
Conclusions
showed the contribution of individual fatty acids and antioxidants to the total variability of the main component. Eigen analysis of the correlation matrix loadings of the three significant PCs for fatty acids explained more than 99% of the total data set variability and two significant PCs for antioxidant analyses explained about 97% of the total data set variability.
Acknowledgements
The authors would like to thank the Coordenação de Aperfeiçoamento de Pessoal de Nível Superior (CAPES) and the Conselho Nacional de Desenvolvimento Científico e Tecnológico (CNPq) for their financial support and fellowships.
References
1. Williams, G. M.; Jeffrey, A. M.; Regul. Toxicol. Pharmacol. 2000, 32, 283.
2. Buonocore, G.; Perrone, S.; Tataranno, M. L.; Semin. Fetal
Neonatal Med.2010, 15, 186.
3. Bagchi, D.; Bagchi, M.; Stohs, S. J.; Das, D. K.; Ray, S. D.; Kuszynski, C. A; Joshi, S. S.; Pruess, H. G.; Toxicology2000,
148, 187.
4. Biglari, F.; Alkarkhi, A. F. M.; Easa, A. M; Food Chem. 2008,
107, 1636.
5. Soares, A. A.; Souza, C. G. M.; Daniel, F. M.; Ferrari, G. P.; Costa, S. M. G.; Peralta, R. M.; Food Chem.2009, 112, 775. 6. Souza, V. R.; Pereira, P. A. P.; Queiroz, F.; Borges, S. V.;
Carneiro, J. D. S.; Food Chem. 2012, 134, 381.
7. Rufino, M. S. M.; Alves, R. E.; Brito, E. S.; Pérez-Jiménez, J.; Saura-Calixto, F.; Mancine-Filho, J.; Food Chem. 2010, 121, 996.
8. Ruxton, C.; Gardner, E.; Walker, D.; Int. J. Food Sci. Nutr. 2006,
57, 249.
9. Saura-Calixto, F.; Goni, I.; Food Chem.2006, 94, 442. 10. Aguiar, A. C.; Cottica, S. M.; Boroski, M.; Oliveira, C. C.;
Bonafé, E. G.; França, P. B.; Souza, N. E.; Visentainer, J. V.;
J. Braz. Chem. Soc. 2011, 22, 643.
11. Sánchez-Moreno, C.; Larrauri, J. A.; Food Sci. Technol. Int. 1998, 4, 391.
12. Ma, X.; Wu, H.; Liu, L.; Yao, Q.; Wang, S.; Zhan, R.; Xing, S.; Zhou, Y.; Sci. Hortic. 2011, 129, 102.
13. Pérez-Jiménez, J.; Arranz, S.; Tabernero, M.; Díaz-Rubio, M. E.; Serrano, J.; Goñi, I.; Saura-Calixto, F.; Food Res. Int.
2008, 41, 274.
14. Brand-Williams, W.; Cuvelier, M. E.; Berset, C.; LWT -- Food
Sci. Technol. 1995, 28, 25.
15. Re, R.; Proteggente, A.; Pannala, A.; Yang, M.; Rice-Evans, C.;
Free Radical Biol. Med.1999, 26, 1231.
16. Benzie, I. F. F.; Strain, J. J.; Anal. Biochem. 1996, 239, 70. 17. Singleton, V. L.; Rossi, J. A. Jr.; Am. J. Enol. Vitic. 1965,16,
158.
18. Bligh, E. G.; Dyer, W. J.; Can. J. Biochem. Physiol. 1959, 37, 911.
19. Joseph, J. D.; Ackman, R. G.; J. AOAC Int.1992, 75, 488. 20. Visentainer, J. V.; Quim. Nova2012, 35, 274.
21. Barreto, G. P. M.; Benassi, M. T.; Mercadante, A. Z.; J. Braz.
Chem. Soc.2009, 20, 1856.
22. Almeida, M. M. B.; De Souza, P. H. M.; Arriaga, A. M. C.; Prado, G. M.; Magalhães, C. E. C.; Maia, G. A.; Lemos T. L. G.;
Food Res. Int.2010, 44, 2155.
23. Vasco, C.; Ruales, J.; Kamal-Eldin, A.; Food Chem. 2008, 111, 816.
24. Barros, H. R. M.; Ferreira, T. A. P. C.; Genovese, M. I.; Food Chem. 2012, 134, 1892.
25. Fu, L.; Xu, B.; Xu, X.; Gan, R.; Zhang, Y.; Xia, E.; Li, H.; Food
Chem.2011, 129, 345.
26. Huang, D.; Ou, B.; Prior, R. L.; J. Agric. Food Chem.2005, 53, 1841.
27. Santos, L. P.; Moraes, D. R.; De Souza, N. E.; Cottica, S. M.; Boroski, M.; Visentainer, J. V.; Food Res. Int.2011, 35, 1414. 28. Yi, C.; Shi, J.; Kramer, J.; Xue, S.; Jiang, Y.; Zhang, M.; Ma, Y.;
Pohorly, J.; Food Chem.2009, 114, 570.
29. Bellido, C., López-Miranda, J.; Pérez-Martínez, P.; Paz, E.; Marín, C.; Gómez, P.; Moreno, J. A.; Moreno, R.; Pérez-Jimenez, F.; Nutr., Metab. Cardiovasc. Dis. 2006, 16, 524.
30. Souza, N. E.; Matsushita, M.; Oliveira, C. C.; Franco, M. R. B.; Visentainer, J. V.; J. Sci. Food Agric.2007, 87, 1677.
31. Diwakar, B. T.; Dutta, P. K.; Lokesh, B. R.; Naidu, K. A.;
Prostaglandins, Leukotrienes Essent. Fatty Acids. 2008, 78,
123.
32. Wu, Z. G.; Rodgers, R. P.; Marshall, A. G.; J. Agri. Food Chem. 2004, 52, 5322.
Submitted: November 28, 2012