Revista Brasileira de
Engenharia Agrícola e Ambiental
Campina Grande, PB, UAEA/UFCG – http://www.agriambi.com.brv.20, n.6, p.513-518, 2016
Modeling of soil water infiltration with rainfall simulator
in different agricultural systems
Thais E. M. dos Santos
1, Edivan R. de Souza
2& Abelardo A. A. Montenegro
3 DOI: http://dx.doi.org/10.1590/1807-1929/agriambi.v20n6p513-518A B S T R A C T
This study aimed to compare models for predicting soil water infiltration rate and erosive rates using a rainfall simulator in different systems of common bean (Phaseolus vulgaris
L.) cultivation. The evaluated mathematical models were: Kostiakov, Kostiakov-Lewis, Green-Ampt and Horton. Infiltration tests were carried out considering six treatments: bean cultivated on contour with rock barriers spaced at 0.5 m between crop rows (BC1); bean cultivated on contour with rock barriers spaced at 1.0 m between crop rows (BC2); bean cultivated downslope (BDS); bean cultivated on contour with mulch (BCM); bare soil (BS) and soil under natural cover (NC). Four replicates were considered, totaling 24 field tests. Kostiakov-Lewis’s equation showed the lowest values of standard error. Soil water infiltration rate was equal to 53.3 mm h-1 in the natural vegetation treatment and to
9.49 mm h-1 in the downslope treatment. Surface roughness and the time of beginning of
surface runoff were significantly higher for the conditions with mulch cover.
Modelagem da infiltração de água no solo
com simulador de chuvas em diferentes sistemas agrícolas
R E S U M O
Objetivou-se, com o presente trabalho, comparar modelos de previsão da velocidade de infiltração de água no solo e taxas erosivas em condição de campo utilizando simulador de chuvas, em diferentes sistemas de cultivo do feijão (Phaseolus vulgaris L.). Os modelos matemáticos avaliados foram Kostiakov, Kostiakov-Lewis, Green-Ampt e Horton. Os testes de infiltração foram realizados em seis tratamentos: feijão cultivado segundo curvas de nível (FN1) associado a fileiras de pedra, espaçadas 0,50 cm; feijão cultivado segundo curvas de nível (FN2) associado a fileiras de pedra, espaçadas 1,0 m; feijão cultivado morro abaixo (FMA); feijão cultivado em nível, com cobertura morta (CM); solo descoberto (SD) e solo com cobertura vegetal nativa (CN) em quatro repetições totalizando 24 testes de campo. A equação que apresentou menores valores de erro padrão foi a de Kostiakov-Lewis. A taxa de infiltração básica de água no solo foi de 53,3 mm h-1, para o tratamento
cobertura vegetal natural enquanto que para a condição morro abaixo o valor foi de 9,49 mm h-1. A rugosidade superficial e o tempo para início do escoamento superficial
foram significativamente maiores para as condições com cobertura do solo. Key words:
semiarid bean
soil management
Palavras-chave: semiárido feijão
manejo do solo
1 Universidade Federal de Pernambuco/Centro de Biociências/Departamento de Biofísica e Radiobiologia. Recife, PE. E-mail: thaisemanuelle@hotmail.com
(Corresponding author)
2 Universidade Federal Rural de Pernambuco/Departamento de Agronomia. Recife, PE. E-mail: edivanrs@hotmail.com
3 Universidade Federal Rural de Pernambuco/Departamento de Engenharia Agrícola. Recife, PE. E-mail: abelardo.montenegro@yahoo.com.br
Introduction
The knowledge on the rate of entry of water into the soil, commonly known as infiltration, is of fundamental importance to define soil conservation techniques, plan and project of irrigation and drainage systems and help in the composition of a more real image of water retention and aeration in the soil (Paixão et al., 2009; Cecílio et al., 2013; Wang et al., 2014). According to Barros et al. (2014), the triggering of hydrological processes, such as surface runoff, erosion and the transport of solutes, is controlled by the variability of soil water infiltration, which is influenced by the spatial heterogeneity of the relief and the soil and by spatial and temporal alterations in soil use and climatic variation.
Conditions of soil surface and of the organization of its porosity along the profile are among the factors that affect the dynamics of the water infiltration process (Santos et al., 2014). Gonçalves & Moraes (2012) analyzed soil water infiltration, influenced by alterations in porosity due to management practices, and observed higher values in no-tillage management systems.
Modeling is an important tool in the development of evaluations and planning of measures of control of a certain phenomenon (Martins Filho et al., 2004). The water infiltration in to the soil can be measured at the field or estimated by mathematical models, which can be empirical or theoretical physically based. Empirical models have the advantage of allowing relating model parameters to soil characteristics, without requiring them to have a physical meaning, and encompass, in the determination of their constants, factors that are difficult to be considered in theoretical models (Brandão et al., 2006; Mirzaee et al., 2014).
Due to the importance of soil water infiltration, mathematical models have been developed to describe the process, such as the models of Kostiakov, Kostiakov-Lewis, Horton, Green & Ampt and Philip (Brandão et al., 2006). Santos et al. (2014) tested the models of Kostiakov-Lewis, Horton and Philip and observed that Horton’s was the most adequate to represent the behavior of soil water infiltration rate. On the other hand, Mirzaee et al. (2014), testing the models of Kostiakov, Horton, modified Kostiakov and revised modified Kostiakov (RMK) in soils with different textural classes, observed that the RMK model showed the best performance for most of the studied soils.
According to Brandão et al. (2006), the application of Kostiakov’s model is limited to a very long time of infiltration. In order to solve this problem, the model of Kostiakov-Lewis was developed, in which the infiltration rate tends to a constant value when time tends to infinite. Also according to these authors, the infiltration rate in Horton’s model is influenced by factors that occur on soil surface.
The model of Green & Ampt was developed based on Darcy’s equation and on a few assumptions, such as the existence of a
constant hydraulic head on soil surface during the entire process of infiltration (Zonta et al., 2010). This model stands out in comparison to the others for being based on a physical analysis of the process, expressing infiltration as a function of soil physical parameters and not of the time of the process.
According to Cunha et al. (2011), soil water infiltration must be measured through techniques capable of adequately representing the natural conditions of the soil. In field measurements, it is important to consider the impact of raindrops because, according to Panachuki et al. (2006), methods that do not consider the impact of raindrops on the soil may overestimate water infiltration, generating problems in the dimensioning of conservation projects and favoring the occurrence of soil erosion problems. Thus, researchers have widely used rainfall simulators that have been developed to simulate the typical conditions of natural rainfalls, such as impact velocity and size distribution of raindrops (Ries et al., 2014; Davidová et al., 2015).
This study aimed to compare empirical and physical models for the prediction of soil water infiltration rate with the data obtained at the field, using a rainfall simulator in different common bean (Phaseolus vulgaris L.) cultivation systems and compare the erosion rates produced by these treatments.
Material and Methods
The field study was carried out in the semiarid region of Pernambuco, in the municipality of Pesqueira-PE, Brazil, in the Mimoso Representative Basin, which belongs to the Ipanema River Basin and is located in its Western portion, upstream (8° 34’ 17” and 8° 18’ 11” S; 37° 1’ 35” and 36° 47’ 20” W). The mean annual rainfall in the region is 607 mm, with mean temperature of 23 ºC and evapotranspiration of approximately 2000 mm. The predominant vegetation is hyper-xerophytic Caatinga, cactuses and bromeliads (Montenegro & Montenegro, 2006).
The soil in the area is classified as Fluvic Neosol (EMBRAPA, 2013). For soil physical-hydraulic and chemical characterization, according to the methodology of EMBRAPA (1997), ten samples were collected in the layer of 0-20 cm. The characteristics are shown in Table 1.
Infiltration was studied using an oscillating-nozzle rainfall simulator (Veejet 80-100), with internal diameter of 12.7 mm, operating at pressure of 30 kPa. Due to the influence of the winds at the field, this pressure generated an intensity close to 60 mm h-1. Mean rainfall intensity was measured using 14 pluviometers distributed around the experimental plot. The simulator was fed by a pump submerged in a tank with capacity for 1000 L.
On the slope of the experimental area, 15 plots with area of 3 m2 (1 x 3 m) were installed and delimited by 20-cm-high zinc sheets, buried 10 cm into the soil, with the longest dimension along the direction of the 6% slope for all the plots.
OC - Organic carbon; Ds - Soil bulk density; Dp - Soil particle density; Ks - Saturated hydraulic conductivity
Physical-hydraulic characteristics Chemical characteristics Sand Silt Clay Ds Dp Porosity pH
(H2O)
P mg dm-3
K Ca Mg Na Al (H + Al) OC g kg-1
(g kg-1) kg dm-3 m3m-3 cmol cdm-3
The slope of 6% is already considered as low to medium and can reduce soil water infiltration, thus requiring the use of soil conservation practices. At the lower portion of the plots, a gutter was installed for collection of samples.
The experiment was set in a completely randomized design, with six treatments and four replicates, which resulted in a total of 24 tests of simulated rainfall. The treatments (Figure 1) were: common bean (Phaseolus vulgaris L.) cultivated on contour, associated with 8-cm-high rock barriers, spaced by 0.5 m, between crop rows (BC1); common bean cultivated on contour, associated with 8-cm-high rock barriers, spaced by 1.0 m, between crop rows (BC2); common bean cultivated downslope (BDS); common bean cultivated on contour with mulch (BCM), which consisted of bean straw uniformly distributed over the plot; bare soil (BS); and soil under natural vegetation cover (NC), which had 100% of vegetal cover. The crop was in its flowering stage, on the 35th day after sowing and was cultivated at spacing of 0.50 x 0.20 m.
Simulated rainfall tests lasted for 1 h and 20 min and the collections were performed every 5 min, from the beginning of the flow, with duration of 10 s.
Infiltration rate was then obtained through balance, considering the difference between rainfall intensity and the resulting surface runoff rate (Brandão et al., 2006).
Roughness was determined by the Manning coefficient (n), according to Braida & Cassol (1999):
In the equations of Kostiakov and Kostiakov-Lewis, k and α are parameters that depend on the soil and on its initial conditions. The constants k and α, in the model of Kostiakov, were obtained by the exponential fit between the observed infiltration and the corresponding time, while the parameters k and α in the model of Kostiakov-Lewis were obtained by the exponential fit between cumulative infiltration and the time; ii and if are initial and final infiltration, respectively. In the equation of Green-Ampt, Ks is the saturated hydraulic conductivity; Ψf is the matric potential at the wetting front; θs is the soil water content at saturation; θi is the initial soil water content and I (mm) is the cumulative infiltration. In Horton’s equation, “t” represents the fit obtained between cumulative infiltration and the time, while ii represents the initial infiltration.
The standard error of the mean was calculated for the estimated values of infiltration through Eq. 5:
Figure 1. Treatments installed at the field: (A) Bean cultivated on contour, associated with rock barriers (BC1 and BC2); (B) Bean cultivated on contour with mulch (BCM); (C) Bean cultivated downslope (BDS); (D) Soil under natural vegetation cover (NC); and (E) Bare soil (BS)
A. B. C. D. E.
h S
where:
n - Manning’s roughness coefficient, s m-1/3; h - flow height, m;
q - net flow rate per unit of width, m2 s-1; and, S - slope of the plot, m m-1.
Infiltration was modeled using the models proposed by Kostiakov (Eq. 1), Kostiakov-Lewis (Eq. 2), Green-Ampt (Eq. 3) and Horton (Eq. 4):
I= ⋅K tα
f I= ⋅ +K tα i t
(
)
(
)
f s i
I Ks 1
I mm
Ψ θ − θ
= +
(
)
( )
f i f ft
I= +i i −i exp −i
( )
standard errorSE % 100
n
= ×
where:
SE - standard error; and, n - number of data.
Statistical analysis was performed using the program SAS (SAS Institute, 1998). Treatment means were compared by Tukey test at 0.05 probability level.
Results and Discussion
The values of the parameters used in the equations, such as the standard error of the estimates, are shown in Table 2. Considering that the lower the standard error, the better is the model, among the evaluated infiltration models, in general, the model of Kostiakov-Lewis showed the best fit to the data, since it showed the lowest values of standard error for all the adopted management systems. In an isolated way, the treatment (2)
(3)
(4)
(5)
(6)
of natural cover showed the lowest values of standard error for the models of Kostiakov, Kostiakov-Lewis and Horton, while BC1 showed the best fit for the Green-Ampt model.
According to the infiltration curves (Figure 2), the Green-Ampt model showed low performance for the treatments in which the soil was under a dense vegetal cover, as observed in the conditions of bean with mulch and natural cover (Figure 2A and 2E), which showed coefficients of determination equal to 0.62 and 0.36, respectively. In these treatments, the model does not represent well the beginning of the infiltration process and tends to overestimate the initial values. Since the type of soil was the same for all plots, the factor that would be determining the observed difference is related to the influence of soil cover, as well as the effect of the interception on the infiltration process. Santos et al. (2011) reported that the natural cover reduced the peaks of wetting from intense rainfalls and increased the periods of recession of moisture hydrograms, which differs from the result found by Silva & Kato (1998), who evaluated the Green-Ampt model in Brazilian Cerrado soils, with and without mulch, and concluded, as Slack (1980) did, that the predictions were compromised under bare soil conditions; however, under mulching conditions, the predictions relative to the infiltration process were good.
The model of Kostiakov also showed the lowest value of coefficient of determination, 0.72, for the condition of soil under natural cover, whereas the model of Kostiakov-Lewis showed satisfactory coefficients of determination for all studied treatments, which were above 0.88, reaching close to 1 for the condition of natural cover.
The model of Kostiakov-Lewis tended to underestimate the values of infiltration in the beginning of the process, until the time of 25 min of test, for the conditions of BDS and BC1, while the under BS conditions the values were underestimated until 50 min of test. The model of Kostiakov represented better the beginning of the process for all treatments, with values closer to the observed data, except for the BS condition, which overestimated the values of the beginning. The limitation in the Kostiakov’s model is related to long periods of test, since in this case and according to the equation, infiltration rate tends
to zero as the infiltration time becomes very long (Brandão et al., 2006).
Horton’s model did not show good representation for the conditions of bare soil, with coefficient of determination of 0.50. However, for the other soil cover conditions, the model showed good performance, which can be explained by the absence of cover on soil surface. As highlighted by Brandão et al. (2006) for Horton’s model, the reduction in infiltration over time is strongly controlled by factors of soil surface, such as surface crusting, soil swelling and shrinkage phenomena, among others, which are more expressive under conditions of bare soil.
Da Paixão et al. (2009), analyzing the performance of empirical models for the prediction of infiltration rate, compared with data obtained at the field using ring infiltrometer, observed that Horton’s was the model that showed the best results of the estimates. However, for the results found by Cunha et al. (2011), who compared the models of Kostiakov, Kostiakov-Lewis and Horton, Horton’s was the model that showed the worst performance, with coefficient of determination of 0.79 for the evaluated condition, minimum cultivation, differing from the present study, in which this model showed the worst performance only for the condition of bare soil.
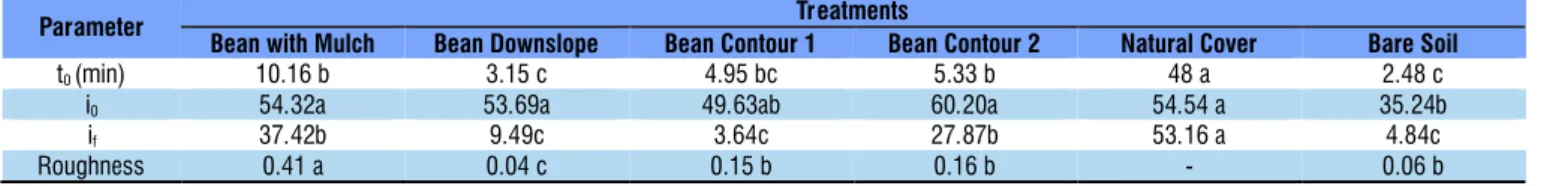
The time of beginning of surface runoff was significantly increased under the condition of natural cover, which required 50 min for the process to start, indicating the benefit of using vegetal cover on the soil to reduce surface runoff. The conditions in which soil management practices were adopted showed longer time of beginning of runoff, in comparison to the downslope treatment, which in turn did not differ significantly from the condition of bare soil (Table 3).
Soil roughness was significantly higher in the condition of cultivation with mulch, due to the presence of residues (Table 3). As the presence of residues on soil surface reduced, roughness consequently decreased. Due to the high density of the natural cover, it was not possible to evaluate the flow height; therefore, there was no calculation of roughness for this treatment. Panachuki et al. (2011), evaluating soil and water losses to estimate the final water infiltration rate in different
Table 2. Values of the parameters of the empirical models of Kostiakov, Kostiakov-Lewis, Horton and Green-Ampt
Parameters Treatments
Bean with Mulch Bean Downslope Bean Contour 1 Bean Contour 2 Natural Cover Bare Soil
Kostiakov
Α -0.207 157.89 206.25 94.52 73.64 158.96
K 93.608 -0.63 -0.95 -0.285 -0.075 -0.738
SE (%) 154.51 322.80 276.11 231.83 15.88 289.80
Kostiakov-Lewis
Α 1.1454 0.6308 0.4116 0.8055 0.4323 0.6806
K 6.3779 27.54 37.62 22.583 0.000004 16.14
if 37.42 9.49 3.64 27.87 53.16 4.84
SE (%) 28.17 43.18 33.14 39.69 2.86 27.34
Green-Ampt
θs 0.44 0.44 0.44 0.44 0.44 0.44
θi 0.24 0.24 0.24 0.24 0.24 0.24
if 37.42 9.49 3.64 27.87 53.16 4.84
SE (%) 643.99 148.21 51.60 422.52 1156.77 121.36
Horton
if 37.42 9.49 3.64 27.87 53.16 4.84
ii 54.32 53.69 49.63 60.2 54.54 35.24
T 0.006 0.021 0.028 0.009 0.001 -0.03
A. B. 0 20 40 60 80 100 120 140 160 180 200
R =0.922
R =0.622
R =0.952
R =0.982
BCM In fil tratio n( mm h -1) Observed infiltration Green Ampt Kostiakov-Lewis Horton Kostiakov 0 20 40 60 80 100 120 140 160 180 200
R = 0.962
R = 0.952
R = 0.962
R = 0.862
BDS In fil tratio n( mm h -1) Observed infiltration Green Ampt Kostiakov-Lewis Horton Kostiakov C. D. 0 20 40 60 80 100 120 140 160 180 200
R = 0.982
R = 0.972
R = 0.952
R = 0.972
BC1 In fil tratio n( mm h -1) Observed infiltration Green Ampt Kostiakov-Lewis Horton Kostiakov 0 20 40 60 80 100 120 140 160 180 200
R = 0.962
R = 0.922
R = 0.962
R = 0.982
BC2 In fil tratio n( mm h -1) Observed infiltration Green Ampt Kostiakov-Lewis Horton Kostiakov E. F.
Figure 2. Mean values of infiltration velocity observed and estimated by Kostiakov, Kostiakov-Lewis, Horton and Green-Ampt models for the treatments: (A) Bean cultivated on contour with mulch (BCM), (B) Bean cultivated downslope (BDS), (C) Bean cultivated on contour 1 (BC1), (D) Bean cultivated on contour 2 (BC2), (E) Soil under natural cover (NC) and (F) Bare soil (BS)
0 20 40 60 80 100 120 140 160 180 200
0 20 40 60 80 100
R = 0.962
R = 0.922
R = 0.962
R = 0.982
NC In fil tratio n( mm h -1) Time (min) Observed infiltration Green Ampt Kostiakov-Lewis Horton Kostiakov 0 20 40 60 80 100 120 140 160 180 200
0 20 40 60 80 100
R = 0.842
R = 0.822
R = 0.882
R = 0.52
BS In fil tratio n( mm h -1) Time (min) Observed infiltration Green Ampt Kostiakov-Lewis Horton Kostiakov
Table 3. Means of initial values of time of beginning of surface runoff (t
0), initial (i0) and final (if) values of basic infiltration and surface roughness
Parameter Treatments
Bean with Mulch Bean Downslope Bean Contour 1 Bean Contour 2 Natural Cover Bare Soil
t0(min) 10.16 b 3.15 c 4.95 bc 5.33 b 48 a 2.48 c
i0 54.32a 53.69a 49.63ab 60.20a 54.54 a 35.24b
if 37.42b 9.49c 3.64c 27.87b 53.16 a 4.84c
Roughness 0.41 a 0.04 c 0.15 b 0.16 b - 0.06 b
Means followed by lowercase letters in the same row do not differ by Tukey test at 0.05 probability level. (-) No measurement of roughness due to the absence of visible surface runoff
management systems, under simulated rainfall, observed higher soil water infiltration in the treatments with vegetal residues, due to the surface roughness, which prevented the formation of surface sealing.
The values of final infiltration are significantly higher for the condition of NC, the most preserved among the evaluated treatments (Table 2). According to Zaluski & Antoneli (2014), the type of cover on soil surface is one of the factors that
determine the process of infiltration, which is the reason why it is extremely important to maintain the vegetal cover for soil conservation, since vegetation is responsible for the increase of macroporosity in the superficial layer and soil hydraulic conductivity.
statistically, but differed from the conditions of downslope, bare soil and bean cultivated on contour associated with rock barriers spaced by 0.5 m (BC1), which showed the lowest infiltration rates. According to these results, cultivation on contour spaced by 1.0 m, between the rock barriers, is indicated for the region, because this condition showed superior values of basic infiltration rate in relation to the cultivation.
Conclusions
1. Basic infiltration rates were lower for the conditions of bare soil and bean cultivated downslope.
2. Between both tested spacings of rock barriers, the spacing of 1.0 m showed higher basic infiltration rate in comparison to 0.5 m.
3. Kostiakov-Lewis’s model showed the best fit to the data, with the lowest values of standard error.
Literature Cited
Braida, J. A.; Cassol, E. A. Relações de erosão em entressulcos com o tipo e a quantidade de resíduo vegetal na superfície do solo. Revista Brasileira de Ciência do Solo, v.23, p.711-721, 1999. Barros, C. A. P.; Minella, J. P. G.; Tassi, R.; Dalbianco, L.; Ottonelli,
A. S. Estimativa da infiltração de água no solo na escala de bacia hidrográfica. Revista Brasileira de Ciência do Solo, v.38, p.557-564, 2014. http://dx.doi.org/10.1590/S0100-06832014000200020 Brandão, V. S.; Cecílio, R. A.; Pruski, F. F.; Dilva, D. D. Infiltração da
água no solo. 3.ed. Viçosa: UFV, 2006, 120p.
Cecílio, R. A.; Martinez, M. A.; Pruski, F. F.; Silva, D. D. Modelo para estimativa da infiltração de água e perfil de umidade do solo. Revista Brasileira de Ciência do Solo, v.37, p.411-421, 2013. http:// dx.doi.org/10.1590/S0100-06832013000200012
Cunha, J. L. X. L.; Silva, C. A.; Coelho, M. E. H.; Fontes, L. O.; Silva, M. G. O.; Silva, I.N. Velocidade de infiltração da água em um Latossolo Amarelo submetido ao sistema de cultivo mínimo. Agropecuária Científica no Semi-Árido, v.7, p.3-35, 2011. Da Paixão, F. J. R.; Andrade, A. R. S.; Azevedo, C. A.V. de; Costa, T. L.;
Guerra, O. C. Ajuste da curva de infiltração por meio de diferentes modelos empíricos. Pesquisa Avançada & Agrotecnologia, v.2, p.107-112, 2009.
Davidová, T.; Dostál, T.; David, V.; Strauss, P. Determining the protective effect of agricultural cropson the soil erosion process using a field rainfall simulator. Plant Soil Environment, v.1, p.109-115, 2015.
EMBRAPA – Empresa Brasileira de Pesquisa Agropecuária. Centro Nacional de Pesquisa de Solos. Manual de métodos de análise de solo 2.ed. Rio de Janeiro: Embrapa CNPS, 1997. 212p.
EMBRAPA - Empresa Brasileira de Pesquisa Agropecuária. Sistema brasileiro de classificação de solos. Rio de Janeiro: Centro Nacional de Pesquisa de Solos, 2013. 353p.
Gonçalves, F. C.; Moraes, M. H. Porosidade e infiltração de água do solo sob diferentes sistemas de manejo. Irriga, v.17, p.337-345, 2012.
Martins Filho, M. V.; Engler, M. P. C.; Izidorio, R.; Cotrin, F. B.; Serra, E. A.; Amaral, N. S.; Souza, Z. M. Modelos para estimativa do subfator cobertura-manejo (CiII) relativo à erosão entressulcos. Engenharia Agrícola, v.24, p.603-611, 2004. http://dx.doi. org/10.1590/S0100-69162004000300012
Mirzaee, S.; Zolfaghar, A. A.; Gorji, M.; Dyck, M.; Ghorbani Dashtaki, S. Evaluation of infiltration models with different numbers of fitting parameters in different soil texture classes. Archives of Agronomy and Soil Science, v.60, p.681-693, 2014.
Montenegro, A. A. A.; Montenegro, S. M. G. L. Variabilidade espacial de classes de textura, salinidade e condutividade hidráulica de solos em planície aluvial. Revista Brasileira de Engenharia Agrícola e Ambiental, v.10, p.30-37, 2006. http://dx.doi. org/10.1590/S1415-43662006000100005
Panachuki, E.; Alves Sobrinho, T.; Vitorino, A. C. T.; Carvalho, D. F.; Urchei, M.A. Avaliação da infiltração de água no solo, em sistema de integração agricultura-pecuária, com uso de infiltrômetro de aspersão portátil. Acta Scientiarium Agronomy, v.28, p.129-137, 2006. http://dx.doi.org/10.1590/S0100-06832011000500032 Panachuki, E.; Bertol, I.; Alves Sobrinho, T.; Oliveira, P. T. S.; Sanches,
P. T.; Rodrigues, D. B. B. Perdas de solo e de água e infiltração de água em Latossolo vermelho sob sistemas de manejo. Revista Brasileira de Ciência do Solo, v.35, p.1777-1785, 2011. http:// dx.doi.org/10.1590/S0100-06832011000500032
Ries, J. B.; Marzen, M.; Iserloh, T.; Fister, W. Soil erosion in Mediterranean landscapes e Experimental investigation on crusted surfaces by means of the Portable Wind and Rainfall Simulator. Journal of Arid Environments, v.100-101, p.42-51, 2014.
Santos, M. A. N.; Panachuki, E.; Alves Sobrinho, T.; Oliveira, P. T. S.; Rodrigues, D. B. B. Water infiltration in na Ultisol after cultivation of common bean. Revista Brasileira de Ciência do Solo, v.38, p.1612-1620, 2014.
Santos, T. E. M.; Montenegro, A. A. A.; Silva, D. D. Umidade do solo no semiárido pernambucano usando-se reflectometria no domínio do tempo (TDR). Revista Brasileira de Engenharia Agrícola e Ambiental, v.15, p.670-679, 2011.
SAS Intitute. The SAS System for windows: Release version: 6.8, 3.ed. Cary: 1998. CD-Rom
Silva, C. L.; Kato, E. Avaliação de modelos para previsão da infiltração de água em solos sob cerrado. Pesquisa Agropecuária Brasileira, v.33, p.1149-1158, 1998.
Slack, D. C. Modeling infiltration under moving sprinkler irrigation systems. Transactions of the ASAE, v.23, p.596-600, 1980. Wang, C.; Mao, X.; Hatano, R. Modeling ponded infiltration in
fine textured soils with coarse interlayer. Soil Science Society of America Journal, v.78, p.745-753, 2014. http://dx.doi.org/ 10.2136/sssaj2013.12.0535
Zaluski, P.; Antoneli, V. Variabilidade na infiltração da água no solo em área de cultivo de tabaco na região Centro-Sul do Paraná. Caderno de Geografia, v.24, p.34-47, 2014.