Procedia Engineering 116 ( 2015 ) 939 – 946
1877-7058 © 2015 The Authors. Published by Elsevier Ltd. This is an open access article under the CC BY-NC-ND license (http://creativecommons.org/licenses/by-nc-nd/4.0/).
Peer- Review under responsibility of organizing committee , IIT Madras , and International Steering Committee of APAC 2015 doi: 10.1016/j.proeng.2015.08.384
ScienceDirect
8th International Conference on Asian and Pacific Coasts (APAC 2015)
Department of Ocean Engineering, IIT Madras, India.
Dredging of Vila do Conde harbor, Portugal - Contamination of
sediments
Alexandre Santos-Ferreira
a*, Elisabete Dias
a, Paula F. da Silva
b, Cláudia Santos
a,
Mónica Cabral
aaDGRM, Av. Brasília, 1449-030 Lisboa, Portugal
bDepartamento de Ciências da Terra and GeoBioTec, FCT - Universidade NOVA de Lisboa, 2829-516 Caparica, Portugal
Abstract
In Portugal, the dredging of small harbors represents the main exploitation cost for these infrastructures. These costs can significantly increase depending upon the degree of sediment contamination, as their disposal can concern an important amount of the overall costs. Therefore, a methodology for zoning the contamination areas was developed and it is summarized. This methodology was applied to the dredged material of an ancient wharf, used since the Middle Age, at Vila do Conde harbor, North of Portugal. Considering the resultant contamination zoning, for different years, an evolution analysis of the contaminated areas before and after dredging operations was carried out. This approach intended to evaluate if the contaminated areas are similar after dredging operations in order to identify the possible contamination sources and, subsequently, to eliminate them. Thus, an important part of the dredging cost may well be reduced, since the elimination, or reduction, of contamination sources in a harbor can increase the environmental beneficial use of the dredged sediments.
© 2014 The Authors. Published by Elsevier B.V.
Peer-review under responsibility of organizing committee of APAC 2015, Department of Ocean Engineering, IIT Madras.
Keywords: Dredging; sediment contamination; contamination zoning; harbor; reuse of sediments
1. Introduction
Commonly, small harbors management involves the execution of dredging operations to overcome excessive sediment accretion to the harbors' basin and channel accesses, and so to ensure proper navigability conditions.
* Corresponding author. Tel.: +351-963-898-434; fax: +351-213-035-702 E-mail address: [email protected]
© 2015 The Authors. Published by Elsevier Ltd. This is an open access article under the CC BY-NC-ND license (http://creativecommons.org/licenses/by-nc-nd/4.0/).
Although essential, these procedures represent the main exploitation cost for these infrastructures, in the Portuguese harbors management context, in which dredged materials disposal may play an important part. In fact, sediment disposal management depends upon the nature and the contamination degree of the dredged materials, since contaminated sediments implicate higher disposal precautions and costs, due to environment concerns and national laws and regulations, and clean sediments represent valuable resources, suitable to be reused for beach nourishment, long shore sediment transportation or construction purposes. Therefore, presently planning and managing of dredging operations in a sustainable approach is considered essential, both in an economic and an environmental perspectives.
In this context, a methodology, Model for Environmental Dredging Zones - MEDZ tools, was developed for zoning the contamination areas (Santos-Ferreira et al., 2014) which uses automatic geoprocessing in GIS environment to enable the integration of the environmental and geotechnical quality of the sediments for further analysis, regarding the optimization of dredging and disposal operations. MEDZ tools also assists the identification of existing contamination sources, aiming their elimination (or reduction) and the overall consequent benefits. The procedures adopted are based on the OSPAR Convention, aiming an integrated environmental management of dredging in harbor areas.
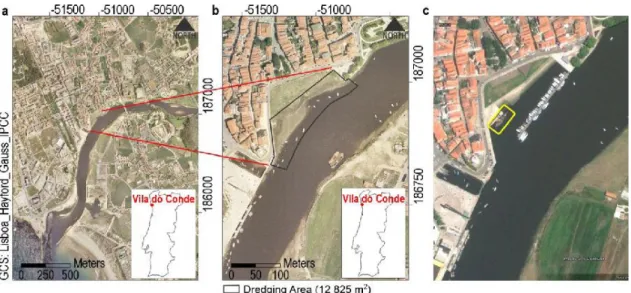
The study presented hereafter develops a multi-temporal analysis based on the application of this methodology to the dredged material of a small area, Lavandeiras wharf at Vila do Conde harbor, located in the north Atlantic coast of Portugal (Fig 1). As the area was heavily contaminated, after six centuries of use as a shipyard, it was intended, with the proposed approach, to assess the evolution of the contaminated areas before and after dredging operations in order to identify the possible contamination sources and, subsequently, to eliminate them. The detailed used methodology, the data analysis and the obtained results are also discussed.
Fig. 1. Localization of the studied area: (a) near the mouth of Ave River; (b) in 2003; (c) in 2010. 2. The Lavandeiras wharf
The study area (Fig.1a, b), located in the right bank of Ave River, in Vila do Conde’s city center, was used since the middle age as a shipyard and included also a custom facility, built next to it, to collect taxes. Although, at present, Vila do Conde’s harbor has small relevance, only operating as a traditional fishing harbor, it was quite relevant in the past and, in particular, a significant percentage of the XVth century Portuguese fleet was there
constructed.
In the last decade of the XXthcentury, a new modern shipyard was settled in the left bank of the river, and so the
installing a shipbuilding museum, using new facilities in the old shipyard area and the ancient customs building; additionally, a sailing replica of an XVthcentury Portuguese vessel, of the type that was then built in the old
shipyard, was put near the museum (Fig 1c, yellow mark).
As the whole site presented sediments with a high degree of contamination, the characterization and zoning of the area to be dredged was necessary. Therefore, in 2003, an aquatic sediment sampling and the lab testing of these samples were performed, as presented in Section 4.1.
Later, in 2010, since the Ave River has water pollution issues, before a maintenance dredging operation, a new sampling campaign and lab testing was implemented to ascertain the site conditions.
This paper aims to compare both testing sets and the inherent contamination zoning with the MEDZ tools presented in Section 3, to verify if the source of contamination, both global and as for each contaminant type, was due to the old and extended use of the area as a shipyard, or if it was related to the river upstream contamination.
3. Methodology
This case presents a model of planning and management of dredging using the automatic geoprocessing in GIS environment, that has been developed and applied to ensure a sustainable exploration of Vila do Conde’s and other harbor facilities, both in Portugal and elsewhere. The adopted procedure is based on georeferenced detailed topo-hydrographic information and physico-chemical testing methods of the sediments to identify the spatial distribution of erosion and accretion areas as well as, the existing sources of contamination (Santos-Ferreira et al., 2014).
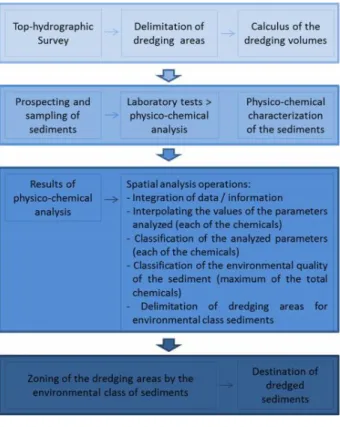
Fig. 2 MEDZ flowchart.
The analysis system developed (Fig. 2) was based on a conceptual model of morphodynamic and multi-temporal sediment analysis in harbor areas, automating the production of maps (Dias et al., 2011; Silva et al., 2011).
It includes converting between different data formats, the generation of surfaces of different particle sizes by interpolation methods of several particle size fractions, the zoning of the area under analysis and the calculation of
areas and volumes eroded and deposited sediment for each type, subdivided into four size classes - pebbles, sands, silts and clays.
This system was implemented by applying Model Builder software of ArcGIS®, ESRI, and consists of a set of tools that operate sequentially in the calculation of the various components of the model.
Thus, six modules were implemented, designated as M1 to M6, each with specific processes to obtain automatic digital maps with the programmed information, allowing:
• M1 – conversion of CAD entities in vector entities (GIS shapefile);
• M2 – development of bathymetry digital elevation models (DEM), tin or raster;
• M3 – interpolation of particle sizes distribution and contamination concentration, by a deterministic method -IDW;
• M4 – preliminary zoning of sediments of harbor areas;
• M5 – calculation of areas and volumes of erosion and accretion / dredging; • M6 – calculation of areas and volumes of dredged material.
For the present case study only some of the modules were used, namely M1, M2, M3 and M4. In this investigation, MEDZ was not implemented to study the sediments’ particle size distribution, but it was used to zone the concentration of each analyzed contaminant, and to assess the overall contamination of the sediments.
The method was applied to two sampling sets, corresponding to data gathered by the surveys in 2003 and in 2010, allowing to compare the concentration for each contaminant. In 2003, after the sampling and zoning that is presented in Section 4, the study area was dredged. As a result, the 2010 sampling was carried on recent sediments.
4. Results and discussion
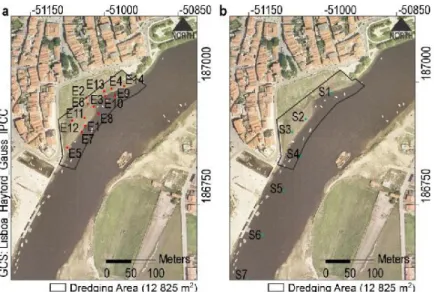
4.1. The 2003 campaign
The 2003 survey included 14 sampling points (Fig. 3a), and the lab testing of these 14 samples. In this paper, the contamination results for arsenic (As), cadmium (Cd), chromium (Cr), copper (Cu), Hexachlorobenzen (HCB), mercury (Hg), nickel (Nq), Polycyclic aromatic hydrocarbon (PAH), lead (Pb), Polychlorinated biphenyls (PCB) and zinc (Zn) are presented.
Besides the listed contaminants, the area was classified for the whole contamination, according to the Portuguese environmental regulations in five classes - Class 1, for clean material, to Class 5, for maximum contaminated material.
4.2. The 2010 campaign
The 2010 survey included only four sampling points (Fig. 3b), and the chemical testing of those four samples. In this paper, as for the 2003 campaign, the same contamination type results are presented.
4.3. Analysis of contamination distribution
The MEDZ methodology was applied to the testing results for the 2003 and 2010 campaigns and the corresponding outputs are presented in Figs. 4 to 10, coupled for each type of contaminant.
As shown in Fig.4a and b, the arsenic contamination is nearly the same - Class 2, both for the 2003 and 2010 campaigns. So, it is reasonable to consider that arsenic contamination results from river contamination, and not from the extended and uncontrolled use of the area as a shipyard. As for cadmium, Fig 4c and d, the contamination increased from Class 1 to Class 2, and so it is due to upstream contamination as well.
Fig. 4. Contamination class distribution: As - (a) 2003; (b) 2010; Cd - (c) 2003; (d) 2010
As for chromium and copper (Fig 5), there is a slight improvement from Class 3 to Class 2 for chromium in a part of the area, and, for copper at the same zone, from Class 2 and 3 to Class 1; it can be assumed that chromium and copper contamination was related to the previous use of the area as a shipyard.
For HCB (Fig 6a and b), there is a general increase in contamination level from Class 1 to Class 2, and it must be due to the increase in pollution upstream; mercury (Fig 6c and d), as copper and cadmium, presents a contamination Class 2 and 3, in 2003, in the same area, with a clear improvement to Class 1, in the whole area, in 2010. Thus mercury contamination was also due to the shipyard activities.
Fig. 6. Contamination class distribution: HCB - (a) 2003; (b) 2010; Hg - (c) 2003; (d) 2010.
Nickel (Fig. 7a and b) shows no contamination, both in 2003 and in 2010; these results suggest the shipyard did not cause nickel contamination, neither the river.
Contrariwise, PAH (Fig 7c and d) presents, in 2003, a heavy increase contamination in the whole site, from Class 3 to Class 5. The highest contamination values for this contaminant are located in the same area as the highest values for chromium, copper and mercury, in the 2003 results; in 2010, the whole area presents, for PAH, a slight Class 2 contamination level, with a very noticeable improvement.
So, for PAH, the shipyard was a major and significant contamination source; but the river contributes anyway with a minor contamination of this type, and so the entire area presents, in 2010, Class 2 contamination.
Fig. 7. Contamination class distribution: Ni - (a) 2003; (b) 2010; PAH - (c) 2003; (d) 2010.
Lead (Fig 8a and b) presents, in 2003 and in the same area as chromium, copper and mercury, a Class 3 contamination, improving in the whole area to Class 2, in 2010; this suggests the shipyard was the main contamination source for this contaminant; however, the river must carry some degree of contamination.
Reversely, in 2003, PCB (Fig. 8c and d) presents an overall contamination of Class 1 and, in 2010, presents Class 2 level. Therefore, for PCB, the shipyard had no contamination role, and the river increased its contamination, in this pollutant, from 2003 to 2010.
Fig. 8. Contamination class distribution: Pb - (a) 2003; (b) 2010; PCB - (c) 2003; (d) 2010
Fig. 9. Contamination class distribution: Zn - (a) 2003; (b) 2010.
As for zinc (Fig 9), there was a class 3 contamination in a residual area, in 2003, but the area was essentially clean - Class 1; in the 2010, all the area presents a contamination of class 2. Therefore, the shipyard was responsible for the contamination that was present in 2003, but since then the river quality decreased, and in 2010 all the area presents a contamination of Class 2.
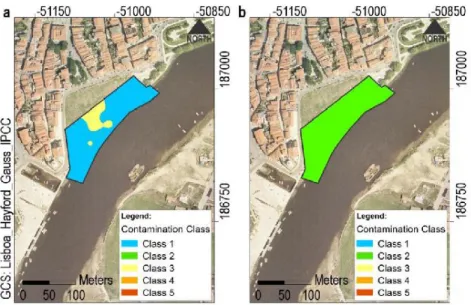
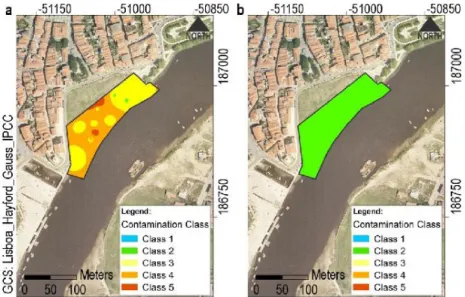
Considering the set of the overall contaminants, the results of the application of MEDZ model to the 2003 and to the 2010 sampling campaign and lab testing are presented in Fig. 10. In 2003, all the area was heavily contaminated, with classes from 3 to 5. In 2010, the whole area has a Class 2 contamination level, revealing a slight contamination.
It is now necessary to perceive the main industries located upstream that still contributes to the remaining contamination of Ave River (Class 2 of Portuguese legislation).
Fig. 10. Sediments’ global contamination class distribution: (a) 2003; (b) 2010. 5. Conclusions
As a general conclusion, it can be stated that in 2003, before the general dredging and cleaning of the area, the Lavandeiras wharf at Vila do Conde was heavily contaminated, mainly due to its use as a shipyard for more than six centuries. Anyway, the developed analysis suggests that Ave River also carries some contamination, mainly zinc, PCB, lead, PAH, HCB, chromium, cadmium and arsenic, due to upstream pollution points.
The results presented before demonstrate the applicability of the methodology implemented currently at all dredging operations in the Portuguese small harbors, allowing not only to identify the improvement of the environmental characteristics of the sediments, but also the potential source of the different pollutants occurring in the area. This approach allows to follow a positive evolution of the contaminated areas through the identification of the possible contamination sources and, subsequently, their mitigation and to ensure that future dredging operations costs may well be reduced, as the volume of non-contaminated sediments, in each dredging operation, may become maximized, allowing to reuse them for beach nourishment or longshore sediment transport, since some parts of the Portuguese coast in the vicinity of Vila do Conde Harbor are subject to high erosion rates. Therefore, it is possible to pursue a path where most of the volume of dredge sediments is less contaminated, in each new dredging operation.
Acknowledgements
The authors wish to thank DGRM for the permission to use the data presented in this paper. Paula Silva work was supported by UID/GEO/04035/2013
References
Dias, E., Santos-Ferreira, A., Carneiro, E., Silva, A.P.F.da, 2011. Planeamento e gestão de dragagens no estuário do Ave: geoprocessamento automático considerando a distribuição de contaminantes. Proceedings 6º Congresso Planeamento e Gestão de Zonas Costeiras de Países de expressão portuguesa, 13 pp (in Portuguese).
Santos-Ferreira, A., Silva, A.P.F.da, Dias, E., 2014. Harbor geotechnics: the case of the Portuguese small Harborharbors. In Application of Nanotechnology in Pavements, Geological Disasters, and Foundation Settlement Control Technology, GSP 244, pp. 78-85 © ASCE 2014. Silva, A.P.F.da, Santos-Ferreira, A., Dias, E., 2011. Análise multitemporal e morfodinâmica no estuário do Arade com geoprocessamento