234
BASE TEMPERATURE AND THERMAL TIME OF DEVELOPMENTAL SUBPERIODS IN SUNFLOWER
Ivan Carlos Maldaner1, Arno Bernardo Heldwein2, Mateus Possebon Bortoluzzi2, Evandro Zanini
Righi2, Dionéia Daiane Pitol Lucas3, Luis Henrique Loose4, Fernando Dill Hinnah5
1Instituto Federal Farroupilha – Campus São Vicente do Sul. E-mail: ivan_maldaner@yahoo.com.br
2Universidade Federal de Santa Maria. E-mail: heldweinab@smail.ufsm.br; mateusbortoluzzi@hotmail.com; ezrighi@yahoo.com.br
3Secretaria da Agricultura e Pecuária do Estado do Rio Grande do Sul – Palmeira das Missões. E-mail: dio.pitol@gmail.com
4Instituto Federal Farroupilha – Campus Santo Ângelo. E-mail: luishloose@gmail.com 5Universidade de São Paulo – ESALQ. E-mail: fhinnah@usp.br
ABSTRACT
The objective of this study was to determine the base temperature and the thermal time of developmental subperiods of three sunflower genotypes. The experiments were carried out during the agricultural years of 2007/08 to 2009/10 in Santa Maria, in the state of Rio Grande do Sul, Brazil. The experimental design was randomized blocks with four replications, using three genotypes (Aguará 03, Embrapa 122, and Hélio 358) and different sowing dates. The phenological stages were determined every three days in four plants per plot. The base temperature was estimated by the methods of least standard deviation, coefficient of variation, regression coefficient, and X intercept. The daily thermal time was calculated by three methods. The mean base temperature for the subperiod emergence – beginning of anthesis was 3.9, 9.7, and 5.8 °C for genotypes Aguará 03, Embrapa 122, and Hélio 358, respectively. Except for the reproductive subperiods, the thermal time calculated by the method 3 results in a lower coefficient of variation when compared to calendar days.
Keywords: Helianthus annuus L., phenology, degree days, cardinal temperatures
TEMPERATURA BASE E SOMA TÉRMICA DE SUBPERÍODOS DE DESENVOLVIMENTO DO GIRASSOL
RESUMO
Objetivou-se nesse trabalho determinar a temperatura base e a soma térmica de subperíodos de desenvolvimento de três genótipos de girassol. Os experimentos foram conduzidos nos anos agrícolas
235 de 2007/08 a 2009/10 em Santa Maria, no estado do Rio Grande do Sul, Brasil, em um delineamento experimental de blocos ao acaso, utilizando três genótipos (Aguará 03, Embrapa 122, e Hélio 358) e diferentes datas de semeadura, com quatro repetições. Os estágios fenológicos foram determinados a cada três dias em quatro plantas por parcela. A temperatura base foi estimada pelos métodos do menor desvio padrão, coeficiente de variação, coeficiente de regressão e X intercepto. A soma térmica diária foi calculada por três métodos. A temperatura base média para o subperíodo emergência – início da antese foi de 3,9, 9,7 e 5,8 ºC para os genótipos Aguará 03, Embrapa 122 e Hélio 358, respectivamente. Exceto para os subperíodos reprodutivos, a soma térmica calculada pelo método 3 resulta em menor coeficiente de variação em relação aos dias do calendário civil.
Palavras-chave: Helianthus annuus L., fenologia, graus-dia, temperaturas cardinais
INTRODUCTION
The meteorological elements that most affect the sunflower growth and development under potential water availability conditions are air temperature and solar radiation (MASSIGNAM & ANGELOCCI, 1993; SENTELHAS et al., 1994). Among them, air temperature is the one that most interferes in the sunflower cycle duration, since most of the cultivars are photoperiod-insensitive (UNGARO et al., 2009).
Among the cardinal temperatures, the base temperature (Tb) is usually determined by statistical methods based on data of phenological observations and air temperature. In this case, the Tb is the one that results in a lower variation of the accumulated degree-days for a given developmental subperiod (YANG et al., 1995). The most used statistical methods for Tb determination are the coefficient of variation (days, degree-days), regression coefficient, standard deviation (days, degree-days), and intersection of abscissae (ARNOLD, 1959; YANG et al., 1995).
The Tb varies depending on species, genotype, and developmental subperiod of the plants (STRECK et al., 2003, 2007). For sunflower, Massignam & Angelocci (1993) obtained Tb for the emergence-anthesis subperiod varying from 2 to 10°C, depending on the method of determination and genotype. Sentelhas et al. (1994) observed Tb varying from 3.7 to 4.7ºC for the entire sunflower cycle, depending on the genotype utilized.
The Tb assumes great importance when used in the calculation of the thermal time, with degree-days unit (ºC day), which is an excellent way to evaluate the effect of temperature on plant
236
development (GILMORE & ROGERS, 1958), definition of sowing dates and cultivars (LUZ et al., 2012), and a tool for use in mathematical models (LUCAS et al., 2015). However, McMaster & Wilhelm (1997) reported that the form of calculation of the thermal time is usually not described in the studies or is used differently by the authors.
The sunflower development cycle can be divided into the subperiods sowing to emergence (S-EM), emergence to visible miniature floral head (EM-R1), visible miniature floral head to beginning of anthesis (R1-R5.1), beginning to end of anthesis (R5.1-R6), and end of anthesis to physiological maturity (R6-R9) (UNGARO et al., 2009). The quantification of the thermal time required to reach each of these developmental stages is a parameter of extreme relevance for the farmers aiming at planning the agricultural practices and can be carried out through mathematical models. Moreover, the quantification of the thermal time was performed by Paula et al. (2005) for potato and by Streck et al. (2007) for rice.
Thus, due to the variation of Tb between genotypes and estimation methods and the existence of new sunflower hybrids in the Brazilian market, it is necessary to study the Tb for these genotypes. Furthermore, the calculation of the thermal time is also important to estimate the occurrence date of the developmental stages of sunflower. This information is still not available for the central region of Rio Grande do Sul state, Brazil.
The objective of this study was to determine the base temperature and the thermal time of developmental subperiods of three sunflower genotypes, using different calculation methodologies.
MATERIAL AND METHODS
The experiments were performed during the agricultural years from 2007/08 to 2009/10 in Santa Maria, central region of Rio Grande do Sul, southern Brazil (29°43’23” S, 53°43’15” W; 95 m). According to the Köppen’s climate classification, the climate of the region is Cfa, subtropical humid with hot summers and no dry season defined (HELDWEIN et al., 2009).
The sowing procedures were carried out in 31/Jul, 30/Aug, 02/Oct, 06/Nov, 06/Dec, 07/Jan, and 08/Feb for the 2007/08 agricultural year, meanwhile in 08/Aug, 03/Sep, 02 /Oct, 06/Nov, 05/Jan, and 13/Feb for the 2008/09 agricultural year. Moreover, the sowing dates were 31/Aug, 05/Oct, 10/Nov, 04/Dec, 08/Jan, and 29/Jan for the 2009/10 agricultural year. These sowing dates were selected aiming at comprising the entire period recommended for sowing sunflower in the central region of Rio Grande
237 do Sul, which is from August 11 to February 10 (MAPA, 2018), and provide plant development in different temperature conditions.
The genotypes used were single-cross hybrids Aguará 03 and Hélio 358 with middle-cycle and the open-pollinated variety Embrapa 122 with early-cycle. The open-pollinated variety was sown only in the first agricultural year (2007/08). All plots from the genotype Embrapa 122 sown on 08/Feb/2008 and from the genotype Hélio 358 sown on 05/Jan/2009 and 31/Aug/2009 were lost. The experimental design was randomized blocks with four replications for each genotype. The plot size was 5.0 x 4.5 m, spaced by 0.90 m between rows and 0.25 m between plants in the row.
Phenological observations were performed every three days in four plants per plot, being observed the dates of sowing (S), emergence (EM), visible miniature floral head (R1), beginning of anthesis (R5.1), end of anthesis (R6), and physiological maturity (R9) based on the criteria described by Schneiter & Miller (1981).
Data of daily minimum and maximum air temperature and flux density of the incident global solar radiation (Rg) during the experimental period were collected at the Main Climatological Station of the 8th DISME/INMET, located approximately 100 meters from the experimental area.
The Tb was estimated according to the calculation methods proposed by Arnold (1959), which are the least standard deviation in growing degrees-day (SDgdd), least standard deviation in days (SDday), coefficient of variation in growing degrees-day (CVgdd), coefficient of variation in days (CVday), regression coefficient (RC), and X intercept (X-int), presented respectively in Eqs. 1, 2, 3, 4, 5, and 6. The methods SDgdd, SDday, CVgdd, and RC with the modifications proposed by Yang et al. (1995) were also utilized according to Eqs. 7, 8, 9, and 10.
238 2 1 1 2 1 ) (
n MGDD GDD SD n i i gdd (1) b day day T T SD SD (2) % 100 d gdd gdd X SD CV (3) % 100 . d day day X SD CV (4) i i a bT GDD (5) i bT a r Tb a b (6)
n i n i i i n i i i n i i i n i i b d n d T d n d d T T 1 1 2 2 1 2 1 1 ) ( (7)
n i n i n i i i i i i n i i i i n i i b d d t t d n d t n d T T T 1 1 1 2 1 2 2 2 1 ) ( (8)
n i n i n i n i i i i i i i n i n i i i i n i i i i n i i b d t d d t d d T d d t d T T 1 1 1 1 2 2 1 1 2 2 1 2 1 (9)
n i n i n i i i i i n i i i n i i i n i i b t d n T d T d n T d T T 1 1 1 1 2 1 1 (10)239 Where:
SDgdd – standard deviation, in growing degree-days;
GDDi - growing degree-days, accumulated in the subperiod of the i-th sowing date;
MGDD - mean value of the growing degree-days accumulated in the subperiod, obtained from the mean of all the GDDi;
n – number of sowings;
SDday – standard deviation, in days;
T – mean temperature of the subperiod (°C); Tb - base temperature (°C);
CVgdd – coefficient of variation, in growing degree-days; CVday - coefficient of variation, in days;
X d – mean duration of the subperiod, in days; “a” and “b” – parameters of the equation;
Ti - mean temperature of the subperiod of the i-th sowing date (°C);
r - development rate of the subperiod of the i-th sowing date;
di - number of days required to complete the subperiod of the i-th sowing; ti - T - Ti (°C).
After calculating the base temperature (Tb) for the subperiods of the genotypes Aguará 03, Embrapa 122, and Hélio 358, the Tb obtained in the subperiod EM-R5.1 were used in the calculation of the thermal time. Moreover, Topt = 27 °C and Tmax = 34 °C were used for all genotypes (FAGUNDES et al., 2007).
The mean temperature (Tmean) was determined by the arithmetic mean between the minimum and maximum daily air temperatures and the daily thermal time (DTT, in ºC.day) was calculated by three methods (GILMORE & ROGERS, 1958), according to Eqs. 11, 12, and 13. The accumulated thermal time (ATT, in °C.day) was calculated by the sum of the DTT.
240
T T
dayDTT mean b 1 (11)
wherein if Tmean<Tb, then Tmean=Tb
T T
dayDTT mean b 1 (12)
wherein if Tmean<Tb, then Tmean=Tb and if Tmean>Topt, then Tmean=Topt
T T
dayDTT mean b 1 (13)
when Tb<Tmean≤Topt
T T
T T
T T
dayDTT opt b max mean / max opt 1
when Topt<Tmean≤Tmax
Wherein:
Tmean (°C) – mean temperature; Tb(°C) - base temperature;
Topt (°C) – optimum temperature; Tmax (°C) – maximum temperature.
The mean of the values obtained by the different calculation methods was performed in order to determine the Tb of each genotype. Mean duration of the five developmental subperiods and total sunflower cycle, in number of days and thermal time, as well as standard deviation (SD) and coefficient of variation (CV) were calculated, being this a statistical tool utilized to measure the variability of the duration, in days or ºC day of the developmental subperiods of cultivars sown at different dates (JEFFERIES & MACKERRON, 1987; PAULA et al., 2005).
RESULTS AND DISCUSSION
The Tb values estimated by the Arnold (1959) methods and modified by Yang et al. (1995) were similar within each genotype (Table 1). However, the SDgdd method estimated greater Tb values for the three genotypes, differing considerably from the other methods. Similar results were also observed for other crops, such as snap bean, cowpea, and sweet corn (YANG et al., 1995), maize (ANDRADE et al., 2005), and rice (LAGO et al., 2009). According to Yang et al. (1995), these differences are attributed to the Tb estimation calculation procedure of this method in relation to the others.
241 Table 1. Values of base temperature (ºC) for the subperiods emergence – visible miniature floral head (EM-R1), emergence – beginning of anthesis (EM-R5.1), beginning of anthesis – physiological maturity (R5.1-R9), visible miniature floral head - physiological maturity (R1-R9), and emergence - physiological maturity (EM-R9) of the sunflower cultivars Aguará 03, Embrapa 122, and Hélio 358 estimated by the methods proposed by Arnold (1959) and by the methods modified by Yang et al. (1995) in Santa Maria, Rio Grande do Sul 2010.
Genotype Subperiod Methods proposed by Arnold Methods modified by Yang Mean
SDgdd SDday CVgdd CVday RC X-int SDgdd SDday CVgdd RC
Aguará 03 EM-R1 6.5 4.5 4.5 4.5 5.0 5.2 8.5 5.4 2.4 5.4 5.2 EM-R5.1 5.0 3.5 3.5 3.5 4.0 3.8 4.9 3.6 3.5 3.7 3.9 R5.1-R9 20* <0* <0* <0* 20* >20* >20* <0* <0* 20* - R1-R9 20* <0* <0* <0* 20* >20* >20* <0* >20* <0* - EM-R9 20* <0* <0* <0* 20* 1.45 12.5 2.5 2.4 2.0 4.2 Embrapa 122 EM-R1 11.5 10.5 10.5 10.5 11 10.5 11.2 10.6 10.6 10.4 10.7 EM-R5.1 9.5 9.5 9.5 9.5 10.0 9.6 9.9 9.8 9.7 9.7 9.7 R5.1-R9 <0* <0* <0* <0* <0* >20* >20* <0* <0* <0* - R1-R9 >20* <0* <0* <0* <0* 15.1 19.3* 12.1 <0* <0* 13.6 EM-R9 >20* 8.0 8.0 8.0 9.0 9.2 10.8 8.0 8.0 8.6 8.6 Hélio 358 EM-R1 9.5 6.0 6.0 6.0 6.5 6.5 9.2 6.2 6.0 9.5 6.8 EM-R5.1 8.0 5.0 5.0 5.0 5.5 5.6 8.0 5.2 5.1 5.4 5.8 R5.1-R9 >20* <0* <0* <0* <0* >20* >20* <0* <0* 20* - R1-R9 >20* <0* <0* <0* 20* <0* >20* 18* >20* 20* - EM-R9 >20* <0* <0* <0* <0* 4.2 13.9 <0* <0* 20* 9.1
SDgdd = Method of the least standard deviation in growing degree days; SDday = Method of the least standard deviation in days; CVgdd = Method of the coefficient of variation in growing degree days; CVday = Method of the coefficient of variation in days; RC = Method of the regression coefficient, and X-int. = Method of X-intercept. *Values not used to calculate the mean
Estimated Tb values lower than 0 ºC or higher than 20 ºC were presented respectively as <0 ºC and >20 ºC. These values were not considered for the mean calculation of the methods because they were not biologically realistic for sunflower, as they differ from values observed in the literature that vary from 2 to 10 ºC (MASSIGNAM & ANGELOCCI, 1993; UNGARO et al., 2009), depending on genotype, developmental stage, and method of calculation (MASSIGNAM & ANGELOCCI, 1993; SENTELHAS et al., 1994).
For the genotypes Aguará 03 and Hélio 358, these values were verified in the subperiods R1-R5.1, R1-R9, and R5.1-R9 in all the analyzed methods. Considering the Embrapa 122 genotype, estimated Tb values were <0 ºC or >20 ºC for the majority of the methods, with the exception of the methods X-intercept and SDdays for the subperiod R1-R9 and X-intercept for the subperiod R5.1-R9.
242
These biologically meaningless Tb values occurred due to the low association between the mean air temperature and the subperiod R5.1-R9 duration, presenting a determination coefficient (R2) of 0.02, unlike to what was observed for the subperiod EM-R5.1 (R2 = 0.93). These results agree with Andrade et al. (2005), where statistically determined Tb will be more accurate or close to the physiological value of Tb when there is a high correlation between the air temperature and the subperiod duration.
A similar result was reported by Massignam & Angelocci (1993), using three sunflower varieties at different locations. These authors obtained negative base temperatures for the final subperiod of anthesis - harvest, along with a low association between air temperature and this subperiod duration.
The mean of the Tb estimated by the different methods, excluding the values ≤0 ºC and ≥20 ºC, was used due to the differences between the estimated Tb. According to Andrade et al. (2005) and Lago et al. (2009), the probable explanation for obtaining different Tb values by the methods, mainly the Tb values estimated by the SDgdd method, refers to the statistical methods present in their constitution only the variables air temperature and subperiod duration. These methods are based on the linearity of the growing degree-days method, which is not always realistic from the biological point of view (STRECK et al., 2003, 2007).
Tb values ranged from 2.4 to 8.5 °C depending on the Tb estimation method, with a mean value of 5.2 °C for the genotype Aguará 03 in the subperiod EM-R1. For the genotype Hélio 358, the Tb values ranged from 6.0 to 9.5 °C between the different methods, with a mean of 6.8 °C. For the genotype Embrapa 122, the Tb values ranged from 10.4 to 11.5 °C, with a mean of 10.7 °C (Table 1). The highest Tb values of the genotype Embrapa 122 may have been obtained because it is an open pollinated variety and presents early-cycle, while the other two hybrids present middle-cycle.
The Tb mean of the different estimation methods was respectively of 3.9, 9.7, and 6.8 ºC for the genotypes Aguará 03, Embrapa 122, and Hélio 358 in the Tb estimation for the subperiod EM-R5.1 (Table 1). These values are close to those found by Hammer et al. (1982) with two sunflower cultivars in Australia (Tb = 6.6 °C) and by Massignam & Angelocci (1993) that obtained Tb of 8 to 10 °C.
The developmental subperiods duration for the hybrid Aguará 03 is presented in Figure 1, considering that there was no loss of sowing dates for this genotype. For the central region of Rio Grande do Sul, sowing dates from August to December can be considered as "first cropping season" and from January to February as "second cropping season". Thus, a tendency to decrease the cycle duration in sowings performed in the second cropping season in relation to the first cropping season
243 can be verified. In the first cropping season, the highest cycle durations were verified in the sowing dates 31/Jul/2007, 08/Aug/2008, and 31/Aug/2009, totaling respectively 126, 129, and 127 days. Meanwhile, in the second cropping season the cycle duration ranged from 89 to 101 days (Figure 1A).
When time was counted in thermal time, the longest developmental cycle durations (°C day) were of 2,291 °C day at sowing date 11/Feb/2009 calculated by method 1 (Figure 1B), and 2,240 and 2,184 °C day at sowing date 10/Oct/2008 calculated respectively by methods 2 and 3 (Figure 2C, D). Meanwhile, the lowest cycle duration occurred at sowing date 08/Feb/2008 with values of 1,654, 1,651, and 1,644 ºC day calculated respectively by methods 1, 2, and 3.
Variation of 4 to 15 days was observed regarding the duration of the subperiod S-EM, evidencing the great influence of the external factors on the germination process. Moreover, this amplitude was also verified when considering the duration in thermal time, where the smallest and the greatest duration were respectively 79 and 246 °C day.
The duration of the subperiod EM-R1 between the sowing dates ranged from 60 days on 31/Jul/2007 to 29 days on 05/Jan/2009. This reduction occurred due to lower air temperature in the months of August and September, corroborating with Ungaro et al. (2009), which stated that low temperatures in this subperiod increase the crop cycle, delaying flowering and physiological maturity. The highest thermal time in the subperiod EM-R1 was verified on 30/Aug/2007, calculated by methods 1, 2, and 3 (928 ºC day). The shortest duration occurred on 05/Jan/2009, being of 551, 548, and 540 ºC calculated respectively by methods 1, 2, and 3.
244
Figure 1. Duration of developmental subperiods sowing – emergence (S-EM), emergence - visible miniature floral head (EM-R1), visible miniature floral head - beginning of anthesis (R1-R5.1), beginning of anthesis – end of anthesis (R5.1-R6), and end of anthesis - physiological maturity (R6-R9) of the sunflower genotype Aguará 03 in different sowing dates in calendar days (A) and in accumulated thermal time calculated by the methods 1(B), 2(C), and 3(D) in Santa Maria, RS. 2010.
S o w in g da te s Calendar days 0 20 40 60 80 100 120 140 S-EM EM-R1 R1-R5.1 R5.1-R6 R6-R9
Accumulated thermal time (º C dia)
0 400 800 1200 1600 2000 2400
Accumulated thermal time (º C dia)
0 400 800 1200 1600 2000 2400 S o w in g da te s
Accumulated thermal time (º C dia)
0 400 800 1200 1600 2000 2400 A. B. C. D. 06/Nov/07 31/Jul/07 02/Oct/07 30/Aug/07 08/Aug/08 06/Dez/07 08/Feb/08 07/Jan/08 05/Jan/09 03/Set/08 06/Nov/08 02/Oct/08 05/Oct/09 03/Aug/09 13/Feb/09 08/Jan/10 04/Dez/09 10/Nov/09 29/Jan/10 06/Nov/07 31/Jul/07 02/Oct/07 30/Aug/07 08/Aug/08 06/Dez/07 08/Feb/08 07/Jan/08 05/Jan/09 03/Set/08 06/Nov/08 02/Oct/08 05/Oct/09 03/Aug/09 13/Feb/09 08/Jan/10 04/Dez/09 10/Nov/09 29/Jan/10
245 Small variation in the duration of the subperiod R1-R5.1 was observed between sowing dates. For all methods, the greatest and the shortest duration of this subperiod were verified in the sowing dates of 09/Sep/2008 and 08/Jan/2010 with 529, 526, and 515 ºC day and 383, 380, and 370 ºC day, obtained respectively by the methods 1, 2, and 3. In calendar days, a difference of only five days was verified between the shortest and the greatest duration, which were 18 (08/Jan/2010) and 23 days (05/Oct/2009).
According to Ungaro et al. (2009), the subperiod R5.1-R6 lasts approximately ten days with a mean air temperature of 20 °C. Similar values were verified in this research, varying between five (04/Dec/2009) and 11 days (30/Aug/2007). In terms of ATT, the longest duration occurred on 02/Oct/2007, when 234, 232, and 225 ºC days were obtained and the lowest duration on 04/Dec/2009, with a duration of 121, 104, and 48 ºC day respectively for the methods 1, 2, and 3.
Sowing performed on 02/Oct/2008 presented the longest duration of the R6-R9 subperiod in calendar days (35 days) and in thermal time, totaling 726, 724, and 718 ºC day respectively for the methods 1, 2, and 3. Similarly, the shortest duration occurred on 06/Dec/2007, obtaining 16 days and 334 ºC day in all used methods. Thus, this subperiod presented the greatest variation between sowing dates and caused the high variation of cycle duration in °C day observed in this study. This probably occurred due to the duration of this subperiod be influenced by other factors besides the air temperature. In addition, small errors may be embeded into the exact moment determination of the R9 stage under field conditions.
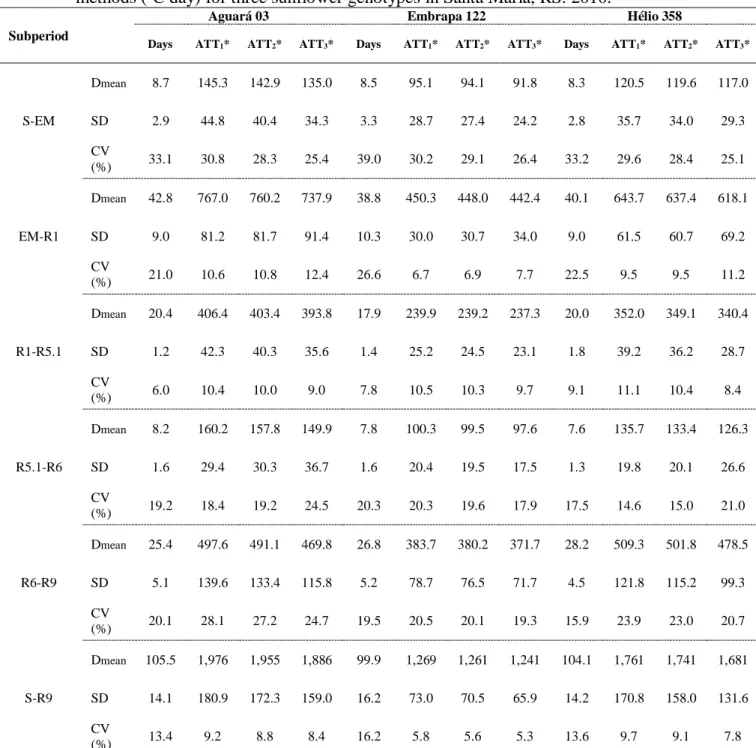
Considering the subperiods S-EM, EM-R1, and the entire crop cycle (S-R9), the CV was higher when the time was expressed in calendar days than in thermal time (Table 2), which agrees with Gilmore & Rogers (1958); Jefferies & Mackerron (1987). These authors claimed that the thermal time is a better biological time measure in plants than calendar days or days after sowing.
246
Table 2. Mean duration (Dmean), standard deviation (SD), and coefficient of variation (CV) of the subperiods sowing – emergence (S-EM), emergence - visible miniature floral head (EM-R1), visible miniature floral head - beginning of anthesis (R1-R5.1), beginning of anthesis – end of anthesis (R5.1-R6), and end of anthesis - physiological maturity (R6-R9), and sowing - physiological maturity (S-R9) in calendar days (Days) and calculated by the different methods (ºC day) for three sunflower genotypes in Santa Maria, RS. 2010.
Subperiod
Aguará 03 Embrapa 122 Hélio 358
Days ATT1* ATT2* ATT3* Days ATT1* ATT2* ATT3* Days ATT1* ATT2* ATT3*
S-EM Dmean 8.7 145.3 142.9 135.0 8.5 95.1 94.1 91.8 8.3 120.5 119.6 117.0 SD 2.9 44.8 40.4 34.3 3.3 28.7 27.4 24.2 2.8 35.7 34.0 29.3 CV (%) 33.1 30.8 28.3 25.4 39.0 30.2 29.1 26.4 33.2 29.6 28.4 25.1 EM-R1 Dmean 42.8 767.0 760.2 737.9 38.8 450.3 448.0 442.4 40.1 643.7 637.4 618.1 SD 9.0 81.2 81.7 91.4 10.3 30.0 30.7 34.0 9.0 61.5 60.7 69.2 CV (%) 21.0 10.6 10.8 12.4 26.6 6.7 6.9 7.7 22.5 9.5 9.5 11.2 R1-R5.1 Dmean 20.4 406.4 403.4 393.8 17.9 239.9 239.2 237.3 20.0 352.0 349.1 340.4 SD 1.2 42.3 40.3 35.6 1.4 25.2 24.5 23.1 1.8 39.2 36.2 28.7 CV (%) 6.0 10.4 10.0 9.0 7.8 10.5 10.3 9.7 9.1 11.1 10.4 8.4 R5.1-R6 Dmean 8.2 160.2 157.8 149.9 7.8 100.3 99.5 97.6 7.6 135.7 133.4 126.3 SD 1.6 29.4 30.3 36.7 1.6 20.4 19.5 17.5 1.3 19.8 20.1 26.6 CV (%) 19.2 18.4 19.2 24.5 20.3 20.3 19.6 17.9 17.5 14.6 15.0 21.0 R6-R9 Dmean 25.4 497.6 491.1 469.8 26.8 383.7 380.2 371.7 28.2 509.3 501.8 478.5 SD 5.1 139.6 133.4 115.8 5.2 78.7 76.5 71.7 4.5 121.8 115.2 99.3 CV (%) 20.1 28.1 27.2 24.7 19.5 20.5 20.1 19.3 15.9 23.9 23.0 20.7 S-R9 Dmean 105.5 1,976 1,955 1,886 99.9 1,269 1,261 1,241 104.1 1,761 1,741 1,681 SD 14.1 180.9 172.3 159.0 16.2 73.0 70.5 65.9 14.2 170.8 158.0 131.6 CV (%) 13.4 9.2 8.8 8.4 16.2 5.8 5.6 5.3 13.6 9.7 9.1 7.8 *ATT1 – accumulated thermal time by the method 1 (ºC day); ATT2 – accumulated thermal time by the method 2 (ºC day); ATT3 –
247 The calendar days presented lower CV in the subperiods involving the sunflower reproductive phase, R1-R5.1, R5.1-R6, R6-R9, which occurred due to low association of air temperature with duration of these subperiods, as discussed above.
The mean duration of the subperiods (ºC day) decreased from method 1 to method 3 in the three genotypes (Table 2). This decrease occurred because the Tmean was superior to Topt over several days during the developmental cycle, which caused a decrease in ATT by method 3 when compared to other methods (STRECK et al., 2007). There are also reports of differences between calculation methods for other species such as wheat, potato, rice, and watermelon (MCMASTER & SMIKA, 1988; PAULA et al., 2005; STRECK et al., 2007; TRENTIN et al., 2008).
The method 3 presented superior performance, resulting in the lowest CV (Table 2), which ponders the plant cardinal temperatures during its development. The mean of required thermal time calculated by this method for the development cycle and subperiods of the genotypes Aguará 03, Embrapa 122, and Hélio 358 was respectively of 1,886, 1,241, and 1,681 ºC day to reach the physiological maturity.
Based on these results, the thermal time calculation is necessary for each region and genotype under study, mainly in numerical calculations where the crop growth and development are simulated.
CONCLUSION
The mean of base temperature (Tb) estimated by the methods for the subperiod EM-R5.1 is 3.9, 9.7, and 5.8 °C respectively for the genotypes Aguará 03, Embrapa 122, and Hélio 358. There is no significant correlation between air temperature and subperiod duration for the subperiod R5.1-R9, resulting in biologically meaningless Tb values.
The duration of sunflower developmental subperiods varies according to sowing date, genotypes, and methods of calculation of the thermal time. The thermal time calculated by method 3 results in a lower coefficient of variation for the subperiods S-EM, EM-R1, and S-R9, which was not verified for the reproductive subperiods.
ACKNOWLEDGEMENTS
The authors are thankful to the National Council for Scientific and Technological Development (CNPq) and the Coordination for the Improvement of Higher Education Personnel (CAPES) for granting the scholarships respectively of research productivity and doctorate degree.
248
REFERENCES
ANDRADE, R. G.; SEDIYAMA, G. C.; ZOLNIER, S.; COSTA, L. C. 2005. Avaliação de métodos para estimativa da temperatura-base para as culturas de milho (Zea mays L.) e feijão (Phaseolus vulgaris L.). Revista Brasileira de Agrometeorologia, Santa Maria, v. 13, n. 3, p. 316-325.
Available at:
https://www.researchgate.net/profile/Ricardo_Andrade6/publication/251450759_Avaliao_de_mtodo s_para_estimativa_da_temperatura_base_inferior_para_as_culturas_de_milho_e_feijo/links/0c9605 1f91abf9916e000000.pdf
ARNOLD, C. Y. 1959. The determination and significance of the base temperature in a linear heat unit system. Journal of the American Society for Horticultural Science, Geneva, v. 74, n. 1, p. 430-445.
FAGUNDES, J. D.; SANTIAGO, G.; MELLO, A. M. de; BELLÉ, R. A.; STRECK, N. A. 2007. Crescimento, desenvolvimento e retardamento da senescência foliar em girassol de vaso (Helianthus annuus L.): Fontes e doses de nitrogênio. Ciência Rural, Santa Maria, v. 37, n. 4, p. 987-993. Available at: http://www.scielo.br/pdf/cr/v37n4/a11v37n4.pdf
GILMORE, E. C. JR.; ROGERS, J. S. 1958. Heat units as a method of measuring maturity in corn. Agronomy Journal, Madison, v. 50, n. 10, p. 611-615. Available at: https://dl.sciencesocieties.org/publications/aj/abstracts/50/10/AJ0500100611?access=0&view=pdf HAMMER, G. L., GOYNE, P. J.; WOODRUFF, D. R. 1982. Phenology of sunflower cultivars. III.
Models for prediction in field environments. Australian Journal of Agricultural Research, Melbourne, v. 33, n. 2, p. 263-274. Available at: http://www.publish.csiro.au/paper/AR9820263.htm HELDWEIN, A. B.; BURIOL, G. A.; STRECK, N. A. 2009. O Clima de Santa Maria. Revista Ciência
& Ambiente, Santa Maria, v. 38, p. 43-58.
JEFFERIES, R. A.; MACKERRON, D. K. L. 1987. Thermal time as a non-destructive method of estimating tuber initiation in potatoes. Journal of Agricultural Science, Cambridge, v. 108, n. 1, p. 249-252. Available at:
http://journals.cambridge.org/action/displayAbstract?fromPage=online&aid=4781300&fileId=S002 1859600064339
LAGO, I.; STRECK, N. A.; CARVALHO, M. P. DE; FAGUNDES, L. K.; PAULA, G. M. de; LOPES, S. J. 2009. Estimativa da temperatura base do subperíodo emergência - diferenciação da panícula em arroz cultivado e arroz vermelho. Revista Ceres, Viçosa, v. 56, n. 3, p. 288-295. Available at: http://www.ceres.ufv.br/ojs/index.php/ceres/article/view/3418/1325
LUCAS, D. D. P.; HELDWEIN, A. B.; HINNAH, F. D.; MALDANER, I. C.; LOOSE, L. H. 2015. Estimation of leaf area index in the sunflower as a function of thermal time. Revista Ciência
Agronômica, Fortaleza, v. 46, n. 2, p. 404-411. Available at:
http://www.ccarevista.ufc.br/seer/index.php/ccarevista/article/view/2713/1187
LUZ, G. L.; MEDEIROS, S. L. P.; TOMM, G. O.; BIALOZOR, A.; AMARAL, A. D. do; PIVOTO, D. 2012. Temperatura base inferior e ciclo de híbridos de canola. Ciência Rural, Santa Maria, v. 42, n. 9, p. 1549-1555. Available at: http://www.scielo.br/pdf/cr/v42n9/a25812cr5433.pdf
MAPA - Ministério da Agricultura, Pecuária e Abastecimento. Girassol para o Estado do Rio Grande do Sul, ano safra 2018/19. Available at: http://www.agricultura.gov.br/assuntos/riscos-seguro/risco-agropecuario/portarias/safra-vigente/rio-grande-do-sul. Acess in: 26 December, 2018. MASSIGNAM, A. M.; ANGELOCCI, L. R. 1993. Determinação da temperatura- base e de graus-dia
na estimativa da duração dos subperíodos de desenvolvimento de três cultivares de girassol. Revista Brasileira de Agrometeorologia, Santa Maria, v. 1, n. 1, p.71-79.
249 MCMASTER, G. S.; SMIKA, D. E. 1988. Estimation and evaluation of winter wheat phenology in the central Great Plains. Agricultural and Forest Meteorology, Amsterdam v. 43, n. 1, p. 1-18. Available at: http://www.sciencedirect.com/science/article/pii/0168192388900020
MCMASTER, G. S.; WILHELM, W. W. 1997. Growing degree-days: one equation, two interpretations. Agricultural and Forest Meteorology, Amsterdam, v. 87, n. 4, p. 291-300.
Available at:
http://digitalcommons.unl.edu/cgi/viewcontent.cgi?article=1086&context=usdaarsfacpub
PAULA, F. L. M.; STRECK, N. A.; HELDWEIN, A. B.; BISOGNIN, D. A.; PAULA, A. L.; DELLAI, J. 2005. Soma térmica de algumas fases do ciclo de desenvolvimento da batata (Solanum tuberosum
L.). Ciência Rural, Santa Maria, v. 35, n. 5, p. 1034-1042. Available at:
http://www.scielo.br/pdf/cr/v35n5/a08v35n5.pdf
SCHNEITER, A. A., MILLER, J. F. 1981. Description of sunflower growth stages. Crop Science,
Madison, v. 21, n. 6, p. 901-903. Available at:
https://dl.sciencesocieties.org/publications/cs/abstracts/21/6/CS0210060901?access=0&view=pdf SENTELHAS, P. C. NOGUEIRA, S. dos S. S.; JÚNIOR, M. J. P.; SANTOS, R. R. dos. 1994.
Temperatura-base e graus-dia para cultivares de girassol. Revista Brasileira de Agrometeorologia, Santa Maria, v. 2, n. 1, p. 43-49.
STRECK, N. A.; WEISS, A.; XUE, Q.; BAEZINGER, P. S. 2003. Improving predictions of developmental stages in winter wheat: a modified Wang and Engel model. Agricultural and Forest Meteorology, Amsterdam. v. 115, n. 3-4, p. 139-150. Available at: http://www.sciencedirect.com/science/article/pii/S0168192302002289
STRECK, N. A.; TIBOLA, T.; LAGO, I.; BURIOL, G. A.; HELDWEIN, A. B.; SCHNEIDER, F. M.; ZAGO, V. 2007. Soma térmica de algumas fases do ciclo de desenvolvimento da escala de COUNCE para cultivares Sul-Brasileiras de arroz irrigado. Bragantia, Campinas, v. 66, n. 2, p. 357-364. Available at: http://www.scielo.br/pdf/brag/v66n2/20.pdf
TRENTIN, R.; SCHREIBER, F.; STRECK, N. A.; BURIOL, G. A. 2008. Soma térmica de subperíodos do desenvolvimento da planta de melancia. Ciência Rural, Santa Maria, v. 38, n. 9, p. 2464-2470. Available at: http://www.scielo.br/pdf/cr/v38n9/a16cr243.pdf
UNGARO, M. R. G.; CASTRO, C. DE; FARIAS, J. R. B.; BARNI, A. N.; RAMOS, N. P.; SENTELHAS, P. C. 2009. Girassol. In: MONTEIRO, J. E. B. A., Ed. Agrometeorologia dos cultivos – o fator meteorológico na produção agrícola. Brasília: INMET, p. 205-221.
YANG, S.; LOGAN, J.; COFFEY, D. L. 1995. Mathematical formulae for calculating the base temperature for growing degree days. Agricultural and Forest Meteorology, Amsterdam, v. 74, n. 1-2, p. 61-74.
Received in: June 25, 2016 Accepted in: May 18, 2018