Daniel Filipe Martins
Mestrado em Engenharia Física
40 K Neon Liquid Energy Storage Unit
Dissertação para obtenção do Grau de Doutor em
Engenharia Física
Orientador: Prof. Doutor Grégoire Bonfait, Associate
Professor, Universidade Nova de Lisboa
Co-orientador: Prof. Doutora Isabel Catarino,
Assistant Professor,Universidade Nova de Lisboa
Júri:
Presidente: Prof. Doutora Maria Adelaide de Jesus Arguentes: Doutor Johan Bremer
Eng. Thierry Tirolien
Vogais: Prof. Doutor António Joaquim Rosa Amorim Barbosa Prof. Doutor Manuel Leite de Almeida
Prof. Doutor Grégoire Marie Jean Bonfait Prof. Doutora Maria Isabel Simões Catarino
© Daniel Filipe Martins; FCT/UNL;UNL
A Faculdade de Ciências e Tecnologia e a Universidade Nova
de Lisboa têm o direito, perpétuo e sem limites geográficos
,
de arquivar e publicar esta dissertação através de exemplares
impressos reproduzidos em papel ou de forma digital, ou por
qualquer outro meio conhecido ou que venha a ser inventado
,
e de a divulgar através de repositórios científicos e de admitir
a sua cópia e distribuição com objectivos educacional ou de
investigação não comerciais
,
desde que seja dado crédito ao
Acknowledgments
I would like to thank Prof. Grégoire Bonfait and Prof. Isabel Catarino for their commitment and availability throughout the course of this work and for all the opportunities they provided me since 2007. They have largely expanded my horizons both professionally and at a personal level. It has been a pleasure to work with them.
I extend my gratitude to my colleagues of the Laboratory of Cryogenics, Josiana Afonso, Luís Ribeiro, João Franco and Patricia Borges de Sousa, for their constant availability in the development of this work. My sincere thanks goes also to João Faustino due to his assistance during the development and manufacturing phases.
I also thank Prof. Carla Machado, Prof. Alberto Martinho and Prof. Pámies Teixeira (Mechanical and Industrial Engineering Department of FCT-UNL) and Dr. Lionel Duband (INAC-CEA Grenoble) for their technical advices.
To my friends Paulo Ferreira and César Soares, I would like to thank for all the help and the friendship. They have always been helping and encouraging.
For her support, patience and help during this important phase of my life, a special thank goes to my girlfriend, Ines Afonso.
To my parents, I would like to express my gratitude for all they have done, tirelessly, to help me achieving my goals. Without them, none of this would be possible.
I also thank Fundação para a Ciência e a Tecnologia for the SFRH/BD/70427/2010 scholarship and the Physics Department of Faculty of Sciences and Technology and CEFITEC.
- This work was partially supported by: Fundação para a Ciência e Tecnologia: PTDC/EME-MFE/66533/2006; PTDC/EME-MFE/101448/2008; PEst-OE/FIS/UI0068/2012-2014); - FCT-Embaixada de França — Programa Pessoa 2011/2012. Estabilizadores de
Abstract
Cryocoolers have been progressively replacing the use of the stored cryogens in cryogenic chains used for detector cooling, thanks to their higher and higher reliability. However, the mechanical vibrations, the electromagnetic interferences and the temperature fluctuations inherent to their functioning could reduce the sensor’s sensitivity. In order to minimize this problem, compact thermal energy storage units (ESU) are studied, devices able to store thermal energy without significant temperature increase. These devices can be used as a temporary cold source making it possible to turn the cryocooler OFF providing a proper environment for the sensor. A heat switch is responsible for the thermal decoupling of the ESU from the cryocooler’s temperature that increases when turned OFF.
In this work, several prototypes working around 40 K were designed, built and characterized. They consist in a low temperature cell that contains the liquid neon connected to an expansion volume at room temperature for gas storage during the liquid evaporation phase. To turn this system insensitive to the gravity direction, the liquid is retained in the low temperature cell by capillary effect in a porous material.
Thanks to pressure regulation of the liquid neon bath, 900 J were stored at 40K. The higher latent heat of the liquid and the inexistence of triple point transitions at 40 K turn the pressure control during the evaporation a versatile and compact alternative to an ESU working at the triple point transitions.
A quite compact second prototype ESU directly connected to the cryocooler cold finger was tested as a temperature stabilizer. This device was able to stabilize the cryocooler temperature ((≈ 40K ±1 K) despite sudden heat bursts corresponding to twice the cooling power of the cryocooler.
Resumo
Os criorrefrigeradores, maquinas térmicas cada vez mais fiáveis e compactas, têm vindo gradualmente a substituir os sólidos e líquidos criogénicos nas cadeias criogénicas utilizadas para arrefecer detectores. No entanto, factores como as vibrações mecânicas, interferências electromagnéticas e as flutuações de temperatura inerentes ao funcionamento dos criorrefrigeradores podem reduzir a sensibilidade do sensor. Para minimizar estes problemas, neste trabalho são estudadas unidades de armazenamento de energia térmica (ESU) dispositivos capazes de armazenar calor sem grande aumento de temperatura. Estes dispositivos tornam-se assim fonte fria temporária que permitem desligar o criorrefrigerador criando as condições mais adequadas para o funcionamento do sensor. Para proteger o ESU do aumento da temperatura do criorrefrigerador, quando este é desligado, é utilizado um interruptor térmico..
Este trabalho envolveu o dimensionamento, construção e caracterização de vários protótipos de unidades de armazenamento de energia baseado no calor latente do néon liquido para operar acerca de 40 K. Estes dispositivos consistem numa célula a baixa temperatura, com néon líquido, conectada a um volume de expansão para armazenar o gás durante a evaporação deste líquido. Para tornar estes sistemas insensíveis à direção da gravidade, o líquido é retido dentro da célula por um material poroso.
Através do controlo da pressão na célula de baixa temperatura, foi possível armazenar 900 J a 40K. A inexistência de pontos triplos nesta zona de temperatura e o elevado calor latente do líquido torna este tipo de dispositivo uma alternativa, mais compacta, ao uso das transições de ponto triplo.
Foi ainda desenvolvido um estabilizador de temperatura que consiste num pequeno ESU diretamente conectado ao dedo frio do criorrefrigerador. Este dispositivo mostrou ser capaz de manter uma temperatura estável (≈ 40K ±1 K) apesar de picos repentinos de potência correspondendo ao dobro da potência frigorífica do criorrefrigerador.
Contents
Acknowledgments ... V Abstract ... VII Resumo ... IX Contents ... XI List of Figures ... XIII List of tables ... XXI List of Symbols ... XXIII
Introduction ... 1
1 The use of cryocoolers ... 5
1.1
Cooling below 50 K ... 6
1.2
Storing thermal energy below 50 K ... 7
1.2.1
Sensible heat energy storage ... 9
1.2.2
Phase change materials ... 13
1.2.3
Storing solution at 40 K ... 20
2 Liquid neon energy storage unit ... 23
2.1
Working principle ... 23
2.2
Thermal model ... 28
2.2.1
Calculation of the energy stored entre T e T+DT in the ESU drift mode ... 28
2.2.2
Practical application ... 31
2.3
Expansion volume ... 34
2.4
Liquid confinement ... 38
2.5
Pre-‐dimensioning tool ... 41
3 Experimental setup ... 47
3.1
Cryocooler ... 47
3.2
Cell sizing ... 48
3.2.1
Multipurpose cell ... 48
3.2.2
Copper cell ... 53
3.2.3
Power booster cell ... 55
3.3
Gas gap heat switch ... 57
3.3.1
Conduction model ... 58
3.3.2
Thermal characterization of GGHS ... 60
3.4
Gravity insensitive system ... 62
3.4.1
Orientable stand ... 62
3.4.2
Tilting structure ... 63
3.4.3
Porous materials ... 69
3.5
Pressure drop ... 76
3.6
Pressure control valve ... 78
3.7.1
System overall dimensions ... 83
4 ESU Experimental Results ... 85
4.1
Temperature drift mode ... 85
4.2
Temperature controlled mode ... 91
4.3
Gravity insensitive system ... 94
4.4
Cooling process ... 99
4.5
ESU cycle ... 100
4.6
Power booster mode ... 102
4.7
Summary ... 113
4.7.1
Initial liquid lost ... 114
4.7.2
Temperature split ... 119
5 Conclusion ... 123
References ... 127
Appendices ... 131
Appendix A: Fastening elements – Aluminium cell ... 131
Appendix B: Resonant frequency calculation of the cryocooler structure ... 134
Appendix C: Multipurpose cell ... 137
Appendix D: Copper cell ... 139
Appendix E: Booster cell ... 141
Annexes ... 143
Annex 1: P-‐T diagram of nitrogen. ... 143
Annex 2: PT diagram of neon ... 144
Annex 3: T-‐H diagram of neon. ... 144
Annex 4: Latent heat of neon ... 145
List of Figures
Figure 1-1 - a) Sunpower M77B Stirlling cryocooler used on the RHESSI radiator structure[3]; b) NGST TES pulse tube cryocooler[3]; c) The Turbo- Brayton cryocooler in preparation for installation on Hubble Space Telescope[3]. ... 6
Figure 1-2 – Coaxial Large Pulse Tube[22]. ... 7
Figure 1-3 - A schematic integration of an energy storage unit (ESU) in a cryocooler for: a) “vibrationless configuration”; b) cooling power booster. In both cases the sensor is coupled to the ESU. Adapted from [9]. ... 8
Figure 1-4 – ESU operation with a variable heating profile, adapted from[13]. ... 8
Figure 1-5 – Specific heat of the Gd2O2S (GOS) and lead compared to the copper and stainless steel[24]. ... 9
Figure 1-6 – General scheme of the ESU [8]. A “Sensor Platform” to maintain a constant temperature during the ESU-mode is used. ... 10
Figure 1-7 – Temperature variations during three cycles with ESU GOS. The platform temperature was maintained stable at 6 K during 2.5h (adapted from [7]). ... 11
Figure 1-8 – Schematic drawing of the annex place of the ice water. Adapted from [25]. ... 12
Figure 1-9 – P-T (a) and T-H (b) phase diagrams of a pure substance; Three phase changes are represented in both diagrams. ... 13
Figure 1-10 - Single- and dual-volume CTSU (cryogenic thermal storage unit) designs; Some advantages and disadvantages of each design. Adapted from [4]. ... 15
Figure 1-11 - a) Schematic view of a cryocooler system and TSU; b) picture of the TSU with the copper disks and the blocks of porous materials[18]. ... 16
Figure 1-12 - Scheme of the nitrogen liquid ESU set-up (a) and of timing operation (b)[9]. ... 17
Figure 1-13 - Typical temperature drifts for an ESU mode (1W applied), using 6 L expansion volume[9]. ... 18
Figure 1-14 – Temperature control at 77.1 K using a 24 liter expansion volume, with filling pressure of 1.25 bar. 0.5 W of applied power in the ESU ... 18
Figure 1-15 - solid cooler design concepts[4] ... 19
Figure 1-16 – a) Conceptual Diagram of the 35 K dual-volume cryogenic thermal storage unit; b) Design of the 35 K CTSU –HX details; c) The 2 drilled-hole aluminium halves of the heat exchanger; adapted from [26] ... 20
Figure 1-17 - latent heat for phase transitions below 100 K; the lines represent the liquid – gas transition; the circles are the triple-points; the solid-solid transitions are represented by the squared symbols. ... 21
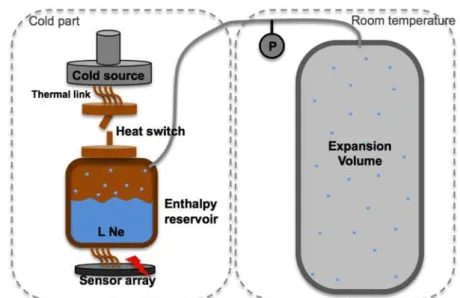
Figure 2-1 - Scheme of the liquid neon energy storage unit as Temperature drift mode ESU. ... 24
Figure 2-3 - Scheme of the liquid neon energy storage unit as Temperature controlled mode ESU. The same configuration at the cold part of the Temperature drift mode ESU is used in this controlled mode (Figure 2-1). ... 25
Figure 2-4 – Representation of the evolution of the pressure and temperature of the ESU during the different phases of Temperature controlled mode. ... 26
Figure 2-5 - Scheme of the liquid neon energy storage unit as Power booster mode ESU. In this case the enthalpy reservoir is directly connected to the cold finger of the cryocooler. ... 27
Figure 2-6 - Schematic of the evolution of the pressure and temperature when a heat profile is applied. The green line represents the temperature of the ESU, the cryocooler and the sensor array. ... 28
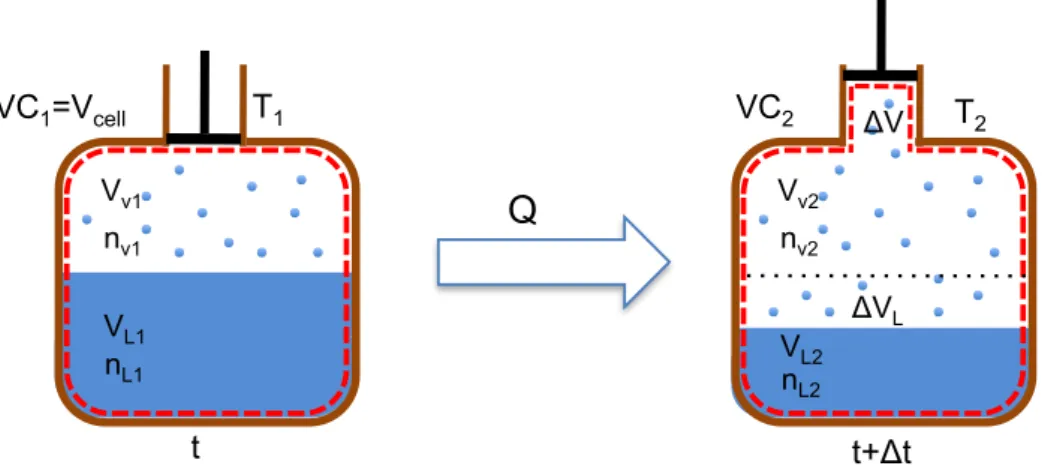
Figure 2-7 – Control Volume evolution in the enthalpy reservoir during the evaporation. ... 29
Figure 2-8 - The 2 phases of the modelling of the ESU temperature controlled mode. ... 32
Figure 2-9 – Control volume evolution in the enthalpy reservoir during the evaporation at constant temperature/pressure. ... 32
Figure 2-10 – Upper plot: (dP/dT)sat along the saturation line as a function of the temperature for neon, oxygen and the nitrogen. Middle plot: latent heat of these three fluids as function of the temperature. Bottom plot: energy stored per temperature drift and per litre of the expansion volume.36
Figure 2-11 – Predicted pre-cooling temperature as function of the expansion volume capacity to store 1000 J between the pre-cooling temperature and 40 K using the neon in the T drift mode and T controlled mode. ... 37
Figure 2-12 - Electronic microscope image of Procelite 160 (UNL/FCT/CENIMAT). The red scale represents 200 µm. ... 38
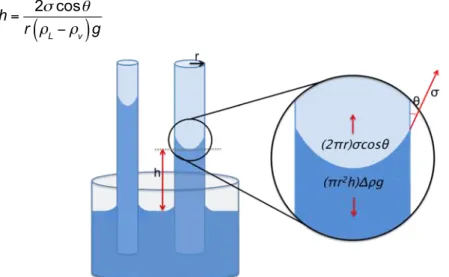
Figure 2-13 –Scheme of the capillarity effect in two capillary tubes with different diameters. ... 39
Figure 2-14 - Determination of the capillarity height in capillary tubes with 60 µm of diameter for both neon and nitrogen using the Jurin’s law. ... 40
Figure 2-15 – Determination of the capillarity height in tubes with different diameters for neon. ... 40
Figure 2-16 – Graphical user interface of the pre-dimensioning software developed to simulate the ESU pre-cooling process, the temperature drift mode and the temperature controlled mode. This is a typical simulation of the pre-cooling using a constant temperature of the cryocooler. ... 41
Figure 2-17 – Graphical user interface of the software developed to simulate the ESU booster mode. The simulation using a variable heat load profile is possible, by uploading the heat load profile as a txt file format. ... 42
Figure 2-18 - Example of the pre-dimensioning tool result of the cooling process (left) and temperature drift mode (right). In the simulation of the cooling process, the cryocooler cooling capacity is taken into account to simulate its temperature. ... 43
Figure 2-19 - Example of the pre-dimensioning tool result of the temperature controlled mode at 40 K. ... 44
Figure 3-1 – Drawing of the different stages of the cryocooler assembly. 1 – cryocooler as purchased; 2 – cryocooler with the instrumentations skirt and two half flanges to support the 50 K thermal radiation shield; 3 –thermal radiation shield; 4 – vacuum shroud. ... 47
Figure 3-2 - Ultimate stress for some materials[35]. (1) Aluminium 2024 – T4; (2) copper-beryllium; (3) “K Monel”; (4) titanium; (5) stainless steel; (6) Carbon steel C1020; (7) Steel- Ni 9%; (8) Teflon. ... 49
Figure 3-3 - The two different stresses in the cylindrical walls: 1 – a tensile stress; 2 – radial pressure. ... 49
Figure 3-4 - minimum thickness of cylindrical walls to avoid any plastic deformation when subjected to 50 bar. The mass is estimated with the minimum thickness for the 5 different materials. The mass of the cell is estimated by considering the minimum thickness and two lids (bottom and top) with the same calculated thickness. ... 50
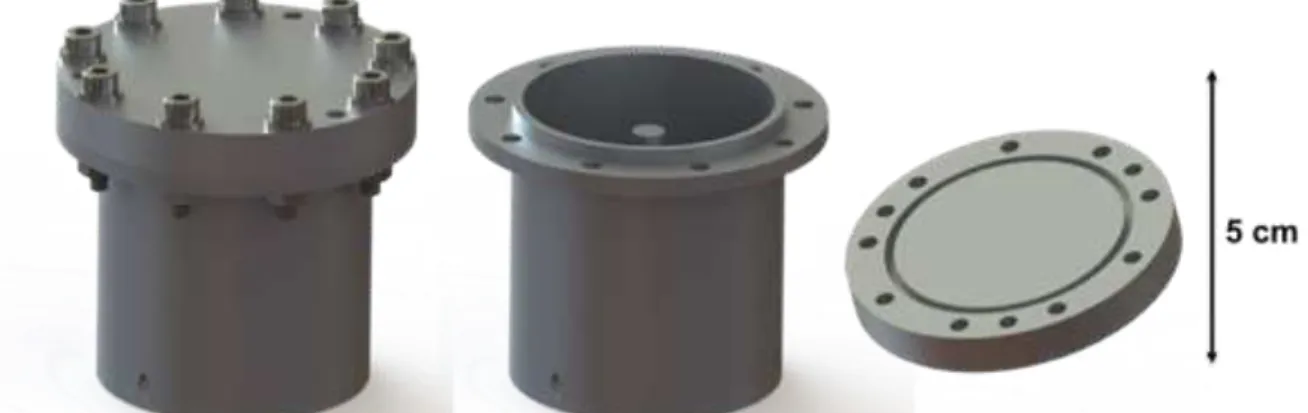
Figure 3-5 – Tri-dimensional design of the multipurpose cell. An O-ring indium wire is used to the cell sealing. The cylindrical walls and lid thickness are 1.5 mm and 7 mm, respectively. Total weight is 100 g. ... 51
Figure 3-6 –Finite element analysis results: von Mises diagram and displacement in Y axis. The cell was pressurized with 50 bar and the initial tightening of 450 N.mm was considered in this simulation. Results obtained with COSMOS®. ... 52
Figure 3-7 - Tri-dimensional design of the copper cell and respective screw cap. A soldering alloy is used to seal the cell along the marked zone. The cylindrical walls and the lid thickness are 2mm and 4.5 mm respectively. The capacity of the cell is 35 cm3. The thread pitch is 1 mm over 10 mm ... 53
Figure 3-8 - Finite elements analysis results for the copper cell: von Mises diagram and displacement in Y axis. The cell was pressurized with 50 bar. The thread was not considered in this simulation. Results obtained with COSMOS®. The yield strength of the copper is ≈ 70 MPa. ... 54
Figure 3-9 - scheme of the thread. The parameters used in the thread sizing. ... 54
Figure 3-10 - Tri-dimensional design of the “power booster cell”. The inner volume of the cell is 12cm3. The cylindrical walls and the lid thickness are 2mm and 4.5 mm respectively. The copper heat exchanger is composed by 10 circular plates (35 mm diameter and 300 µm of). ... 55
Figure 3-11 - Finite elements analysis results obtained with COSMOS® for the copper cell: displacement in Y axis and von Mises diagram for a pressurized with 50 bar cell. (The yield strength of the copper is ≈ 70 MPa). ... 56
Figure 3-12 - scheme of a cylindrical gas gap heat switch[43] ... 57
Figure 3-13 – Gas gap heat switch with leaves. The very thin stainless steel support shell encloses the gas inside the device and sustains the 2 blocks. ... 58
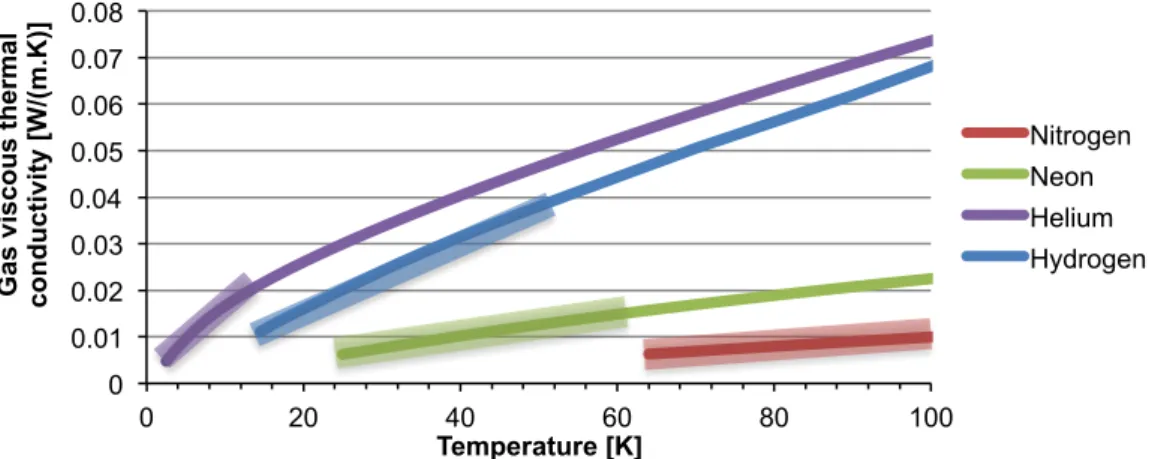
Figure 3-14 – Gas viscous thermal conductivity. The shaded zones represent the workable temperature ranges for this device with each gas. ... 59
Figure 3-16 - H2 characterization of the GGHS conductance with leaves for different filling pressures and 45 mg of the “charcoal B”. The base temperature is 25 K. The dashed curves correspond to the
analytical results. ... 61
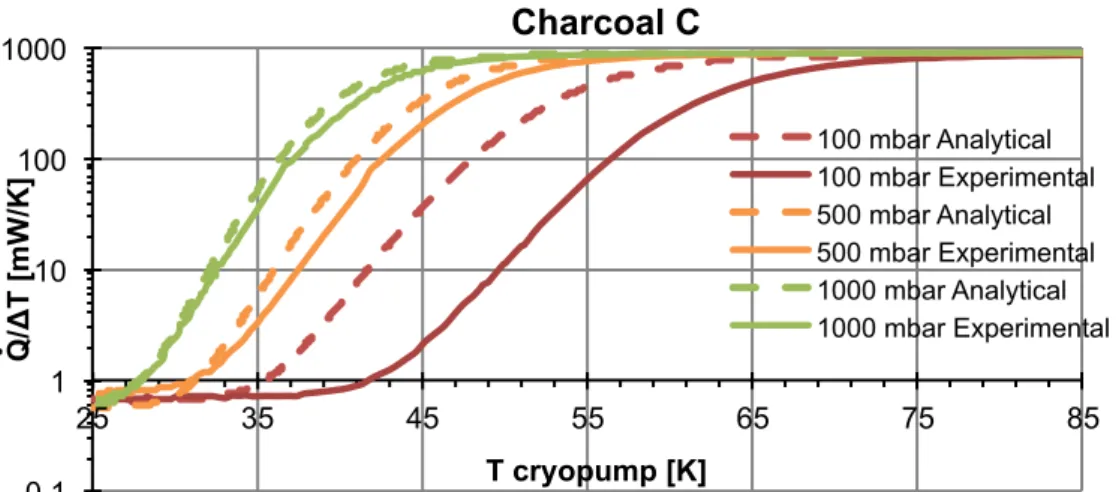
Figure 3-17 - H2 characterization of the GGHS conductance with leaves for different filling pressures 45 mg of the “charcoal C”. The base temperature is 25 K. ... 62
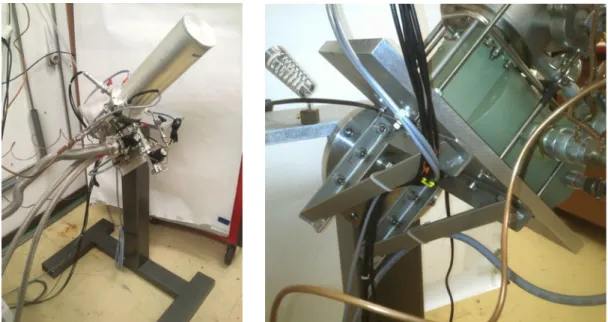
Figure 3-18 – Overall view of the rotating stand and close-up of the rotating part. ... 63
Figure 3-19 - Scheme of the assembly of the gas gap heat switch and the cell in the cold finger of the cryocooler at the horizontal position. ... 64
Figure 3-20 – Tridimensional drawing of structure to allow the mechanical decoupling of the heat switch from the cold finger of the cryocooler. ... 64
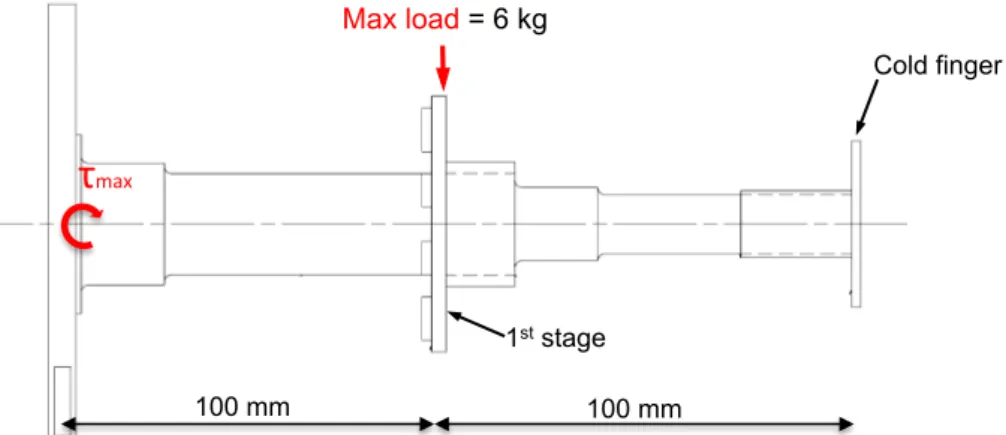
Figure 3-21 - Cryocooler manufacture requirements about the load in each stage. ... 65
Figure 3-22 - Amplified deformation result of the displacement in y axis due to the gravity. The maximum displacement is 0.14 mm. The result was obtained in COSMOS®. ... 66
Figure 3-23 - Picture of the accelerometer placed on the top of the structure. Plot of the acceleration dumping after the small blow on the top of the structure. ... 66
Figure 3-24 - Fast Fourier Transform of the oscillation damping. The main frequency is 23.4 Hz. ... 67
Figure 3-25 –Representation of the structure thermal design using thermal resistances. ... 68
Figure 3-26 - Copper thermal strap. The two thermal straps coupled in the gas gap heat switch. ... 69
Figure 3-27 - Scheme of the experimental apparatus to test the porous materials. ... 70
Figure 3-28 – Picture of the copper cell used to test the capability of the porous materials to confine the liquid inside of the cell. In this configuration the lid is placed on the bottom of the cell and the tube is connected in the centre of the lid. ... 70
Figure 3-29 - Typical experiment to detect if any liquid exits through the capillary tube using the ceramic P160. Was used a 24 l expansion volume. The initial pressure is 2 bar of neon and the control temperature is 30 K. The heat power applied was 0.5 W. ... 72
Figure 3-30 – Wicking height as function of the temperature for neon using the ceramic P160. ... 72
Figure 3-31 - Wicking height as a function of the temperature for helium using the ceramic P160. The same 60 µm found for the experiments with neon still match with the experimental results using helium. ... 73
Figure 3-32 - Wicking height as function of the temperature for helium using the ceramic P502. The mean pore size of 20 µm match with the experimental results. ... 73
Figure 3-33 - Experimental apparatus to test the capability of the filter paper to confine the liquid neon inside of the cell at 40 K. ... 74
Figure 3-34 - Wicking height as function of the temperature for neon using the ceramic P502 in 27 - 42 K range. ... 75
Figure 3-36 - Scheme of the connection between the cell and the expansion volume. Inside of the cryocooler a thin capillary tube with length L. The pressure is measured in the tube outside of the cryocooler (room temperature). ... 77
Figure 3-37 - Pressure drop as function of the applied heat loads. Difference of temperature between the measured and real temperature inside of the cell due to the pressure drop for different heat loads applied. ... 78
Figure 3-38 – Flow coefficient as function of the difference of pressure in the two sides of the valve during the control at 40 K. ... 79
Figure 3-39 - Pressure control valve “Series 9 valve” of Parker®. Maximum operating pressure is 80 bar. The flow coefficient is Kv=0.005. ... 79
Figure 3-40 - Structural support to enable the tilting of the "cold part" components. ... 80
Figure 3-41 – Configuration of the ESU power booster mode. The cell is directly connected to the cold finger of the cryocooler. ... 81
Figure 3-42 - Experimental assembly at room temperature used to test the different ESU modes. .... 82
Figure 3-43 - Labview® interface to monitor the pressures and temperatures and control the heaters. ... 82
Figure 4-1 - Configurations used to test the temperature drift mode. A - without the use of porous material, the capillary tube is connected on the top of the cell. B- using porous material, the capillary tube is connected at the bottom of the cell. ... 85
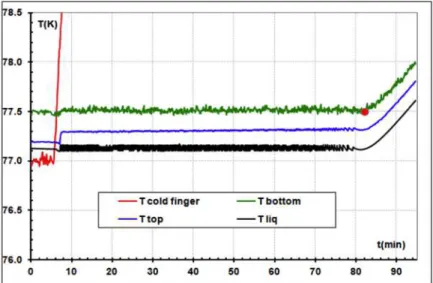
Figure 4-2 - Experimental result of the ESU drift mode (Configuration A). The temperatures are presented in the left scale. The right scale indicates the liquid percentage inside of the cell. The placement of the thermometers is indicated in Figure 4-1. The Tswitch represents the temperature of the cell in the switch side, as shown in Figure 4-1. ... 86
Figure 4-3 - ESU drift mode using the porous material. The temperatures are presented in the left axis. In the right axis is the liquid per cent (dark blue line). The thermal decoupling between the cell and the liquid/vapor temperature (Tvap) occurs when the liquid% is ≈ 20 %. ... 88
Figure 4-4 - Copper cell tested in the ESU drift mode. The filling percentage is 97 %. The temperature split (thermal decouple between the cell and the liquid) occurs when the liquid % is ≈ 20 bar. ... 89
Figure 4-5 - ESU drift mode with a filled percentage of 90 %. Even with lower filled amount, the firsts 6 % of liquid were lost. The temperature split between the Rcell and the Tvap occur when the liquid amount is around 20 %. ... 90
Figure 4-6 - Temperature controlled mode at 40 K. Upper - Pressures in the cell and in the expansion volume. Lower - Temperatures of the cold part of the system. The temperature drift occurred when the liquid amount was ≈ 20 % of the total void volume of the cell. ... 92
Figure 4-7 – ESU mode at controlled temperature at 38 K, 40 K and 43 K. The three experiments started with the cell full of liquid. ... 93
Figure 4-8 - Variable heat load profile in a controlled temperature mode at 40 K. ... 94
Figure 4-10 - ESU temperature drift mode in the 180º orientation. The temperature split occurs when the liquid amount is ≈ 18 %. ... 95
Figure 4-11 - Comparison between the temperature drift mode in the opposite orientations, 0º and 180º. ... 96
Figure 4-12 - ESU controlled temperature ESU mode at 40 K in the 180º configuration. ... 97
Figure 4-13 - Different orientations ESU temperature controlled mode at 40 K. The initial liquid amount is 100 % of the void volume of the cell. ... 97
Figure 4-14 - Energy stored (at constant temperature) as function of the cryocooler orientation. The results are presented for two cases of initial filling: 100 % and 90 %. ... 98
Figure 4-15 – Initial liquid lost amount in the case of the initial liquid cell filling of 76 %, applying 1 W of heat power. ... 98
Figure 4-16 - Cooling phase of the ESU with the temperature of the cryocooler controlled at 37 K. The placement of the thermometers is available in the scheme of Figure 4-9. ... 99
Figure 4-17 - Temperatures and pressures variations during two complete cycles: In the first plot the ESU temperatures are presented; In the second is the temperature of the cryopump; The third plot represents the pressures of the cell and of the expansion volume. ... 101
Figure 4-18 – ESU power booster mode configuration. A 50Ω/50 W heater was embedded in the cell bottom. In this mode a heat exchanger was used inside of the cell. No porous material was used. A 6 litres expansion volume was used. ... 102
Figure 4-19 – Experimental result of the ESU Power booster mode. The heat load applied was 9 W and the cryocooler capacity is ≈ 4 W. ... 102
Figure 4-20 - Experimental results of the influence of use the ESU as power booster in the cryocooler. The heat load used was 9 W. The test using the ESU is the same presented in Figure 4-19. ... 103
Figure 4-21 - Scheme and picture of the heat exchanger used to measure the temperature of the vapor. The length of the capillary tube coiled is 30 cm to ensure the thermalization (difference < 1 K) between the coil and the vapor in the case of the maximum gas flow. ... 105
Figure 4-22 – Temperatures of the ESU and of the coil during the cooling phase. ... 106
Figure 4-23 – Test of the ESU with the cryocooler in permanent working using a heat power of 11.5 W. Prediction of the coil's temperature (Model) in this case of the neon evaporation its measured temperature (Coil). ... 107
Figure 4-24 - Heat load profile applied in the ESU. The cooling power of the cryocooler assumed in the pre-dimensioning tool was 4.5 W. ... 108
Figure 4-25 – Experimental test applying the variable heat load profile of Figure 4-24 in the ESU. The simulations of the temperatures of the ESU and the coil were performed in the pre-dimensioning tool. ... 109
Figure 4-26 - Influence of the ESU to absorb the heat load profile of Figure 4-24 ... 110
Figure 4-28 – ESU booster mode tested with a squared wave (0 W - 13.8 W - 0 W) with a period of 20 s. The ESU was tested with the 3 and 6 litre expansion volumes. A test with the same heat load profile without ESU is also shown. ... 112
Figure 4-29 - Liquid lost amount in the beginning of the ESU drift mode as function of the initial filling. The liquid percentage loss is in relation to the initial filling. The same heat power of 1 W was used in all the tests. The initial temperature varies between 37.7 K (100 % of initial filling) and 38.7 (70 %).114
Figure 4-30 - Influence of the cryocooler orientation in the initial liquid lost amount. The three tests were performed between 37.8 K and 40.1 K with a filling pressure of 15.4 bar. The 1 W of heat power was used in all 3 tests. ... 115
Figure 4-31 - ESU drift mode with the heater placed in two differnt locations: "capillary side" and "opposite side". ... 116
Figure 4-32 - ESU drift mode, in the cases of 100 mW and 4 W of applied heat load. ... 117
Figure 4-33 – Influence of the heat power applied in the liquid lost amount. Liquid lost amount as function of the heat power applied. ... 117
Figure 4-34 – Hypothesis to explains the variations of initial liquid lost in the various configurations tested: heater in the capillary side and in the opposite side. The high thermal homogeneity of the cell for low heat powers allows the evaporation along the area of the cell walls. (See more explanation in the text). ... 118
Figure 4-35 - Trapped liquid amount dependence versus the ESU temperature operation. ... 119
Figure 4-36 - Influence of the heat power load in the trapped liquid amount in the temperature split. ... 120
Figure 4-37 – Cell walls spacing scheme. The total internal surface area of the copper cell is 30 % bigger than the aluminium cell and the shortest distance between wall and the farthest point of the wall is, respectively, 8.5 mm and 6 mm. ... 120
Figure 5-1 – Screw subject to a tensile stress due to the initial tightening and the pressure P[51]. The shadded zone represents the compressed zone of the joined elements (lid and cell). ... 131
Figure 5-2 - Differential thermal dilatation between the joined elements and the screw. ... 133
Figure 5-3 - The cylinder represents the heat switch and the cell fixed to the cold finger via a flexible thermal strap. Three types of movements are considered. Case 1: the base is fixed and the top is free. Case 2: the base and the top are fixed. Case 3: small twist of the structure. ... 134
List of tables
Table 1.1 - Specific heat of some selected materials at 40 K [24]. The ESU volume and mass are calculated to store 1000 J between 38 K and 42 K. The ESU was chosen cylindrical with its height equal to the diameter. ... 11
Table 1.2 –Comparison between some solutions to integrate a 40 K ESU to store 1000J. ... 22
Table 2.1 – Liquid amount needed to store 1000 J for different expansion volume size. In all the examples the final temperature is 40 K. ... 37
Table 3.1 – Properties of the different materials considered to the cell design. The yield strength, and young modulus are given for the temperature of 300 K. ... 50
Table 3.2 - Envelope size and masses of the cold part components used for the ESU temperature drift and temperature controlled modes. ... 83
Table 3.3 - Envelope size and masses of the cold part components of the ESU booster mode. ... 83
Table 3.4 - Estimated mass of an aluminium spherical pressure volume to withstand 25 bar (using a safety factor of 2)[36]. ... 83
Table 4.1 - Comparison of the influence of the expansion volume in the temperature drift between the work with liquid nitrogen[9] and neon. ... 90
List of Symbols
Q Heat load
A Area
c Specific Heat
C Heat capacity
E Energy stored
F Force
fress Resonance frequency
H Enthalpy
h Height
k Conductivity
K Conductance
L Latent heat
m Mass
n Moles number
P Pressure
p Pitch
Q Heat
r Radius
R Ideal gas constant
S Entropy
s Section
T Temperature
t Time
Tfin Final temperature
Tini Initial temperature
U Internal energy
V Volume
α Expansion coefficient 𝛾 Heat capacity ratio
Δ Gap width
𝜃 Contact angle
ρ Density
σ Surface tension
Acronyms
CTSU Cryogenic thermal storage unit
DV Dual volume
ESA European Space Agency ESU Energy Storage Unit
GGHS Gas gap heat switch
HX Heat exchanger
LPTC Large pulse tube cooler
PCM Phase change material PTR Pulse tube refrigerator
QWIP Quantum-well infrared photodetector
RT Room Temperature
SQUID Superconducting quantum interference devices
Introduction
The cooling of infrared detectors is one of the major applications for space cryogenics. Infrared vision provides useful information for earth observation and meteorology missions as well as for space tracking and surveillance programs[1]. For space observation missions, Infrared detection brings us unique information about star and planet forming regions, supernovas and the structure of the early Universe (Herschel [2]). Moreover, apart from the operational temperature range of these sensors, a low vibration and low electromagnetic interference environment is always required to avoid sensors sensitivity loss.
Different cooling techniques, among cryogenic fluids and mechanical cryocoolers, can be used to cool the infrared detectors down. Nevertheless, nowadays, mechanical coolers have become more and more attractive[3], thanks to their increasing reliability, and due to the intrinsic short lifetime of cryostats using stored cryogens.
However, even with pulse tube coolers, without moving parts at low temperature, some vibrations are induced either by the compressor and by the pressure oscillations inherent to the operation of cryocoolers, and these vibrations can limit very high precision measurements. One way to stop these vibrations during the measurement is to stop the cryocooler but this procedure leads to a fast temperature increase that results in a quite short time for measurements under a vibration-free environment.
To slow down this fast temperature rise, the sensitive sensors could be connected to a thermal Energy Storage Unit (ESU) that will act as a temporary cold source in a vibration-free environment. The idea is to couple a high enthalpy reservoir to the cold finger through a thermal switch, which is responsible for the thermal coupling or decoupling of the ESU from the cold source. During the sensor operation, the cryocooler is stopped and the heat switch isolates the temporary could source from the fast temperature drift occurring at the cold finger when the cryocooler is stopped. During this phase, the thermal energy dissipated by the sensor is then absorbed by the ESU and, thanks to its high enthalpy, does not lead to a severe temperature increase.
A solution to slow down this fast temperature rise in the 40 K temperature range is the objective of this present work. This concept, using a heat switch, can also be used to maintain the temperature of some cryogenic device constant in the case of cold source temperature fluctuations: the ESU is “charged” (i.e. cooled) whenever the cold source temperature is lower than the ESU and thermally decoupled while the opposite occurs and becomes ready for being “discharged” when needed.
Another objective of this work is the use of the 40 K enthalpy reservoir as a thermal buffer, where it is directly coupled to the cold source and to the cryogenic device in order to absorb sudden heat bursts. This principle was studied and demonstrated by Bugby[4] in the 35 K range.
One of the target applications of this 40 K ESU are the rather recent very long wavelength infrared sensors, the so-called Quantum-Well Infrared Photodetectors – QWIPs[5], used for space observation missions, earth observation and military applications. The Operational Land Imager for the Landsat Data Continuity Mission (Landsat 8) [6] is an example of the QWIP-based infrared instrument (launched in February 2013) used in an earth observation mission.
also lead to an efficient solution due rather large latent heat associated to their phase transitions. Some ESU were developed by our group to operate between 3-6 K[7] and 11 – 20 K[8] using the specific heat of lead and Gd2O2S, respectively. An ESU based on the liquid to vapor transition of the nitrogen was also studied to operate in the 70 K – 80 K range[9].
The triple point is also attractive for the development of an ESU because it corresponds to a phase transition occurring naturally at constant temperature, as is the case of the Thermal Storage Unit developed at Lockheed Martin[10]. This device operates at a constant temperature and uses the triple point transition of nitrogen at 63.2 K.
In the present work, the development of an ESU operating in the 40 K range is studied, the heat storage is obtained by the latent heat associated to the liquid-to-vapor transition of neon. It is shown that it presents a compact and light solution to store up to 1000 J in the 40 K range.
This text is divided in five chapters, where the different steps for the 40 K ESU sizing, manufacturing and testing are presented. In the first chapter, the solutions to store thermal energy below 100 K are discussed, and some examples of ESUs using those principles are presented.
In the second chapter a detailed description of the three operational working modes of an ESU using the liquid-vapor transition is given. This device can operate as a temporary cold source in a vibration-free environment by turning the cryocooler off. The direct coupling of the ESU to the cold source improves the temperature stability, which would be difficult to maintain stable in case of sudden heat bursts. Operation at constant temperature is also possible, similarly to the triple point transitions, by controlling the pressure in the enthalpy reservoir during the evaporation phase with a pressure control valve. It is shown that the liquid-vapor ESU working in this mode can be much more compact at low temperature than the triple-point based ESUs due to the higher latent heat of the liquid-vapor transition. In the same chapter, a thermal model is presented and adapted for each operational mode. With this thermal model a pre-dimensioning tool software was created, which is useful for system sizing and to predict the experimental results.
The use of cryocoolers
In the fourth chapter, all of the functional tests of the ESU modes are presented: the “temperature drift mode” and the “temperature controlled mode”. In both modes the heat switch allows the operation in a “quasi-adiabatic” environment, which facilitates the measurement of the stored energy within the ESU. The cyclic operation tests (Cooling process followed by the ESU) are also shown, where a detailed description of each phase is given. For the tests of the ESU booster mode, a smaller cell (12 cm3) was directly coupled to the cryocooler cold finger to attenuate its temperature variation in case of sudden heat bursts. This configuration was sized to absorb 400 J within a temperature drift of 1 K at the 40 K range. Tests to study the influence of this configuration in the cryocooler temperature (with a cooling power of 4.5 W at 40 K) when subjected to high heat loads (14 W) and variable heat load profiles were applied and are presented. During all these tests, the experimental results are compared to instead of with those obtained by the thermal model.
The use of cryocoolers
1 The use of cryocoolers
The reliability of the cryocoolers is presently so high that they can integrate cryogenic infrastructures, where the stored cryogen systems were used in the past. Since the 1960s the possibility of cooling with a very long lifetime cryocooler instead of a limited lifetime provided by the liquid reservoirs has attracted their use in space cryogenic missions. But, at that time, the temperatures obtained using cryogens were more competitive. For instance, a system using solid cryogen was able to obtain temperatures as low as 6 K. This solid state was kept by the vacuum of space and was stable in zero g operation. To achieve lower temperatures it was necessary to use liquid cryogens (helium). But some factors like zero-g fluid management complicate the use of cryogenic liquids. These systems are characterized by their simplicity when compared with the cryocoolers and the non-existence of vibration. But the typical lifetime of 1-2 years was a limitation of cryogen systems.
These facts stimulated the investments to achieve lower temperatures, high power efficiency, high cooling power and low vibrations. The number of cryocoolers in space missions is growing rapidly, thanks to their high level of maturity. Pulse Tube, Stirling and turbo-Brayton cryocoolers have been reliably used in space missions involving infrared sensors. Many single-stage cryocoolers (50-100K range) are approaching 10 years of on-orbit operation, maintaining their cooling performance [3, 12]. Beyond of the non-existence of intrinsic lifetime limit, the cryocoolers have significantly lower mass than stored cryogens of comparable cooling capacity.
The Stirling cryocoolers use the Stirling engine principle. In the 1970s, at Oxford University the engineers developed and qualified a reliable long-life Oxford Stirling cooler for space[3]. The cooling process is a result of compressions and expansions of the working fluid, helium, in 2 chambers through a regenerative heat exchanger. Two pistons are responsible for these compressions and expansions. The Oxford engineering made innovations in the moving mechanisms increasing the reliability of these coolers[13]. The first closed-cycle mechanical cryocooler in orbit was the Malaker Stirling cooler that cooled an infrared radiometer, in July 1971[3]. The cooling power of each Stirling was 2 W at 100 K with 40 W input. The two coolers periodically cooled the detectors to 105 K during the radiometer operation (3 to 4 h periods). The total run time on the coolers during the mission was less than 1000h [3]. The Ramaty High-Energy Solar Spectroscopic Imager (RHESSI) used a Sunpower M77B Stirling cooler to cool a detector array to 75 K (Figure 1-1a))[14]. This was the first low-cost commercial cooler to achieve multi-year operation in space [3, 14].
Another type of cryocooler that is often used is the pulse tube refrigerator (PTR). The PTR is a closed-cycle regenerative mechanical cooler, like the Stirling coolers, but without moving parts at low temperature. This leads to an increase of the lifetime and to a reduction of the vibration level. Cooling powers of ~1.5 W at 4.2 K and ~40 W at 45 K can be obtained with the modern Pulse Tubes refrigerators. An example of multi-year cryocooler operation in space is the TRW pulse-tube cooler used to cool two different infrared focal planes to 62 K on JPL’s Tropospheric Emission Spectrometer instrument (TES)(Figure 1-1 b). The TES was launched in 2004 and worked during more than 16000 h without any problem [3]).
The use of cryocoolers
1999, a Turbo–Brayton cryocooler (7.1 W at 70 K (Figure 1-1c) was installed on the Hubble Space Telescope in 2002[3].
Figure 1-1 - a) Sunpower M77B Stirlling cryocooler used on the RHESSI radiator structure[3]; b) NGST TES pulse tube cryocooler[3]; c) The Turbo- Brayton cryocooler in preparation for installation on Hubble Space Telescope[3].
The main drawback in the use of cryocoolers are the vibration. Most of the cryocoolers used for earth Observation missions or surveillance tracking programs are Stirling or Pulse Tube cryocoolers and are based on compression-expansion cycles of helium. The pressure oscillations due to these cycles leads to vibrations that can affect the instrument performance. Moreover, the vibration effect on instrument noise is hard to model, hence hard to predict. A lot of developments were made in Pulse Tube and Stirling cryocoolers to reduce these vibrations [16, 17]. In addition to the mechanical vibrations, the magnetic interferences induced by the motor of the mechanical cryocoolers can influence certain measurements. That is the case, for instance, of the cryocoolers used to cool SQUID magnetometers [18].
1.1 Cooling below 50 K
The development of very long wavelength infrared devices for space or earth observation missions for civilian and military applications has increased the demand for reliable cryocoolers to work below 50 K. It is the case, for example, for the cooling of the very long wavelength infrared devices (Quantum-Well Infrared Photodetector - QWIP) where temperatures as low as 40 K are required for these devices to work properly[6].
The GaAs/AlGaAs QWIPs rely on intersubband transitions between quantized states within conduction band and their range of detection is 8 – 13 µm. These QWIPs are usually used in the array form. Some thermal imaging cameras are based in QWIPs arrays [19]. The QWIPs characteristics are very dependent of the temperature: at 45 K their performance can be the half of that at 40 K [20]. In addition to the temperature stability for a properly working, a low vibration and electromagnetic interference environments are required.
The thermal infrared sensor (TIRS) of Landsat 8 (launched on February, 2013) is a on orbit example of QWIP based instrument[21]. A mechanical two-stage cryocooler is responsible for the focal plane cooling at 43 K.
For missions of Earth Observation or Surveillance Tracking programs, CEA/INAC/SBT and Air Liquid have developed the so-called “Large Pulse Tube Cooler” (LPTC) for the temperature range of 40 – 60 K (Figure 1-2)[22]. This cooler appears as an alternative to the Stirling coolers for applications
The use of cryocoolers
where a low vibration level is a requirement. This LPTC has a cooling power of 2.3 W at 50 K and 1 W at 40K and a minimum temperature around 31 K [22].
Figure 1-2 – Coaxial Large Pulse Tube[22].
Other pulse tube coolers were created to cool infrared detectors down to 50 K with low vibrations. It is the case of the Stirling-type pulse tube cryocooler developed by Wang[20] to cool GaAs/AlGaAs QWIPs that require the cooling power of 0.3 W at 40 K. This cryocooler provides a cooling power of 420 mW at 40 K. Also to cool this type of infrared detectors a single stage coaxial pulse tube cooler was developed by Dang[23]. This model can provide 860 mW of cooling power at 40 K.
The demand for low vibration coolers in this temperature range is patent and, for instance, ESA (European Space Agency) published the following call in 2013: “Two Stage Cooler for Detector Cooling between 30 K and 50 K”. Using the actual pulse tube and Stirling technologies in a double stage configuration the cryocooler should be able to provide 800 mW at 35-40 K (cold stage) and 1500 mW at 100 – 130 K in the higher temperature stage to intercept parasitic heat load. This cooler will be used to provide temperatures around 35 K – 40 K to enable the operation of big QWIP detector matrices for earth observation missions (ESA Intended Invitation To Tender nº 11.127.02).
1.2 Storing thermal energy below 50 K
The use of cryocoolers
Figure 1-3 - A schematic integration of an energy storage unit (ESU) in a cryocooler for: a) “vibrationless configuration”; b) cooling power booster. In both cases the sensor is coupled to the ESU. Adapted from [9].
In the first phase of the operation with an ESU, the pre-cooling phase, the enthalpy reservoir is cooled down to the lowest temperature achievable by the cryocooler. During this first phase the thermal heat switch is maintained in its higher conducting state (ON state) to allow cooling. When the ESU is cold, the second phase, the so-called “ESU mode” can start: the heat switch is toggled to the OFF state (the poor conducting state) leading to the thermal decoupling of the ESU from the cryocooler. At this time the cryocooler is turned off and the cold finger temperature starts to increase (the rate of increasing being dependent of the cryocooler’s characteristics as well as the thermal inertia coupled). During this phase, thanks to the thermal decoupling from the cryocooler and the high enthalpy of the ESU, the temperature of the ESU also starts to increase from pre-cooling temperature but at a much slower rate. During the temperature drift the ESU actuates as thermal ballast and the rate of this drift is going to be dependent of the ESU enthalpy [7, 8].
The ESU can also be directly coupled to the cold finger of the cryocooler and used to temporarily increase the cooling power of the cryocooler – this mode will be called in the following as “cooling power booster mode” (Figure 1-3 b). In this mode, the main task of the ESU is to absorb sudden heat bursts dissipated by the sensors, which are cooled by a cryocooler with a lower cooling capacity than the sudden heat bursts. As illustrated in Figure 1-4, the heat load profile can be modelled as dissipating QH,MAX during δt and QH,MINin P- δt, where P is the period. For an efficient use of the ESU, the cooling capacity (QC) must be higher than the medium heat load (QH,MIN ). When the heat load from the sensor is less than QC,, some cooling energy is being stored. The laying area between the cooling and heat load curves, when the cooling capacity is higher, represents the stored energy (ES). When the opposite scenario occurs the cooling energy (EU) is being used. In a cyclic ESU operation the minimum cooling power (QC,MIN) occurs when the ES=EU is ensured [13].
Figure 1-4 – ESU operation with a variable heating profile, adapted from[13].
For some astronomy applications the focal plane QWIPs array operates at 43 K (nominally)[6]. With the number of QWIPs sensors increasing in the arrays, to obtain higher resolution images, more
Cold%finger%
Analytical Fundamentals 419
Fig. 17.5. CTSU attachment options and key issues.
mass requires the use of high-performance spherical or cylindrical configurations like spun aluminum shells with high-strength fiber overwraps.
Analytical Fundamentals
This section provides a brief overview of the analyses needed to design a CTSU and model its thermal performance. The topics include thermal storage unit funda- mentals, sample problem definition, minimum cooling power and average heat load, energy storage capacity and PCM mass, sizing of the heat exchanger, impact of parasitics, sizing of the dual-volume storage tank, thermal design of the heat exchanger core, and thermal performance of the CTSU. References 17.1 through 17.11 in this chapter and Chapter 11 of Volume I of this handbook provide addi- tional details. 171-1711
CTSU Fundamentals
A prototypical CTSU application is one in which the heat-dissipating cryogenic component has a periodic heat load variation, requires a high degree of thermal stability, and is cooled by a cooling source with a capacity less than the peak heat load. This situation is illustrated in Fig. 17.6. In this figure, the component heat load profile consists of QH, MAX for 8t and QH, MIN for P - tSt, where P is the period. For a thermal storage unit to be beneficial, the cooling and heat load curves must intersect at least once each period (on average). When the component heat load is less than Qc, cooling energy is being stored. The energy stored (E s) is the area between the cooling and heating curves, where the former is above the latter. When the component heat load is greater than Qc, cooling energy is being used. The energy used (Eu) is the area between the heating and cooling curves, where the former is above the latter. The minimum cooling power (QC,MIN) occurs when E s = E U. If E s > E U, the cooler has excess capacity. If E s < E U, the cooler has insufficient capacity. From a thermal-management standpoint, a cooler should have some excess capacity to maintain positive control. The greater the ratio (QH, MAx/Qc, MIN), the greater will be the benefit of thermal storage.
QA QH,MAX QAVG QH,MIN (Eu) Heating profile f
/Cooling capacity (Qc)
The use of cryocoolers
cooling capacity is required. In the case of using these sensors in short times events, an ESU, working in the booster mode, would allow the use of low power consumption cooler. Such a configuration, providing a high thermal inertia also leads to a better thermal stability of the cold finger on short time, which is a very important requirement for QWIPs, a temperature stability of circa 0.01 K.
Following, in the next section, some ESU concepts are presented.
1.2.1 Sensible heat energy storage
A very simple way to store heat (Q) with a limited temperature drift ∆T is to dissipate it in a high heat capacity (C) block (ΔT= Q/C). Materials with high specific heat are then good candidates for thermal energy storage units. Such ESU are sometimes called as sensible heat ESU by opposition to the latent heat ESU where the heat absorption is accompanied by a first order change of state like the liquid to gas transition. The sensible heat energy storage concept was used to obtain a “Solid State” cold source without mechanical, thermal and electromagnetic perturbations for sensitive applications or microgravity issues. Two ESUs of this type were developed by our group some years ago: The materials chosen to store thermal energy using sensible heat were the lead[8] between 11 K and 20 K and the Gd2O2S (GOS)[7] between 3K and 6 K. In Figure 1-5 the specific heat of these two materials is plotted. The high specific heat peak of GOS at 5.2 K is due to a paramagnetic-antiferromagnetic phase transition whereas the relatively large Pb heat specific is due to its low Debye temperature. Both ESU’s were sized to store 36 J during the aforementioned temperature intervals.
Figure 1-5 – Specific heat of the Gd2O2S (GOS) and lead compared to the copper and stainless steel[24].
In both GOS and Pb ESUs, the enthalpy reservoir, which contains the high specific heat material, is connected to the cold finger of a cryocooler through a gas gap heat switch. With such a setup it is possible to use the ESU as a simple cold source, free of vibrations and electromagnetic noise. When the ESU is cold (initial temperature - Tini), the cryocooler may be turned OFF and the heat switch switched to the poor heat conduction state (OFF). By this time the sensors, placed on a temperature controlled “Sensor Platform”, could operate in a completely vibration-free environment and be decoupled from the temperature increase of the cryocooler. In these solid state ESU’s, any heat exchange only change its temperature. Therefore, the amount of heat stored by the ESU between the initial (Tini) and final temperature (Tfin):
Q= m.c T
( )
dT Tin T
fin
∫
=H T( )
fin −H T( )
in (1.1)0 0.2 0.4 0.6 0.8 1 1.2
0 5 10 15 20 25 30
Sp
e
c
ifi
c
h
e
a
t
[J
/(c
m
3
.K
)]
Temperature [K]
The use of cryocoolers
where m is the mass and c the massic specific heat of the material used to store the energy and H the enthalpy of the ESU. In these two ESU’s, the sensor are attached to a “Sensor Platform” loosely copled to the enthalpy reservoir (Figure 1-6), instead of directly coupled on it. With this configuration, the temperature of the platform can be maintained strictly constant at a temperature higher or equal to Tfin during the ESU mode despite the temperature drift of the ESU [7].
Figure 1-6 – General scheme of the ESU [8]. A “Sensor Platform” to maintain a constant temperature during the ESU-mode is used.
A complete cycle of an ESU mode (continuous operation and duty cycles) using the GOS, with the “Sensor Platform” maintained at constant temperature is demonstrated in Figure 1-7:
- At the beginning with the “Enthalpy Reservoir” at TER=3.67 K (TER - black line), and the switch in the OFF state by cooling the cryopump (Tsorb - green line) below ≈ 10 K, the cryocooler is stopped and its temperature increases (Tcf – blue line).
- The platform is controlled at a constant temperature (Tpf – red line) equal to 6 K during the ESU-mode. In this phase the platform temperature was stable within 5 mK.
- “A little before” the temperature of the enthalpy reservoir achieves the temperature of the platform, the ESU mode finishes (t ≈ 38 min). To continue to control the temperature of the platform it is necessary to recycle the enthalpy reservoir: The cryocooler is turned ON and the ESU is cooled again by toggling the heat switch into the ON state (cryopump was heated). This phase of the cycle is called “duty-cycle”. - When the ESU achieves 3.4 K the ESU is considered “recycled” (t≈51 min). The
cryopump heating is stopped in order to toggle the switch into the OFF state.
The use of cryocoolers
Figure 1-7 – Temperature variations during three cycles with ESU GOS. The platform temperature was maintained stable at 6 K during 2.5h (adapted from [7]).
During these 3 cycles (≈2.5 h), the platform temperature was stable within 5 mK whereas the cryocooler was maintained stopped during ≈1.8 h. Nearly 70 % of the time the sensor was in a completely vibration-free environment.
Looking back for our target, a way to store energy at 40 K, this “sensible heat ESU” concept is possible to be used in order to have a cold source free of vibrations, or simply used as booster mode to absorb the heat peaks. However, to choose a high specific heat material, two important factors needs to be taken into account: the mass and/or volume. Table 1.1 presents the comparison between specific heat of different materials. To make easier the physical comparison between these materials, the mass, the volume and the size of the ESU are calculated to store 1000 J (e.g. 1 W during ≈ 17 min.) between 38 K and 42 K.
Table 1.1 - Specific heat of some selected materials at 40 K [24]. The ESU volume and mass are calculated to store 1000 J between 38 K and 42 K. The ESU was chosen cylindrical with its height equal to the diameter.
Material Density (kg/m3) Specific heat (J/(cm3K)) mass (kg) Volume (L) Diameter (cm)
Copper 8960 0.53 4.27 0.48 8.46
Aluminium 2713 0.23 3.00 1.11 11.21
SS 8000 0.45 4.44 0.56 8.91
Brass 8802 0.66 3.33 0.38 7.84
Ice Water 920 0.33 0.70 0.76 9.88
Lead 11340 1.07 2.65 0.23 6.68
Er0.73Pr0.27 ≈9000 1.32 1.70 0.19 6.22
Nickel 8908 0.34 6.55 0.74 9.78
The use of cryocoolers
The solid nitrogen appears as the most competitive high sensible heat material, in mass and volume point of view. However, if maintained in this small volume, at room temperature, the nitrogen will be in its gaseous phase at a very high pressure (> 2000 bars). For such pressures, the technical requirements would lead to a mass of the reservoir that exceeds the mass of the solid N2 and the advantages of using N2 become quite questionable. Discarding this solution, the erbium-based alloys like Er0.73Pr0.27, from the volume point of view are the most interesting whereas, for the mass
optimization, the ice water provides the lightest solution. The difference of water densities between the liquid and solid state being lower than 10 %, a simple volume filled at 90% of water at room temperature could provide a solution.
The ice water has already been tested to use as an ESU (called as “heat capacitor” by the authors) in a magnetically levitated vehicles (maglev) [25]. The main idea was to operate the High Temperature Superconducting magnets detached from a cooling source and without a vacuum pumping system after their cooling. The range 20 K – 50 K was assumed as the operational temperature range of this system.
Figure 1-8 – Schematic drawing of the annex place of the ice water. Adapted from [25].
A test system was built and tested with a total amount of 1 kg of ice water being used as a heat capacitor (Figure 1-8), in the dummy coil (9.28 kg of copper to simulate the real coil) and in the radiation shield (1.86 kg of aluminium). The activated carbon attached on the dummy coil is responsible to adsorb the residual gas (during the operation no vacuum pumping system was used). After cooling the dummy coil at 20 K with a Gifford Mac Mahon cryocooler, and the shield at 50 K, the cryocooler was decoupled and turned off. The use of ice water increased in 2 hour the drift time of the dummy coil between 20 K and 50 K, for a total drift time of 8 hour. The idea is, considering scale effect, to have 1 day of cold storage in a full-scale magnet for Maglev vehicles.
The integration of such heavy or voluminous ESUs displayed in Table 1.1 can be disproportional or even incompatible in some compact cryogenic systems or small cryocoolers. Other alternative solutions, which take in account a reduction of the mass and volume at low temperature, are going to be discussed in order to be used as thermal energy storage unit.
Dummy
coil Shield
Activated carbon
Cooler
The use of cryocoolers
1.2.2 Phase change materials
In the case of sensible heat based ESU, the high specific heat of the materials reduces the temperature drift as thermal energy is absorbed. But, in the case of the liquids or even solids, the absorption of thermal energy does not necessarily lead to a temperature increase. Instead of the temperature increase, a first order phase change can occur (Figure 1-9 a)). These first order phase changes are accompanied by an energy exchange, also called Latent Heat ecchange and heat absorption can occur at constant temperature. The transitions solid – vapor, liquid and solid-vapor are examples of first order transitions.
The latent heat, the energy released or absorbed by a body during a phase change at constant temperature, is given by:
(1.2)
The ΔS is the entropy difference between the final phase and initial phase (e.g. gas –liquid). If the process is conducted under constant pressure, the latent heat can be rewritten as function of the variation of the enthalpy (ΔH):
(1.3)
Figure 1-9 b) gives the generalized layout of a Temperature-Enthalpy (T-H) diagram for a pure substance. This diagram provides a way to determine the amount of exchanged heat when a substance undergoes a phase change. As the latent heat is a measurement of the difference of the enthalpy between the final and initial state, the enthalpy of the different states presented in this diagram allows to realize the differences between the latent heat of the different transitions: liquid-vapor transition (green shade), the solid- liquid-vapor transition (red shade) and the solid-liquid (blue shade). The solid and liquid states present lower entropy (and enthalpy) when compared with the entropy of the vapor, which explains the higher latent heat of the S-V and L-V compared with the S-L state.
Figure 1-9 – P-T (a) and T-H (b) phase diagrams of a pure substance; Three phase changes are represented in both diagrams.
Consider the three phase changes presented in both diagrams (at constant pressure): P1, P2 and P3. P1 represents the transition between the liquid to a vapor state at Tref temperature. The
L=TΔS
![Figure 1-7 – Temperature variations during three cycles with ESU GOS. The platform temperature was maintained stable at 6 K during 2.5h (adapted from [7])](https://thumb-eu.123doks.com/thumbv2/123dok_br/16542088.736782/35.892.121.816.112.532/figure-temperature-variations-cycles-platform-temperature-maintained-adapted.webp)