Short Report
Printed in Brazil - ©2015 Sociedade Brasileira de Química0103 - 5053 $6.00+0.00S
*e-mail: [email protected]
Prediction of Phase Separation Using a Modified Regular Solution Theory and the
SMD Continuum Solvation Model
Josefredo R. Pliego Jr.*
Departamento de Ciências Naturais, Universidade Federal de São João del-Rei, 36301-160 São João del-Rei-MG, Brazil
It is proposed a new expression for the β parameter in the regular solution theory, using the solvation free energy concept instead of the solubility parameter. This modified regular solution theory can be applied for any liquid mixture combined with any method for solvation free energy calculation. The new approach was tested in fifteen liquid mixtures using the solvation model density (SMD) continuum solvation model and has successfully predicted the phase behavior, with exception of water-acetonitrile mixture. This flaw can be attributed to the microheterogeneity of this system. The main advantage of the present approach is a fast prediction of phase separation.
Keywords: dielectric continuum, free energy, solubility, partition equilibrium, liquid-liquid
equilibrium
Introduction
Phase equilibrium plays an important role in separation processes, mainly in the area of chemical engineering.1
The knowledge of phase behavior requires extensive experimental measures in order to generate phase diagram. From a theoretical viewpoint, predicting phase separation in binary liquid system is a difficult task, because it requires accurate values of the solvation free energy of the components for each phase composition. In fact, phase separation involves free energy variations around 1 kcal mol-1.
The rigorous theoretical calculation of the free energy of mixture via computer simulation of liquids faces two problems: correct sampling and accurate intermolecular potentials.2 An alternative to rigorous
free energy computation is using approximate models. An example is the “conductor-like screening model”-segment activity coefficient (COSMO-SAC) model, which has been improved to treat this kind of problem.3
Although the COSMO-SAC is an interesting approach, it is not possible to predict accurately the composition of both the phases yet.
The excess free energy of mixture can be described by empirical equations and some of them have a theoretical model justification.4 The simplest model able to predict
phase separation in binary liquid solutions is the regular solution theory4-6 and the related free energy of mixture
is given by:
1 1 2 2 1 2
mixt
G
x RTlnx x RTlnx
n βφ φ
∆ = + + (1)
the first and second terms on the right side correspond to the ideal free energy of mixture and the last term is the interaction term. φi is the volume fraction of the component
i and it becomes the molar fraction for liquids with the same molar volumes. The calculation of the value of β is done through the following equation:7,8
2 2 1
( )
V
β= δ −δ (2)
where the δi term is the solubility parameter for the
component i and V is the molar volume of the solution. – Because of the importance of the solubility parameters, many recent reports present different approaches for their estimation.9-12
The aim of this work is using modern formulation of solvation thermodynamics13-15 to propose an approach
Methodology
Gas-liquid and liquid-liquid phase equilibrium, as well as chemical process in liquid phase, can be formulated using the concept of solvation free energy, ∆G*
solv. In the
modern view of the solution phase free energy, the general expression of the chemical potential using the solvation free energy data for each component in any phase with molar fraction x1 of component 1 is:
(
)
*( )
*(
)
(
)
1 1 1
1: 1 1: 1:
g solv
x G x RTln C x
µ =µ + ∆ + (3)
where the first term in the right side is the ideal gas free energy at 1 mol L-1, the second term is the solvation free energy of
component 1 in solution with molar fraction x1 and in the
last term, C(1:x1) is the concentration of the component 1
(units of mol L-1) in solution with molar fraction x
1. A similar
expression can be written for component 2:
(
)
*( )
*(
)
(
)
1 1 1
2 : 2 2 : 2 :
g solv
x G x RTln C x
µ =µ + ∆ + (4)
The resulting free energy of mixture becomes:
(
)
(
)
(
* *)
1 1: 1 1 :1
mixt
solv solv
G
x G x G
n
∆ = ∆ −∆ +
(
)
(
*(
)
*(
)
)
1 1
1 2 : 2 : 2
solv solv
x G x G
+ − ∆ − ∆ +
(
)
(
)
(
)
(
)
(
)
1 1 1 11: 2 :
1
1 :1 2 : 2
C x C x
x RTln x RTln
C C
+ + −
(5)
In equation 5, ∆G*
solv(1:1) is the solvation free energy
of component 1 in pure liquid 1. The terms (1:2), (2:1) and (2:2) are also being used and mean component 1 in pure 2 (infinity dilution), component 2 in pure 1 (infinity dilution), and component 2 in pure 2, respectively. Equation 5 is exact and provides the correct value of the free energy of mixture. However, predicting phase separation would require a point wise calculation of the solvation free energy for each x1
values using, for example, computer liquid simulation and free energy perturbation. If the chemical potential could be calculated for each liquid phase composition by liquid simulations, all of the phase diagram would be determined.
In order to simplify the procedure, we could propose a functional form for the solvation free energy term. In the modified regular solution theory (MRST), this function is proposed to be:
(
)
(
)
* * 2
1 2
1 : 1 :1
solv solv
G x G βx
∆ = ∆ + (6)
Considering the total volume does not change, we can write that:
(
)
( )
1 11
1 1 2 2
1: 1:1 x V
C x C
x V x V
=
+ (7)
(
)
(
)
2 21
1 1 2 2
2 : 2 : 2 x V
C x C
x V x V
=
+ (8)
In addition, if the molar volumes are close, these expressions can be simplified to:
(
1: 1)
1( )
1 :1C x =x C (9)
(
2 : 1)
2(
2 : 2)
C x =x C (10)
Based on equations 9, 10 and the Gibbs-Duhem relation, we can arrive in the expression:
(
)
(
)
* *
1 1 1
1 2 1
2 : 1:
solv solv
d G x x d G x
dx x dx
∆ ∆
= − (11)
and substituting equation 6 in 11 leads to
(
)
(
)
* * 2
1 1
2 : 2 : 2
solv solv
G x G βx
∆ = ∆ + (12)
Doing x2 = 1 in equation 6 and x1 = 1 in equation 12,
we can obtain:
(
)
(
)
* *
1: 2 1:1
solv solv
G G β
∆ = ∆ + (13)
(
)
(
)
* *
2 :1 2 : 2
solv solv
G G β
∆ = ∆ + (14)
We have two boundary conditions for determining the β parameter. A possibility to overcome this problem is to sum equations 13 and 14 to obtain an average value for β:
( ) ( ) ( ) ( )
(
* * * *)
1
1: 2 2 :1 1:1 2 : 2
2 solv solv solv solv
G G G G
β = ∆ + ∆ − ∆ − ∆ (15)
Equation 15 is the value of β parameter in the modified regular solution theory proposed in this paper. Substituting equations 6, 9, 10, 12 and 15 in equation 5, we obtain:
1 1 2 2 1 2
mixt
G
xRTlnx x RTlnx x x
n β
∆
= + + (16)
( )
*1
0
mixt
d G x1
dx
∆
= (17)
( )
2 *2 1
0
mixt
d G x1
dx
∆
= (18)
Based on equations 17 and 18, we can deduce that phase separation must occur when β > 2RT. This is a very important result, because a simple analysis of the solvation free energy values allows us to determine if a phase separation will take place.
In the case of liquids with different molar volumes, we can use equations 7 and 8 in the calculation of molar concentrations. Assuming that equations 6, 12 and 15 are valid, the most complete equation becomes:
1 1 2 2 1 2
mixt
V G
x RTlnx x RTlnx x x G
n β
∆
= + + + ∆ (19)
The term is related to the difference in molar volumes between the components:
1 2
1 2
1 1 2 2 1 1 2 2
V
V V
G xRTln x RTln
x V x V x V x V
∆ = +
+ +
(20)
The ∆GV term is usually small, even for large variations
in the molar volumes. For example, for water-acetonitrile mixtures, the molar volumes are 18.0 and 52.6 L mol-1.
The corresponding ∆GV term is less than 0.1 kcal mol -1.
Therefore, its effect can usually be neglected even for liquids with very different molar volumes.
The calculation of the solvation free energy has low sensibility to the method used for determining the molecular geometries. Considering that solvent molecules are simple structures, which can be easily addressed by force field methods, the geometry for each solvent molecule was obtained using the MM2 force field implemented in the Chem3D program. Then, these structures were used to calculate the solvation free energy values through the SMD model. All the single point SMD calculations16 were done
using density functional theory (X3LYP functional)17 and
the Dunning DZ+P(d) basis set as implemented in the recent version of the GAMESS program.18 The default parameters
of the SMD model were used.16
Results and Discussion
In order to test the model (equations 15 and 16), 15 binary liquid mixtures were chosen. The chosen solvents have a wide range of polarity, going from cyclohexane to water, and including benzene, dichloromethane, 2-butanone, 2-butanol, aniline, nitromethane, acetonitrile
and methanol. Some mixtures are miscible while others have very low mutual solubility. In two cases, it was done the graphics of the calculated ∆Gmixt vs. molar fraction,
indicating the experimental value of phase composition. These graphics are presented in Figure 1. We can notice the symmetrical behavior of the theoretical ∆Gmixtvs. molar
fraction.
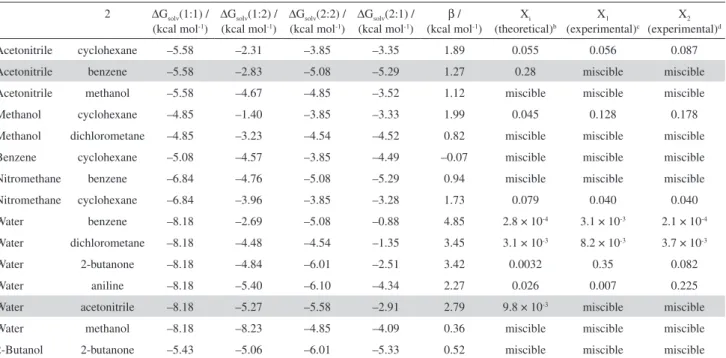
The fifteen solvent mixtures are presented in Table 1, which shows the solvation free energy values, the β
parameter and the theoretical and experimental phase compositions. At 25 oC, the criterion for phase separation is β > 1.18 kcal mol-1. We can notice the model is qualitatively
successful and is able to predict miscibility or phase separation in 13 out of 15 mixtures. In addition, more detailed observation of Table 1 shows that for acetonitrile-benzene mixture, the value of β is 1.27 kcal mol-1, very close to
the critical value of 1.18 kcal mol-1. This small difference
(0.09 kcal mol-1) could even be related to the error in the
solvation model. Thus, we can consider this case is not a serious flaw of the approach. In the other mixture, water-acetonitrile, it is predicted a phase separation with a very high value of β (2.79 kcal mol-1). In this case, the error is
related to the approximated MRST model, because recent reports have indicated a good performance of the SMD model for water16 and acetonitrile19 solvents. In fact, the
water-acetonitrile mixture forms two-phase binary mixture up to temperature of –1.34 oC. Above this value and up to
temperature in the range from 50 to 65 oC, this system has
a microheterogeneous structure.20 Any model based on the
solvation free energy values in pure and infinity dilution compositions could not predict such behavior. Based on these findings, it is reasonable to consider there is just one qualitative flaw of the MRST model in the 15 tested mixtures.
Looking at the phase composition values for systems with phase separation, the performance is reasonable, even considering that for some systems the phase compositions are highly asymmetrical. The major deviation occurs for water-2-butanone mixture. It is possible that the continuum SMD model does not describe adequately strong hydrogen bonds. This observation could be a possible explanation for the high deviation in the case of water-2-butanone mixture. It would be worthwhile to have future tests using explicit solvent methods.
In a sense, the MRST has an advantage over the classical regular solution theory. The present definition
of the β parameter depends on the interaction of both the components 1 and 2 in both the phases, which is more realistic than just one auto-interaction term like the solubility parameter. Therefore, the MRST uses more information of affinity of the components for each phase. On the other hand, the definition of β parameter by equation 15 indicates the equations 6 and 12 do not lead to the correct value of the chemical potential of each component in infinity dilution (1 in 2 and 2 in 1), which provides room for further improvement in the model.
Hsieh et al.22 have applied a revised version of the
COSMO-SAC model for 243 binary liquid mixtures including different temperature values. Those authors have found the model predicts phase composition with a root of mean squared (RMS) error of 0.1047 in the molar fraction. In the present study, it was analyzed phase separation in the temperature of 25 oC and included miscible mixtures.
Although a comparison between these studies is not adequate, if we consider only the immiscible mixtures studied in this work, the calculated RMS error is 0.14.
Conclusions
In summary, the new formulation of the regular solution theory presented in this work, combined with the SMD solvation model, provides a simple and fast approach to predict phase separation and even
semi-Table 1. Theoretical data for binary solutions and comparison with experimental composition of the phasea
1 2 ∆Gsolv(1:1) /
(kcal mol-1)
∆Gsolv(1:2) / (kcal mol-1)
∆Gsolv(2:2) / (kcal mol-1)
∆Gsolv(2:1) / (kcal mol-1)
β / (kcal mol-1)
Xi (theoretical)b
X1 (experimental)c
X2 (experimental)d
Acetonitrile cyclohexane –5.58 –2.31 –3.85 –3.35 1.89 0.055 0.056 0.087
Acetonitrile benzene –5.58 –2.83 –5.08 –5.29 1.27 0.28 miscible miscible
Acetonitrile methanol –5.58 –4.67 –4.85 –3.52 1.12 miscible miscible miscible
Methanol cyclohexane –4.85 –1.40 –3.85 –3.33 1.99 0.045 0.128 0.178
Methanol dichlorometane –4.85 –3.23 –4.54 –4.52 0.82 miscible miscible miscible
Benzene cyclohexane –5.08 –4.57 –3.85 –4.49 –0.07 miscible miscible miscible
Nitromethane benzene –6.84 –4.76 –5.08 –5.29 0.94 miscible miscible miscible
Nitromethane cyclohexane –6.84 –3.96 –3.85 –3.28 1.73 0.079 0.040 0.040
Water benzene –8.18 –2.69 –5.08 –0.88 4.85 2.8 × 10⁻⁴ 3.1 × 10⁻³ 2.1 × 10⁻⁴
Water dichlorometane –8.18 –4.48 –4.54 –1.35 3.45 3.1 × 10⁻³ 8.2 × 10⁻³ 3.7 × 10⁻³
Water 2-butanone –8.18 –4.84 –6.01 –2.51 3.42 0.0032 0.35 0.082
Water aniline –8.18 –5.40 –6.10 –4.34 2.27 0.026 0.007 0.225
Water acetonitrile –8.18 –5.27 –5.58 –2.91 2.79 9.8 × 10⁻³ miscible miscible
Water methanol –8.18 –8.23 –4.85 –4.09 0.36 miscible miscible miscible
2-Butanol 2-butanone –5.43 –5.06 –6.01 –5.33 0.52 miscible miscible miscible
aValues at 298 K. Experimental data taken from International Union of Pure and Applied Chemistry (IUPAC)-National Institute of Standards and Technology
(NIST)21 database; btheoretical composition of the phase rich in component 1 and rich in component 2 (symmetrical); cexperimental composition of the
quantitative prediction of phase composition. In addition, it provides a simple interpretation of phase behavior in terms of the β parameter. In the case of mixtures that have microheterogeneity, the present approach will not be able to make correct predictions, because it does not include molecular level details of the liquid structure.
Acknowledgements
The author thanks the support of the agencies CNPq, FAPEMIG and CAPES.
References
1. Gmehling, J.; Kolbe, B.; Kleiber, M.; Rarey, J.; Chemical
Thermodynamics for Process Simulation; Wiley-VCH:
Weinheim, 2012.
2. Cheng, T.; Li, F.; Dai, J.; Sun, H.; Fluid Phase Equilib.2012, 314, 1.
3. Lin, S.-T.; Wang, L.-H.; Chen, W.-L.; Lai, P.-K.; Hsieh, C.-M.; Fluid Phase Equilib.2011, 310, 19.
4. de With, G.; Liquid-State Physical Chemistry: Fundamentals, Modeling and Applications; Wiley-VCH: Weinheim, 2013.
5. Hildebrand, J. H.; Wood, S. E.; J. Chem. Phys.1933, 1, 817. 6. Hildebrand, J. H.; J. Am. Chem. Soc.1929, 51, 66.
7. Scatchard, G.; Chem. Rev.1931, 8, 321. 8. Barton, A. F. M.; Chem. Rev.1975, 75, 731.
9. Jackson, N. E.; Chen, L. X.; Ratner, M. A.; J. Phys. Chem. B
2014, 118, 5194.
10. Gharagheizi, F.; Eslamimanesh, A.; Sattari, M.; Mohammadi, A. H.; Richon, D.; Ind. Eng. Chem. Res.2012, 51, 3826. 11. Gupta, J.; Nunes, C.; Vyas, S.; Jonnalagadda, S.; J. Phys.
Chem. B2011, 115, 2014.
12. Gharagheizi, F.; Eslamimanesh, A.; Farjood, F.; Mohammadi, A. H.; Richon, D.; Ind. Eng. Chem. Res.2011, 50, 11382. 13. Ben-Naim, A.; J. Phys. Chem.1978, 82, 792.
14. Ben-Naim, A.; Marcus, Y.; J. Chem. Phys.1984, 81, 2016. 15. Ben-Naim, A.; J. Solution Chem.2001, 30, 475.
16. Marenich, A. V.; Cramer, C. J.; Truhlar, D. G.; J. Phys. Chem. B
2009, 113, 6378.
17. Xu, X.; Zhang, Q.; Muller, R. P.; Goddard III, W. A.; J. Chem. Phys.2005, 122, 014105.
18. Schmidt, M. W.; Baldridge, K. K.; Boatz, J. A.; Elbert, S. T.; Gordon, M. S.; Jensen, J. H.; Koseki, S.; Matsunaga, N.; Nguyen, K. A.; Su, S.; Windus, T. L.; Dupuis, M.; Montgomery Jr., J. A.; J. Comput. Chem.1993, 14, 1347.
19. Zanith, C. C.; Pliego Jr., J. R.; J. Comput.-Aided. Mol. Des.
2015, 29, 217.
20. Marcus, Y.; J. Phys. Org. Chem.2012, 25, 1072.
21. National Institute of Standards and Technology (NIST); IUPAC-NIST Solubility Database, Version 1.1, IUPAC-NIST Standard Reference
Database 106; NIST: Gaithersburg, MD, 2015.
22. Hsieh, C.-M.; Sandler, S. I.; Lin, S.-T.; Fluid Phase Equilib.
2010, 297, 90.
Submitted: March 31, 2015