© FECAP
RBGN
Review of Business Management
DOI: 10.7819/rbgn.v21i1.3967
136
Received on: 10/25/2017 Approved on: 08/22/2017
Responsible Editor:
Prof. Dr. Javier Montoya del Corte
Evaluation process: Double Blind Review
Sunk Costs: does group
decision make a difference?
Ana Luiza Paraboni¹
Jéssica Pulino Campara¹
¹Federal University of Santa Catarina, Florianópolis, Brazil
Newton Carneiro Affonso da Costa Jr.²
²Pontifical Catholic University of Paraná, Curitiba, BrazilMarcus Vinicius Andrade de Lima³
³Federal University of Santa Catarina, Florianópolis, BrazilAbstract
Purpose – Investigate whether joint decision-making is distinct from individual decision-making in the case of biased sunk costs.
Design/methodology/approach – We applied 96 questionnaires containing 5 questions adapted from Arkes and Blumer (1985) with undergraduate students. Individuals were considered in the individual mode, in pairs and in trios, totaling 190 participants. For data analysis, we used descriptive statistics, Chi-square test of adherence and Pearson’s Chi-square test.
Findings – When analyzing the opposite situation, five doubles and five triples presented biased behavior in all scenarios, whereas only two individuals had this same behavior.
Originality/value – Individuals generally take little rational decisions when considering the expenses incurred in the past to make decisions in the present. However, making decisions individually or in groups may not be able to change this behavior.
1
Introduction
According to behavioral theory, individuals have limited rationality. Therefore, when making decisions, they are subject to heuristics of judgment that lead them to make systematic errors, the so-called cognitive biases. The studies on biases include sunk costs, which correspond to the tendency of individuals to hold a certain position, once an investment in money, time, or effort has already been made (Arkes & Blumer, 1985).However, such a tendency is not always rational. Only the costs and benefits at the time should be taken into account in decision-making, and historical (past) costs should not influence current choices (Thaler, 1980). The implications of such biased decisions are diverse. In everyday life, for example, all-you-can-eat buffet restaurants usually lead people to ingest a much larger amount of food than they normally would, simply because of the money invested. At the corporate level, a manager may choose to continue a project that is not likely to generate the initially expected return, just because she/he has already spent a considerable amount on it. In the capital market, an investor may consider the losses incurred on a stock in the past when making investment decisions in the present, when in fact she/he should only consider the current and future scenario.
These examples only confirm the scope and relevance of the theme for all spheres of society, and reveal the diversity of scenarios that have already been investigated. However, little is known about the influence of group decisions on sunk costs, since studies of the impacts of group decisions are still limited within finance. Therefore, there is still no consensus as to whether groups take better or worse decisions compared to individuals (Prates, Da Costa Jr, & Dorow, 2017). Smith, Tindale, and Steiner (1998) sought to answer this question and are a few of the authors that have treated sunk costs and
group decisions simultaneously. Their findings indicated that both isolated individuals and those in groups of five are subject to sunk cost bias, but they showed that group decisions were more error prone than individual decisions. However, even with this result, there is still room for further research on the subject, as well as the need to fill a gap in the literature and identify whether group size also changes decision-making.
Given the above, this article aims to investigate whether joint decisions are different from individual choices when it comes to sunk costs. In terms of research innovation, the article presents a simultaneous study of sunk costs and group decision-making; it is widely accepted that bias actually occurs in several contexts, but little is known about group decisions. There is also innovation in the sense of not only identifying whether groups influence decision-making, but also whether the size of the group changes the choices.
Investigating group decision-making is important in the sense that many - both personal and business - decisions are taken together (Kocher & Sutter, 2005). Thus, if the study verifies that group decisions change the choices of individuals in relation to sunk costs, this can contribute to several sectors. In general terms, it may be useful to understand, for example, the difference between the decision-making of investment groups and individual investors in the financial market, and to understand managers’ choices; and it could also be indicative of the behavior of many families that are subject to sunk cost bias.
2
Theoretical Framework
2.1
Sunk costs
Sunk cost bias indicates that individuals have a tendency, even in adverse situations, to hold an investment simply as a result of considering already incurred and unrecoverable costs (Mcafee, Mialon, & Mialon, 2010). However, when the amount spent in an earlier period cannot be recovered, that cost should not influence current decisions. Sunk costs should be irrelevant to decision-making, which should be based on the current and future benefits associated with the alternatives available (Bernoulli, 1954). However, as observed in several studies (Thaler, 1980; Arkes & Blumer, 1985; Garland, 1991; Haller & Schwabe, 2014; Keller & Pastusiak, 2016), it is more usual for economic stakeholders to take into account the amount of money or time they have already spent on their decisions.
Seeking justifications for this conduct, Arkes and Blumer (1985) and Friedman, Pommerenke, Lukose, Milam, and Huberman (2007) elucidate that in the psychological sphere this behavior can be maintained due to three aspects: the person’s desire to feel that they are not wasting resources; self-justification, because they do not want to admit that they have made wrong investment decisions; and loss aversion, which makes people tend to allocate more resources in a project, even with successive losses, in order to “save” the amount already disbursed. For the same purpose, but using another approach, Richard Thaler (1980), a renowned researcher in the area of behavioral economics, sought to base this behavior on prospect theory, which was developed by Kahneman and Tversky (1979) and is considered the basis of behavioral finance. First, it is necessary to understand this theory, which is represented by Figure 1.
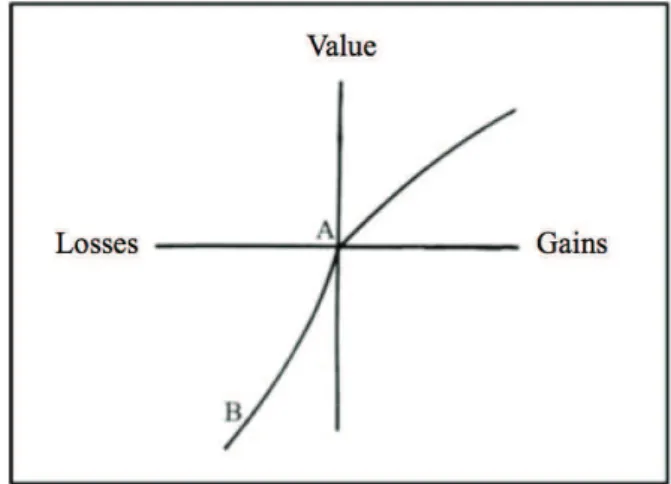
Figure 1. (Hypothetical) value function of prospect theory
Source: From Kahneman and A. Tversky’s “Prospect Theory: An Analysis of Decisions Under Risk”, 1979, Econometrica, v. 47, p. 279.
Looking at Figure 1, we understand that unlike the theory of expected utility (where decisions are equal in both the field of gains and losses because individuals act rationally), in prospect theory it is assumed that individuals are averse to risk for gains, but risk-prone for losses; that is, the behavior in the field of gains is different from that in the field of losses (Kahneman & Tversky, 1979). With this, it is conceived that the feeling of sadness in the case of losses is much greater than the euphoria or happiness experienced for gains. More recently, in the study titled “Advances in prospect theory: Cumulative representation of uncertainty”, Tversky
and Kahneman (1992) observed that risk-aversive behavior for gains and a high risk propensity for losses is true only for high probabilities (certainty effect). When considering low probabilities, the behavior is reversed, so that individuals seek risk for gains and are averse to risk for losses (possibility effect).
second example presents an investor who has already performed some operations and obtained consecutively unsuccessful results, and is thus located at point B of Figure 1. At the position of investor B, additional losses do not result in a large reduction in value, but comparable gains generate a considerable increase in value (this can be seen from the slope of the curve) and, therefore, investor B tends to accept greater risk than investor A, considering the possibility of small losses or substantial gains. This argument shows that as investor B already has irrecoverable costs, she/he tends to continue taking risk. On the other hand, investor A, who has incurred no losses, tends to be more cautious. However, this is an irrational behavior, because the investors are considering the value invested and the losses for decision-making, when in fact they should rationally analyze only future expectations and conditions.
Thaler’s second argument (1980) linking irrational behavior in relation to sunk costs to prospect theory is the certainty effect. This effect is manifested in two ways: absolutely certain gains are greatly overvalued and certain losses are undervalued, as in prospect theory. With this, whenever a sunk cost dilemma involves the choice of a certain loss versus maintaining an investment over a longer period, the certainty effect favors the latter option due to the positive expectation that the scenario will change and the cost spent can be recovered. This assumption, once again, indicates that people, even in adverse conditions, act by not only considering the current and the future situation, but that they unconsciously overestimate past costs (Mcafee et al., 2010).
These points make it clear that there may be several explanations for people’s behavior regarding sunk costs, and that, likewise, there are a multitude of implications and circumstances in which bias emerges. In everyday life, for example, Arkes and Blumer (1985) cite an experiment in which an individual is granted a free ticket to a football game and invites a friend, who, in turn,
needs to buy his own ticket. As they prepare to go to the game, a terrible blizzard begins, and the winner of the ticket announces that he will not go to the game anymore, because the climatic adversities to be faced would be greater than the pleasure of going to the game. On the other hand, his friend, who bought a ticket, immediately protests, reporting that he had paid for a ticket and could end up wasting money. This example makes the friend’s non-rational behavior clear, because he should only consider the momentary satisfaction conditions of going to the game or not, since the amount paid cannot be recovered, and thus should not influence his decision to go to the game or not.
At the business level, sunk costs can directly influence project decisions. Garland (1991) reports that the greater the investment already made in a project, the greater the probability that managers will choose to hold on to it, even if the prospects are not the best, simply because they have already spent a financial value. Equally, in the stock market investors often choose to hold a portfolio of stocks that are already operating, rather than abandon it and start a new one, even if it involves less profitability, as they consider the value already invested and do not want to waste it (Keller & Pastusiak, 2016; Thaler, 1980).
2.2
Group Decision-Making
most efficient decision makers (Le Bom, 1896). However, the most accepted perspective in the literature so far is that groups are the best decision makers (Rockenback, Sadrieh, & Mathauschek, 2007; Prates et al., 2017; Kugler, Kausel, & Kocher, 2012), and there is also evidence that groups make better decisions when their choices are not correlated (King & Cowlishaw, 2007; List & Pettit, 2011; Da Silva & Matsushita, 2017).
Corroborating the first perspective, Bone et al. (1999), when trying to identify the common ratio effect (the tendency of investors to choose a safer prospect rather than one that poses a greater risk, even for a greater return) in individual and group decisions, found little evidence that groups are more consistent than individual decision makers, with there being no significant difference between them. Shupp and Williams (2008) also failed to establish a concrete result regarding group or individual decisions, as their findings revealed that groups become more cautious in high-risk situations; however, at low risk levels, groups end up tolerating more risk than individuals, thus acting less rationally.
Regarding the second assumption, Le Bon (1896), one of the pioneers in studying crowd decision-making behavior, elucidates that individuals are able to master their impulses more easily, while groups turn out to be more impulsive and more irrational. Whyte (1993) ratifies these findings, revealing that greater interaction among group participants leads them to take more risky decisions. Specifically in relation to sunk costs, Smith et al. (1998) identified that both group and individual decisions show sunk cost bias, but that more rational people perform better alone than groups as a whole.
On the other hand, most of the studies up to now have pointed to groups as being more efficient decision makers, ratifying the third assumption. In this sense, Rockenback, Sadrieh, and Mathauschek (2007) identified that groups outperform individuals in terms of the adjusted returns of stock portfolios. According to the
authors, groups excel when they do not expose themselves to excessive risks. Similarly, Prates, da Costa Jr., and Dorow (2017) indicate that joint decisions are more cautious in relation to assets that suffer greater depreciation and, with this, are less biased if the disposition effect is considered, and groups, unlike the isolated individuals, did not present the effect researched by the authors. It is also worth noting the findings of Sutter (2007), who, when evaluating the decision-making of groups and individuals regarding aversion to myopic loss, showed that teams (under a small commitment) can attenuate aversion to myopic loss, but this does not leave them immune from presenting the same bias, even if at a lower level. Similarly, Kugler, Kausel, and Kocher (2012) conducted a review of the last 25 years on group decision-making and consistently concluded that collective decisions better reflect the assumption of rationality than individual ones.
Finally, the last possibility presented encompasses the literature on econophysics, which, based on Condorcet’s theorem and the wisdom of crowds, argues that groups are better decision makers when their choices are not correlated (Da Silva & Matsushita, 2017). According to List and Pettit (2011), Condorcet’s theorem leads to the realization that if the judgment of lone individuals is correct, the decision on the part of the group will follow in the same direction as it increases in size. Coupled with this, King and Cowlishaw (2007) elucidated that when individuals’ information is directed to error more than half the time, group decisions should be avoided. The theory of crowds follows the same perspective, and is summarized by Da Silva and Matsushita (2017, p. 119) as follows: “the group decides better than the individual only if the individual’s choices are independent (the errors are not correlated) and not biased”.
four-member groups outperformed individuals, while two-member teams did not perform significantly differently. This result indicates that the size of the team has, in fact, an effect on team decision-making. Similarly, but tied to aspects of behavioral finance, Prates et al. (2017) argue that an increase in the number of individuals in groups weakens the disposition effect, revealing that the larger the group, the smaller the cognitive error.
From this evidence, it is verified that groups do better in some situations, whereas in others isolated individuals do better, and yet there are those in which there is no difference in decision-making. Furthermore, group size may also be a predictor. From this, it is evident that there is no consensus in the literature, thus warranting academic attention in order to better define the circumstances that make decision-making more efficient: in groups or in isolation.
3
Method
This study uses an experimental approach, consisting of a questionnaire applied to students of administration, accounting sciences, and economics courses at the Federal University of Santa Catarina (UFSC). The process of developing the experiment took place in the classroom. Initial contact was made with the teacher of each discipline to obtain his/her permission. Later, the researchers went to the classes and contacted the students, asking them whether they would be interested in participating in the study, and leaving them completely free not to accept or even give up during the process. In addition, each student answered only one questionnaire, and the instructions for completing the survey were given without specifying the subject of the research, in order not to influence the answers.
The questionnaires were applied to 34 students individually, as well as to 60 students in groups of two, and to 96 students in groups of three. The data collection thus contemplated a total of 96 instruments applied among individuals both individually and in groups, with a total of
190 participants. The groups formed freely, with those conducting the experiment merely taking care to make their composition as heterogeneous as possible in terms of gender, thus avoiding this variable interfering in the results.
The questionnaire applied was adapted from Arkes and Blumer (1985), and was thus composed of five questions related to sunk cost bias, and two questions exploring the profile of the respondents: gender and age. The situations presented in the data collection instrument are hypothetical, however several studies have already been carried out using real experiments so that people made decisions considering their own money, but the results were not different from those obtained with questionnaires (Arkes & Blumer, 1985), thus justifying the reason for choosing this method.
For the data analysis, we used descriptive statistics, the chi-square test of adherence, and the Pearson’s chi-square test (independence test) using the SPSS software. The descriptive tests initially aimed at verifying the profile of the respondents. Subsequently, descriptive statistics were used to analyze the frequency and percentage response for the five specific sunk cost variables.
4
Analysis and Discussion of Results
The survey comprised a total of 190 participants, of which 34 answered the questionnaire
Table 1
Gender of the respondents
Variable Category Individuals (34) Pairs (30) Trios (32)
Gender
Male 47.10% 40.00% 25.00%
Female 52.90% 30.00% 25.00%
(Male and Female) - 30.00% 50.00%
individually, 60 in pairs, and the remaining 96 students answered in trios. Table 1 shows the gender of the participants in each group.
Regarding the individual respondents, it is first observed that the sample was balanced between males (47.1%) and females (52.9%). For the pairs, 40% of the groups consisted of only men, 30% of only by women, and the remaining 30% consisted of one male and one female. Half of the trios were composed of participants of both genders and the other half separated equally between males (25%) and females (25%). It should be emphasized that the concern with obtaining a heterogeneous sample in terms of gender was in order to avoid this factor influencing the results, since it is recurrent in the literature that women are more easily subject to sunk cost bias regardless of the circumstances (Ngo & Wing-Ngar Tsang, 1998; Powell & Ansic, 1997).
The average age of the respondents in the three groups was 24, which is explained by the fact that they are all university students. The convergent age prevents this from being a determining variable for the results in each of the groups, since older individuals have a lower tendency to present sunk cost bias (Strough, Schlosnagle, & Didonato, 2011).
Table 2
Descriptive statistics and non-parametric chi-square test of the research variables
Variable Categories Individuals Pairs Trios
1.1 Suppose you won a trip to Natal and subsequently you purchased a travel package to Fortaleza. You expect the trip to Fortaleza to be better. When preparing for the trip, you realize that the packages are scheduled for the same weekend and at this time it is no longer possible to sell either of them. Where would you choose to travel to?
Natal 8.80% 23.30% 12.50%
Fortaleza 91.20% 76.70% 87.50%
c2 (sig.) 0 0.003 0
1.2 Assume that you won a R$3,000.00-worth trip to Natal and that subsequently you purchased a R$2,800.00-worth travel package to Fortaleza. When preparing for the trip, you realize that the packages are scheduled for the same weekend and at this time it is no longer possible to sell either of them. Where would you choose to travel to?
Natal 26.50% 36.70% 31.30%
Fortaleza 73.50% 63.30% 68.80%
c2 (sig.) 0 0.144 0.034
2.1 You are staying at a hotel on vacation, and on a rainy day you end up paying R$8.00 to watch a movie on pay TV. Five minutes into it you are bored, because you do not like the movie. Would you still watch the movie?
Yes 38.20% 30% 38.70%
No 61.80% 70% 61.30%
c2 (sig.) 0.17 0.028 0.209
2.2 You are staying at a hotel on vacation, and on a rainy day you are going to watch a movie. Five minutes into it you are bored, because you do not like the movie. Would you still watch the movie?
Yes 8.80% 16.70% 21.90%
No 91.20% 83.30% 78.10%
c2 (sig.) 0 0 0.001
3 Suppose you are the CEO of an aviation company that has invested in a R$15 million research project to build a new airplane model, but that still lacks R$3 million to make it happen. At that point, another company starts advertising a new and more modern model of airplane than your company’s. Would you invest the rest needed to finalize your company’s research project?
Yes 76.50% 90% 96.90%
No 23.50% 10% 3.10%
c2 (sig.) 0.002 0 0
In observing Table 2, it is possible to notice that the first two questions present the same scenario, however the first one does not show the sunk cost bias because it does not present an already invested value. In addition, the first states that the trip to Fortaleza is better than the trip to Natal, making it easier to choose between the two capitals; that is, a large portion of the participants are encouraged to choose the capital of Ceará as their destination as they learn that it is the best option. This is clearly revealed when the percentage of choice is analyzed, as 91.20% of the individual respondents, 76.70% of the pairs, and 87.50% of the trios chose Fortaleza instead of Natal. On the other hand, when an initial investment is declared, representing the sunk cost, the results are different. Although the
of 30.0%. The fourth variable of the instrument contains the same scenario as the previous question, however without considering that the film had previously been paid for. It is possible to observe that the percentage for the choice between continuing to watch or abandoning the film changed, in that only 8.8% of the individual respondents would choose to continue watching the film, compared to 91.2% who would stop watching it. Similarly, 83.3% of the pairs and 78.1% of the trios would also not continue watching a boring movie if they had not paid for it.
The fifth question of the research instrument also sought to highlight the sunk cost cognitive bias, but without considering a case without an initial investment. Here, the respondents were asked about spending another R$3 million on a project that had already cost R$15 million. Only 3.10% of the trios stated that they would not invest the necessary amount to finalize the company’s research project; that is, they were the ones who made the biggest mistake of considering an irrecoverable value when taking an investment decision. The pairs (with 90%) were the second group to state they would continue investing in a project even though another company was already advertising a more modern model than theirs, followed by the individual respondents (76.5%), making the latter the ones that least presented the bias among the groups surveyed for this variable.
After verifying the percentage differences between each of the categories, the non-parametric chi-square test was performed between the answers for each of the groups. We verified, for example, the degree of association between the two answer options for question 1.2, which were “Natal” and “Fortaleza”. In this case, for the individuals category, the degree of significance of the test was 0.000. For the trios, it was 0.034, and for the pairs, the result was 0.144. This indicates, therefore, that for the individual participants and
for the groups of three people there is a significant difference between the alternatives; that is, they present sunk cost bias, unlike the pairs, who presented a distribution that is similar to the expected distribution.
Conversely, the answers of the individual participants and the trios to question 2.1 were the ones that did not present a different distribution (sig. 0.170 and 0.209, respectively). The other variables presented significant differences regarding the distribution of responses in all the categories surveyed. Finally, when looking for a general relationship between all the results of the chi-square test, we notice that they do not follow any pattern, indicating that the individual decisions, the decisions in pairs, or decisions in trios did not prove to be a differential for sunk cost bias. Similar results were found by Bone et al. (1999), given that the authors did not find any concrete evidence to indicate groups as being better or worse financial decision makers.
Table 3
Descriptive statistics of the sunk cost level variable
Sunk cost level
Individuals Pairs Trios
Frequency Percentage Frequency Percentage Frequency Percentage
0 5 14.70% 2 6.70% 1 3.10%
1 12 35.30% 14 46.70% 14 43.80%
2 15 44.10% 9 30.00% 12 37.50%
3 2 5.90% 5 16.70% 5 15.60%
When analyzing the results shown in Table 3, we first observed that a large portion of the participants incurred bias in one or two cases of the investigated, in that 79.4% of the individual respondents, 76.7% of the pairs, and 81.3% of the trios fell within those two scores. Yet, the most differentiated results are among those who were not subject to bias in any of the questions and those who considered sunk costs in all of them. On the one hand, five people deciding individually did not present the bias in any of the cases, nor did two pairs, who also did not present sunk costs in any of their answers; on the other hand, only one trio was able to make the decision without considering past expenses. Analyzing the opposite situation, five pairs and five trios presented biased behaviors in all scenarios, whereas only two individuals had the same behavior. These results confirm once again that there is no pattern of
behavior in which groups make better decisions than individuals alone, corroborating the evidence presented by Bone et al. (1999) and Shupp and Williams (2008).
Then, similarly to what was done by Arkes and Blumer (1985), the Pearson’s chi-square test was performed to verify the existence of a significant association for each category between the two pairs of categorical variables with the same scenarios, i.e., whether the variables are independent (null hypothesis) or dependent (alternative hypothesis). Thus, in one question for each pair no initial investment was mentioned and in the other question the individual would have already spent some amount on the particular project. According to the authors, it is possible to evaluate the impact of previous investment from the tendency to change the option, revealing the bias. Table 4 shows the results found.
Table 4
Pearson’s Chi-Square Test
Variables Pearson’s Chi-Square Test Individuals Pairs Trios
Question 1.1 versus Question 1.2
Test value 9.14 9.459 10.057
Sig. 0.003 0.002 0.002
Question 2.1 versus Question 2.2
Test value 5.315 7.143 8.42
Sig. 0.021 0.008 0.004
First, it is possible to verify that the null hypothesis was rejected for the two pairs of questions in all categories, that is, both for the individual answers and for the answers in groups. Based on the statistical significance of the test and the results observed in the descriptive
obvious reasons to continue a particular project, when some amount of money has already been spent, individuals tend to continue investing, as opposed to when no money has been spent yet. According to Arkes and Blumer (1985), the fact that investors continue to spend resources may be because they are excessively certain that the project, when completed, will be a financial success, or because they may not perceive the situation as a lost cause. Finally, we realize that, although all the relationships were significant, in the second scenario the level of significance increases with the size of the group, revealing a possible relationship between the size of the group and the decision-making in relation to sunk costs. But this is an assumption, and only the existence of the sunk cost bias in all cases analyzed is definite, confirming that regardless of the decision being made individually or in a group (pairs or trios) there is the incidence of this violation of rationality.
5
Final Considerations
This study aimed to investigate whether joint decision-making is different from individual decision-making when it comes to sunk costs. Considering the descriptive statistics of frequency and percentage of the variables related to sunk costs, it was observed that the notable differences are among those who were not subject to bias in any of the questions and those who considered sunk costs in all of them, given that five people did not individually present the bias in any of the cases and, on the other hand, only one trio succeeded in making a decision without considering past expenses. Analyzing the opposite situation, five pairs and five trios presented biased behaviors in all scenarios, whereas only two individuals had the same behavior. In addition, we have to highlight the questions involving sunk costs in the last two scenarios. In question 2.1, the majority of the individuals did not present the cognitive bias when faced with an initial investment of R$8.00. However, in question 3, the value of the initial investment changes to R$15 million,
which resulted in a change in behavior of the respondents. Thus, we can assume that the amount invested can also represent a differential in decision-making, in addition to having some previous investment or not.
Considering the results of the Pearson’s chi-square test, exposure to an initial investment had a significant effect on the behavior of the participants in the research, considering both the choice of the final destination and whether or not to watch an uninteresting movie, with the significance decreasing in the second scenario, indicating that the trios could be more predisposed to presenting this cognitive distortion. Such results may be an indication that individuals make better decisions in isolation in relation to sunk costs mainly when compared to trios. But, despite some evidence, there were no significant differences capable of solidifying these arguments. Thus, it was not possible to conclude that individual respondents and people who decide in groups make different decisions regarding their investments, thus corroborating some studies already highlighted. Also, it was not possible to prove that the size of the group influences the decision-making.
What is apparent in the results presented here is that all the profiles analyzed showed sunk cost bias; that is, they considered their previous investment to make decisions about the future of the project. Although this is not a new result in the literature, it represents a worrying fact, since the research participants are young students and, as they are enrolled in the courses listed above, their careers will be concentrated in activities closely related to money management.
that a rational choice needs to be consistent and coherent.
As limitations of the research, first, the day-to-day scenarios of the chosen questions stand out, in the sense that if the scenarios were different, such as a financial investment decision in the capital market or the resolution of a complex enigma, the synergy between the participants could have been different. Next, we highlight the reduced size of the sample, which may have influenced the outcome. Finally, the groups investigated were composed of individuals who might have known each other previously, since they were classmates.
As a suggestion for future research, we propose the use of a control variable with the intention of, for example, verifying whether there is any participant with a leadership profile in the surveyed groups, which could influence the response of the other participants. Similarly, we suggest crossing variables related to sunk cost bias with variables that evaluate the individuals’ cognitive system, such as CRT. This way, it would be possible to observe whether groups with more rational individuals are able to present better performance compared to others. Finally, we recommend that the research sample be expanded in order to improve the study of individual and group decision-making in relation to sunk costs, as well as working on the issue of the independence of individuals’ choices within groups, as suggested by the econophysics literature.
Referências
Arkes, H. R., & Blumer, C. (1985). The psychology of sunk cost.Organizational behavior and human decision processes, 35(1), 124-140.
Bernoulli, D. (1954). Exploitation of a new theory on the measurement of risk. Econometrica,
22, 22–36.
Bone, J., Hey, J., & Suckling, J. (1999). Are groups more (less) consistent than individuals?
Journal of Risk and Uncertainty, 18(1), 63-81.
Campos, H. (1976). Estatística experimental não-paramétrica. (2a ed.). Piracicaba: Esalq.
Da Silva, S., & Matsushita, R. (2017). Econofísica. Seattle: KDP Amazon.
Friedman, D., Pommerenke, K., Lukose, R., Milam. G., & Huberman, B. (2007). Searching for the sunk cost fallacy. Experimental Economics, 10(1), 79-104.
Garland, H. (1991). Throwing good money after bad: The effect of sunk costs on the decision to escalate commitment to an ongoing project.
Journal of Applied Psychology, 75(6), 728-731.
Haller, A., & Schwabe, L. (2014). Sunk costs in the human brain.Neuroimage, 97, 127-133.
Kahneman, D., & Tversky, A. (1979). Prospect theory: An analysis of decisions under risk.
Econometrica, 47(2), 263–291.
King, A. J., & Cowlishaw, G. (2007) When to use social information: The advantage of large group size in individual decision making, Biology Letters
3 (2), 137-139.
Keller, J., & Pastusiak, R. (2016). The psychology of investing: Stock market recommendations and their impact on investors’ decisions. Acta Oeconomica, 66(3), 419-437.
Kocher, M. G., & Sutter, M. (2005). The decision maker matters: Individual versus group behaviour in experimental beauty-contest games. The Economic Journal, 115(500), 200-223.
Kugler, T., Kausel, E. E., & Kocher, M. G. (2012). Are groups more rational than individuals? A review of interactive decision making in groups.Wiley Interdisciplinary Reviews: Cognitive Science, 3(4), 471-482.
Le Bon, G. (1896). The crowd: A study of the popular mind. London: Ernest Benn.
List, C.; Pettit, P. (2011). Group Agency: the possibility, design, and status of corporate agents.
Mcafee, R. P., Mialon, H. M., & Mialon, S. H. (2010). Do sunk costs matter? Economic Inquiry, 48(2), 323–336.
Ngo, H. Y., & Wing-ngar Tsang, A. (1998). Employment practices and organizational commitment: Differential effects for men and women?. The International Journal of Organizational Analysis, 6(3), 251-266.
Prates, W. R., Da Costa Jr, N. C. A., & Dorow, A. (2017). Risk Aversion, the Disposition Effect, and Group Decision Making: An Experimental Analysis. Managerial and Decision Economics, 38(7), 1033–1045.
Powell, M., & Ansic, D. (1997). Gender differences in risk behaviour in financial decision-making: An experimental analysis. Journal of economic psychology, 18(6), 605-628.
Rockenbach, B., Sadrieh, A., & Mathauschek, B. (2007). Teams take the better risks. Journal of Economic Behavior & Organization, 63(3), 412-422.
Shupp, S., & Williams, A. W. (2008). Risk preference differentials of small groups and individuals. Economic Journal, 118(525), 258-283.
Smith, C. M., Tindale, R. S., & Steiner, L. (1998). Investment decisions by individuals and groups in sunk cost “situations”: The potential impact of shared representations. Group Processes & Intergroup Relations, 1(2), 175-189.
Strough, J., Schlosnagle, L., & Didonato, L. (2011). Understanding decisions about sunk costs from older and younger adults’ perspectives. Journals of Gerontology Series B: Psychological Sciences and Social Sciences, 66(6),
681-686.
Sutter, M. (2005). Are four heads better than two? An experimental beauty-contest game with teams of different size.Economics letters, 88(1), 41-46.
Sutter, M. (2007). Are teams prone to myopic loss aversion? An experimental study on individual versus team investment behavior. Economics Letters, 97(2), 128-132.
Thaler, R. (1980). Toward a positive theory of consumer choice. Journal of Economic Behavior & Organization, 1(1), 39-60.
Tversky, A., & Kahneman, D. (1981). The framing of decisions and the psychology of choice.
Science, 211, 453-458.
Tversky, A., & Kahneman, D. (1992) Advances in prospect theory: Cumulative representation of uncertainty. Journal of Risk and uncertainty, 5(4), 297-323.
APPENDIX - Research Instrument
UNIVERSIDADE FEDERAL DE SANTA CATARINA
CENTRO SÓCIO-ECONÔMICO
PROGRAMA DE PÓS-GRADUAÇÃO EM ADMINISTRAÇÃO
Number:
Instructions: Mark the alternatives corresponding to your profile with an “x”.
Participant 1 - 1. Age:___________years old. Participant 2 - 1. Age:___________years old. Participant 3 - 1. Age:___________years old.
Participant 1 - 2. Gender: 2.1 ( ) Male. 2.2 ( ) Female. Participant 2 - 2. Gender: 2.1 ( ) Male. 2.2 ( ) Female. Participant 3 - 2. Gender: 2.1 ( ) Male. 2.2 ( ) Female.
Instructions: Next, we present questions for you to put an “x” beside the alternative of your choice. We emphasize that there is no right answer and that the choice is yours.
1.1 Suppose you won a trip to Natal and subsequently you purchased a travel package to Fortaleza. You expect the trip to Fortaleza to be better. When preparing for the trip, you realize that the packages are scheduled for the same weekend and now it is no longer possible to sell either of them. Where would you choose to travel to?
1.1.1 ( ) Natal 1.1.2 ( ) Fortaleza
1.2 Assume that you won a R$3,000.00-worth trip to Natal and that subsequently you purchased a R$2,800.00-worth travel package to Fortaleza. When preparing for the trip, you realize that the packages are scheduled for the same weekend and now it is no longer possible to sell either of them. Where would you choose to travel to?
2.1 You are staying at a hotel on vacation, and on a rainy day you end up paying R$8.00 to watch a movie on pay TV. Five minutes into it you are bored, because you do not like the movie. Would you still watch the movie?
3.1.1 ( ) Yes 3.1.2 ( ) No
2.2 You are staying at a hotel on vacation, and on a rainy day you are going to watch a movie. Five minutes into it you are bored, because you do not like the movie. Would you still watch the movie?
3.1.1 ( ) Yes 3.1.2 ( ) No
3 Suppose you are the CEO of an aviation company that has invested in a R$15 million research project to build a new airplane model, but that still lacks R$3 million to make it happen. At this point, another company starts advertising a new and more modern model of airplane than your company’s. Would you invest the rest needed to finalize your company’s research project?
About the Authors:
1. Ana Luiza Paraboni, Master in Administration, Federal University of Santa Catarina, Brazil. E-mail: [email protected]
ORCID
0000-0001-5997-1889
2. Jéssica Pulino Campara, Master in Administration, Federal University of Santa Maria, Brazil. E-mail: [email protected]
ORCID
0000-0002-0283-9243
3. Newton Carneiro Affonso da Costa Jr., PhD in Administration, School of Administration of the Getúlio Vargas Foundation, Brazil. E-mail: [email protected]
ORCID
0000-0001-7723-2676
4. Marcus Vinicius Andrade de Lima, Ph.D. in Production Engineering, Federal University of Santa Catarina, Brazil. E-mail: [email protected]
ORCID
0000-0001-5422-1093
Contribution of each author
Contribution Ana Luiza
Paraboni
Jéssica Pulino Campara
Newton Carneiro Affonso da Costa Jr.
Marcus Vinicius Andrade de Lima
1. Definition of research problem √ √ √ √
2. Development of hypotheses or research questions
(empirical studies) √ √ √
3. Development of theoretical propositions
(theoretical Work) √ √ √
4. Theoretical foundation/ Literature review √
5. Definition of methodological procedures √ √ √
6. Data collection √ √ √
7. Statistical analysis √ √
8. Analysis and interpretation of data √ √
9. Critical revision of the manuscript √ √ √ √
10. Manuscript Writing √ √