Mestre em Engenharia Física
Plasmonic Silver Nanoparticles by
Dewetting process: Applications in SERS
and Thin Film Solar Cells
Dissertação para obtenção do Grau de Doutor em Nanotecnologias e Nanociências
Orientador: Doutor Rodrigo Ferrão de Paiva Martins, Professor
Catedrático, Faculdade de Ciências e Tecnologia da
Universidade Nova de Lisboa
Co-orientador: Doutor Hugo Manuel Brito Águas, Professor Auxiliar,
Faculdade de Ciências e Tecnologia da Universidade
Nova de Lisboa
Júri:
Presidente:Doutor José Julio Alferes
Vogais:Doutor Adélio Miguel Magalhães Mendes Doutor Rodrigo Ferrão de Paiva Martins Doutora Elvira Maria Correia Fortunato Doutor Tito Da Silva Trindade
Doutora Eulália Fernanda Alves De Carvalho Pereira Doutora Maria Goreti Ferreira Sales
Doutor Pedro Manuel Parracho Salomé Doutor Manuel João De Moura Dias Mendes
i
Mestre em Engenharia Física
Plasmonic Silver Nanoparticles by
Dewetting process: Applications in SERS
and Thin Film Solar Cells
Dissertação para obtenção do Grau de Doutor em Nanotecnologias e Nanociências
Orientador: Doutor Rodrigo Ferrão de Paiva Martins, Professor
Catedrático, Faculdade de Ciências e Tecnologia da
Universidade Nova de Lisboa
Co-orientador: Doutor Hugo Manuel Brito Águas, Professor Auxiliar,
Faculdade de Ciências e Tecnologia da Universidade
Nova de Lisboa
Júri:
Presidente:Doutor José Julio Alferes
Vogais:Doutor Adélio Miguel Magalhães Mendes Doutor Rodrigo Ferrão de Paiva Martins Doutora Elvira Maria Correia Fortunato Doutor Tito Da Silva Trindade
Doutora Eulália Fernanda Alves De Carvalho Pereira Doutora Maria Goreti Ferreira Sales
Doutor Pedro Manuel Parracho Salomé Doutor Manuel João De Moura Dias Mendes
iii
Plasmonic Silver Nanoparticles by Dewetting process: Applications in SERS and Thin Film Solar Cells
Copyright: Andreia Cristina Jóia Araújo Cardoso
FCT/UNL e UNL
v
People often say that scientific research is a lonely work but the way I see it, there are so many people around the laboratories that contributed to this work and to whom I want to thank to.
First I want to acknowledge my supervisors for their support, advice and guidance throughout this work. Their complementarity in scientific and teaching expertise and their shared enthusiasm for science contributed a lot to my professional and personal growth. Prof. Rodrigo Martins, for the opportunity to develop this work within the group, for his effort to provide all the necessary means for the success of this research investing in lab facilities and for helping me in all goals of this thesis. Thank you for the trust deposited in me and in my work. Dr. Hugo Águas, for his friendship, sharing information and kind observations along all these years. Thank you for believing in me and in my work. This work is also yours.
To Prof. Elvira Fortunato, for allowing the development of this work in the research facilities of CENIMAT/I3N and for all her help and friendship. Thank you for all the support you have given me writing scientific papers, I’ve learned a lot from you. Thank you for all the new equipment you have acquired for my PhD, they largely contributed for the results on this thesis.
To Dr. Manuel Mendes, for sharing his knowledge on plasmonics and metal nanoparticles. Thank you for the hours that we discuss the near and the far field. This work wouldn’t be the same without you.
To MSc. Tiago Mateus, Dr. Ana Pimentel and Dr. Daniela Nunes friends and lab mates, group work makes a lot of difference, your contribution to this work was indispensable.
To former colleagues whose support and friendship surpassed distance; Dr. Raquel Barros, Dr. Lidia Santos, Dr. Sergej Filonovich and future Dr. Catarina Santos.
vi
To Susana Mendes, Valéria Gomes, Sara Oliveira and Sónia Soares for their friendship and professionalism, making logistics a lot easier.
To Prof. Ricardo Franco for sharing his knowledge on SERS which was very helpful during this PhD.
To the Fundação para a Ciência e Tecnologia (FCT) for the fellowship and CENIMAT/ I3N- CEMOP/UNINOVA for the financial support for conferences attendance.
To all my friends for their comprehension and support. To MSc. Sónia Pereira, MSc. Alexandra Gonçalves, future Dr. Ana Marques, Dr. Daniela Nunes, Dr. Ana Pimentel (my scientific wedding) and future Dr. Daniela Salgueiro (you’re up next!); companions during this years in the lab.
To my family: to my brothers Hélder, Sandra e José, my parents Antonieta e José and my nephews Nikole and Júnior, I wouldn’t be who I am today without all of you. I want to thank my husband Bruno and my son James, thank you for all the patience and understanding my love for science.
I want to thank and dedicate this work to my brother Zézinho. I hope it to be worthy of the pride you had in me.Thank you for the strength that you gave me to write this thesis days after you left us. See you soon my love.
vii
Em termos da exploração de materiais à nano escala, e sua integração em dispositivos optoelectrónicos, novas estratégias têm sido desenvolvidas na área da nanofotónica, baseadas em efeitos plasmónicos, consideradas como solução ideal para ultrapassar limitações importantes relacionadas com o desempenho dos dispositivos em diferentes tipos de aplicações. Os efeitos explorados ao longo deste trabalho estão relacionados com o aumento da eficiência de células solares de silício (Si) de filme fino e de sinais de Raman para deteção molecular, recorrendo à utilização de nanopartículas metálicas (MNP) de prata (Ag), que são as que proporcionam o melhor efeito plasmónico para estas aplicações (células solares e espectroscopia de Raman).
viii
Palavras-chave: plasmonica; nanoparticulas de prata; aprisionamento de luz em celulas solares de filme fino; SERS; solid-state dewetting; substratos à base de
ix
The exploration of materials at the nanoscale, and their integration into optoelectronic devices, can be developed via new nanophotonic strategies based on plasmonic effects, which are nowadays regarded as the preferential solutions to overcome performance limitations in different types of applications. Those explored here concern the increase of efficiency of physically thin film silicon (Si) solar cells and of weak Raman signals for molecular detection (one scattered photon per million incident), employing metal nanoparticle (MNP) structures made of silver (Ag) which is the most effective material for plasmon-enhancement in solar cells and Raman Spectroscopy.
The present thesis explored these effects employing thermal evaporation assisted by electron beam (e-beam) to deposit uniform thin layers of Ag, which then underwent a thermally-induced morphology transformation from a thin film (TF) to an array of NPs by a solid-state dewetting (SSD) mechanism. A novel procedure, involving a one-step methodology, without any post-deposition thermal procedures, is presented. This resulted in the direct arrangement of individual nanoparticles suitable for Raman amplification, with good control of their size and shape. The nanostructures that require a post-annealing process were essentially used for light trapping in solar cells. In this case a rapid thermal annealing (RTA) method was developed that yields highly reproducible and uniform plasmonic surfaces within a very fast (<10 min) annealing time when compared to other commonly employed annealing processes (>1 hour). The final results showed that microcrystalline silicon (µc-Si:H) solar cells deposited on improved ultra-fast plasmonics back reflectors (PBR), with Ag NPs with sizes of about 200 nm, exhibit an overall 11% improvement on device efficiency, corresponding to a photocurrent of 24.4 mA/cm2 and an efficiency of 6.78 %; against 21.79 mA/cm2 and 6.12 %, respectively, obtained on flat structures without NPs. For surface enhanced Raman spectroscopy (SERS) application, a remarkable 109 signal enhancement was obtained using rhodamine 6G (10-8 M) as the test analyte, and a new kind of cost-efficient SERS substrate (cardboard plates) was investigated for low-cost, flexible and disposable bio-detection devices. Besides such advantages, cardboard substrate proved to be a high-efficient, uniform and stable SERS substrate.
xi
The work presented in this thesis focuses mainly in the implementation of MNPs by dewetting processes for plasmon-enhancement in Si solar cells and Raman spectroscopy. The first part of the thesis focuses on the development of metallic nanostructures to achieve light trapping in thin Si photovoltaics (PV) cells, with the objective of reducing the absorber-layer thickness while improving cell performance. Reducing the absorber-layer thickness not only reduces costs but also improves the electrical characteristics of the solar cell. By doing so, we can contribute to overcome today’s efficiency limitations related to the use of physically thin silicon solar cells by making them optically thick. To reach this goal, we study the incorporation of a MNP plasmonics layer in µc-Si solar cells. On other hand, for SERS substrates, the optimal MNP sizes and inter-particle distances are much smaller than for Si cells, so a low-temperature nanoparticle formation method, largely applied to cellulose based substrates, was employed. Different types of cellulose substrates for SERS were investigated and their influence on the SERS signal, uniformity and stability was analyzed. Different strategies to enhance SERS signal were attempted, consisting in varying the inter-Ag-NPs gaps, sensing area, surface coverage (SC) of Ag NPs or employing new architectures, like 3D structures.
Within these broad themes, this study has a specific number of objectives: (1) Deposition and characterization of Ag nanoparticles for Si solar cells; (2) Development and characterization of plasmonic back reflector configuration to be integrated on solar cell devices; (3) – Optimization of plasmonic Ag NPs on cellulose based substrates to be used for SERS detection (4); SERS device fabrication.
In chapter 1 an overview of topics from plasmonics, PV and SERS is presented,
serving as a background for the experimental studies described in the following chapters. The plasmonics concepts are reviewed and the different aspects relating plasmonics NPs to PV and SERS are discussed.
Chapter 2 describes the production and characterization techniques used during the research work of this dissertation, mostly highlighting thermal evaporation, morphological and optical characterization of Ag NPs, solar cells and SERS substrates. The experimental study begins with a systematic investigation, presented in
chapter 3, of the correlation between the structural and the optical properties of
xii
morphological and optical properties correlated with the substrate conductivity and roughness. Finally, the structural and optical properties of the best-obtained structures on AZO are analyzed. Next, the self-assembled Ag NPs are integrated in thin film silicon solar cells to form a PBR. First, the role of the RTA heating rate on the NPs production is studied, in order to understand the formation of Ag NPs with favorable monodispersed geometries and design routes to produce PBRs by an ultra-fast RTA process. After the establishment of the best conditions, we investigated the influence of the thicknesses of the AZO spacer/passivating layers between NPs and rear mirror, and between NPs and silicon layer, on the morphological and optical performance of the PBRs; and consequently on the performance of the solar cells. The performance of the PBRs was carefully adjusted, to yield maximum light trapping (low parasitic absorption and high near-infrared scattering) with minimum degradation of the cells’ electrical properties.
The use of Ag NPs on cellulose based substrates, to be integrated in SERS devices, starts in chapter 4. The potential of a new kind of cost-efficient SERS
substrate, called cardboard substrate (grammage exceeds 200–800 g m−2, thickness above 300 µm), is evaluated. The morphology, size, and distribution of the Ag NPs are assessed, and their influence on the SERS signal is investigated by correlation with electromagnetic simulations and the measured optical properties. Strategies to increase the uniformity and reducing/suppressing instability of the substrates are also presented. Next, a simple strategy to enhance SERS signal on cellulose substrates is tested. We start the study with a standard cellulose substrate (grammage in the range of 80 g m−2 and 100 µm thick), with the particularity of the absence of a metal layer. Nanorods (NRs) of ZnO were directly grown on the raw substrates by a microwave heating technique and decorated with Ag NPs. In a separated experiment, a substrate without NRs was subject to the same NPs deposition. The size and distribution of the NPs as well as ZnO NRs sensing area and inclination are investigated, and their influence on the SERS signal is discussed. At the end, a pilot study on the best substrate will be done. The best substrates and configurations described in the previous sections were used for such tests.
Chapter 5 summarizes the findings and conclusions of this thesis and
xiii
As first author
[1] Araújo A, Mendes M J, Mateus T, Costa J, Nunes D, Água H and Martins R 2018 Ultra-fast plasmonic back reflectors production for light trapping in thin Si solar cells Solar Energy, accepted for publication.
[2] Pimentel A†, Araujo A†, Beatriz J, Coelho D N, Oliveira M J, Mendes M J, Águas H, Martins R and Fortunato E 2017 3D ZnO/Ag Surface-Enhanced Raman Scattering on Disposable and Flexible Cardboard Platforms Materials10 1351
[3] Araújo A, Pimentel A, Oliveira M J, Mendes M J, Franco R and Fortunato, Elvira, Águas, Hugo, Martins R 2017 Direct growth of plasmonic nanorod forests on paper substrates for low-cost fl exible 3D SERS platforms Flex. Print. Electron.2 014001
[4] Araújo A, Mendes M J, Mateus T, Nunes D, Calmeiro T, Fortunato E, Hugo A and Martins R 2016 Influence of the Substrate on the Morphology of Self-Assembled Silver Nanoparticles by Rapid Thermal Annealing J. Phys. Chem. C
120 18235–42
[5] Araújo A, Caro C, Mendes M J, Nunes D, Fortunato E, Franco R, Águas H and Martins R 2014 Highly efficient nanoplasmonic SERS on cardboard packaging substrates. Nanotechnology25 415202
[6] Araújo A, Barros R, Mateus T, Gaspar D, Neves N, Vicente A, Filonovich S a, Barquinha P, Fortunato E, Ferraria A M, Botelho do Rego A M, Bicho A, Águas H and Martins R 2013 Role of a disperse carbon interlayer on the performances of tandem a-Si solar cells Sci. Technol. Adv. Mater.14 045009–17
As co-author
[7] Vicente A T, Araújo A, Mendes M J, Nunes D, Oliveira M J, Sanchez-Sobrado O, Ferreira M P, Águas H, Fortunato E and Martins R 2018 Multifunctional Cellulose-Paper for Light Harvesting and Smart Sensing Applications J. Mater. Chem. C DOI: 10.1039/C7TC05271E
[8] Wannes H Ben, Zaghouani R B, Ouertani R, Araújo A, Mendes M J, Aguas H, Fortunato E, Martins R and Dimassi W 2018 Materials Science in Semiconductor Processing Study of the stabilizer influence on the structural and optical properties of sol-gel spin coated zinc oxide films Mater. Sci. Semicond. Process.74 80–7
[9] Pimentel A, Samouco A, Araujo A, Nunes D, Martins R and Fortunato E 2017 Ultra-Fast Microwave Synthesis of ZnO Nanorods on Cellulose Substrates for UV Sensor Applications Materials 4–10
xiv
silver nanostars - an alternative cost effective platform for trace analyte detection by SERS Sci. Rep.7 1–14
[12] Mendes M J, Araújo A, Vicente A, Águas H, Ferreira I, Fortunato E and Martins R 2016 Design of optimized wave-optical spheroidal nanostructures for photonic-enhanced solar cells Nano Energy26 286–96
[13] Vicente A, Águas H, Mateus T, Araújo A, Lyubchyk A, Siitonen S, Fortunato E and Martins R 2015 Solar cells for self-sustainable intelligent packaging J. Mater. Chem. A3 13226–36
[14] Gaspar D, Pimentel A C, Mendes M J, Mateus T, Falcão B P, Leitão J P, Soares J, Araújo A, Vicente A, Filonovich S A, Águas H, Martins R and Ferreira I 2014 Ag and Sn Nanoparticles to Enhance the Near-Infrared Absorbance of a-Si:H Thin Films Plasmonics9 1015–23
[15] Gaspar D, Pimentel A C, Mateus T, Leitão J P, Soares J, Falcão B P, Araújo A, Vicente A, Filonovich S a, Aguas H, Martins R and Ferreira I 2013 Influence of the layer thickness in plasmonic gold nanoparticles produced by thermal evaporation. Sci. Rep.3 1469–73
Book chapters
xv
Chapter 1. Introduction 1
1.1 Plasmonics 3
1.1.1 Maxwell’s equations and the dielectric function of the free electron 4
1.1.2The Drude theory of metals 6
1.1.3 Localized Surface Plasmon Resonance 8
1.1.4 Sub-wavelength metal particles 10
1.2 Si solar cells enhanced by plasmonics 12
1.2.1 Energy challenge 12
1.2.2 Renewable Energy 14
1.2.3 Photovoltaics 15
1.2.4 Silicon photovoltaic technology 17
1.2.5 Fundamentals of solar cell operation 18
1.2.6 Light trapping 24
1.3 Surface enhanced Raman spectroscopy 25
1.3.1 Background 25
1.3.2 Basic principles of SERS detection 26
1.3.3 Cellulose based substrates 27
1.3.4 Cellulose-based SERS substrates 28
1.3.5 Solution processed SERS substrates 29
1.3.6 Physically processed SERS substrates 32
Chapter 2. Fabrication and Characterization Techniques 35
2.1. Nanoparticles fabrication 37
2.1.1 Metal thin films deposition by electron-beam evaporation 37
2.1.2 Solid-state dewetting 38
xvi
2.2 Ag NPs characterization techniques 41
2.2.1 Morphological characterization 42
2.2.2 Optical characterization 44
2.3 Oxide thin films deposition 45
2.3.1 Magnetron sputtering 45
2.4Complementary characterization 47
2.4.1 X-ray diffraction (XRD) 47
2.4.2 Simultaneous Thermal Analysis (STA) 48
2.5 Fabrication and characterization of SERS devices 49
2.5.1 Raman measurements 49
2.5.2 Preparation of samples for SERS measurements 51
2.5 Solar cell fabrication and characterization 53
2.5.1 Implementation of Ag NPs in the PBR configuration 53
2.5.2 Solar cell fabrication by PECVD 54
2.5.3 Solar cell characterization 55
Chapter 3. Silver Nanoparticles by Dewetting Process for Thin Film Si Solar Cells Application
59
3.1 Introduction 61
3.2 Influence of the substrate on the morphology of self-assembled Silver Nanoparticles
63
3.2.1 Sample preparation 64
3.2.2 Morphological and optical properties of Ag NPs deposited on glass and oxides surfaces
65
3.2.3Correlation between contact angle and morphological properties 69
3.2.4 Effect of Surface roughness 70
3.2.5 Effect of the surface conductivity 71
3.3 Ultra-fast plasmonics back reflector production for TF Si solar cells application
72
xvii
3.3.3 Effect of the AZO spacer layer between Ag film and Ag NPs on TF µc-Si solar cell performance
77
3.3.4 Effect of the AZO spacer layer between Ag NPs and n-doped layer on TF µc-Si solar cell performance
82
3.4 Conclusions 83
Chapter 4. Silver Nanoparticles by Dewetting Process for SERS Application
85
4.1 Highly efficient nanoplasmonic SERS on cardboard packaging 87
4.1.1 Introduction 87
4.1.2 Sample preparation 89
4.1.3 Ag nanoparticles formed on cardboard substrate 89
4.1.3.1 Substrate characterization 89
4.1.3.2Morphological and optical properties of NPs 91
4.1.4 Near field light enhancement 93
4.1.5 Implementation of plasmonic cardboard substrate as SERS device 95
4.1.5.1 Maximum SERS intensity with an excitation wavelength λexc. 95
4.1.5.2 SERS device characterization 96
4.1.5.3 Uniformity and stability of the cardboard substrate 97
4.1.6 Conclusions 98
4.2 3D ZnO/Ag surfaces for disposable and flexible SERS substrate 99
4.2.1 Introduction 99
4.2.2 Direct growth of plasmonic nanorod forests on paper substrate for low-cost flexible 3D SERS platforms
100
4.2.2.1 Sample preparation 100
4.2.2.2Paper characterization 102
4.2.2.3ZnO nanorods growth on paper and glass substrate 103
4.2.2.4Decoration of Ag Nanoparticles on ZnO Nanorods paper substrate
xviii
4.2.2.5 Implementation of plasmonic paper substrate as SERS device 107
4.2.2.6 Conclusions 111
4.2.3 3D ZnO/Ag Surface-Enhanced Raman Scattering on Disposable and Flexible Cardboard Platforms
112
4.2.3.1 Sample preparation 112
4.2.3.2 ZnO nanorods characterization 113
4.2.3.3 Decoration of Ag nanoparticles on ZnO NRs cardboard substrate
119
4.2.3.4 Implementation of 3D cardboard substrate as SERS device 121
4.2.3.5 Conclusions 125
Chapter 5. Conclusionsand Future Perspectives 127
xix
Figure 1.1 Schematic illustration of the different types of plasmons on metal materials with dimensions from macroscale to nanoscale. (a) volume plasmons in a bulk material, (b) bulk metal in contact with a dielectric, sustaining SPP and (c) LSPR, generated in metallic nanoparticles, dominated by surface effects. ... 4
Figure 1.2 Drude model fit to the experimental data of Ag [40] according to the equations 1.20 with the following fitting parameters
ε
i n t= 3.7,ω
p= 9.2 eV,γ
= 0.02 100 THz. The dashed curve represents the threshold frequency for interband transition at 3.9 eV, indicating the limit for the validity of the free-electron model. ... 8Figure 1.3 Schematic of the distribution of the electric field inside and outside of an arbitrary sized nanoparticle. ... 9
Figure 1.4 Sketch of a spherical particle with radius a and complex dielectric function ( )
ε ω
placed in homogeneous mediumε
m. ... 10Figure 1.5 Relationship between GDP per capita and primary power consumption per capita for world regions [26].. ... 13
Figure 1.6 Human Development by Country versus Per Capita Power Consumption [26]. ... 14
Figure 1.7 Global investment in power generation and electricity networks (coloured bars, left axis) and electricity demand growth (line, right axis). Source: World Energy Investment 2016, IEA ... 15
Figure 1.8 Cost projections for photovoltaic electricity. The upper boundary of photovoltaic costs reflects the meteorological situation of Germany, the lower boundary that of Southern Europe [32]. ... 16
Figure 1.9 The spectral irradiance for extraterrestrial (AM0), terrestrial global (AM 1.5G) and direct (AM 1.5D) solar radiation defined in the standard ASTM G173-03. 19
Figure 1.10 nip and pin designs in thin film silicon solar cells ... 21
Figure 1.11 The current-voltage (I-V) characteristics of illuminated solar cell showing the operating parameters, short-circuit current (ISC) and open-circuit voltage (VOC).
Inset: equivalent circuit of an ideal solar cell. ... 21
Figure 1.12 Simplified Equivalent Circuit Model for a Photovoltaic Cell with parasitic resistances ... 23
Figure 1.13 Illustration of SERS and of the LSPR effect. This consists in the collective oscillation of the conduction electrons in a MNP in resonance with the frequency of incident light. The colour plot at the bottom corresponds to the electric field intensity profile in the inter-space of a dimer with two Au nanospheres having a separation of 1 nm. The colour scale is logarithmic [100]. ... 27
xx
filled with a colloidal solution to directly write SERS arrays on paper substrates[129]. 3) Schematic representation of the fabrication process of the plasmonic SERS paper substrates by drop-casting colloidal solutions of Ag nanostars (inset shows the TEM of a single nanostar) [157]. 4) (a) TEM image of oleylamine-capped Au NPs, (b) Photograph of Au NP doped filter papers by the dip coating method [136]………31
Figure 2.1 Schematic of a thermal evaporation system assisted by electron beam. .... 38
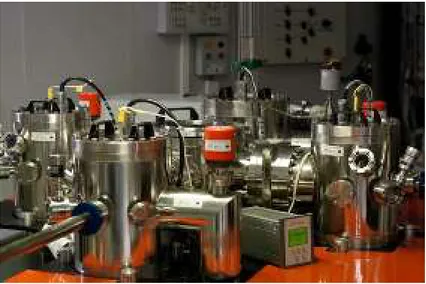
Figure 2.2 Homemade thermal evaporator assisted by electron beam used for the deposition of silver thin layers. ... 38
Figure 2.3 Schematic drawing of the solid-state dewetting process on a TCO-coated glass substrate. ... 39
Figure 2.4 As-One 100 rapid thermal process existent in CEMOP/CENIMAT ... 41
Figure 2.5 Zeiss Auriga CrossBeam system – SEM-FIB in CENIMAT ... 43
Figure 2.6 Asylum MFP3D atomic force microscope system existent in CENIMAT. . 44
Figure 2.7 Lambda 950 double beam UV–Vis-NIR spectrometer system existent in CENIMAT. ... 45
Figure 2.8 Schematic of a sputtering deposition system. ... 46
Figure 2.9 Homemade magnetron sputtering system used for the deposition of oxide thin layers. ... 47
Figure 2.10 Panalytical X’Pert PRO diffractometer system existent in CENIMAT…….48
Figure 2.11 TGA - DSC - STA 449 F3 Jupiter system existent in CENIMAT………49
Figure 2.12 Schematic of Raman Spectroscopy and energy diagram representing (from left to right) the infrared absorption, elastic Rayleigh scattering and the inelastic anti-Stokes (left) and Stokes (right) Raman scattering with , ± and referring to the frequencies of the incident light, the Raman scattered light, and the molecular vibration, respectively. ... 50
Figure 2.13 Renishaw InVia Qontor Confocal Micro-Raman microscope existent in CEMOP. ... 51
Figure 2.14 Schematic structure of a PBR consisting of the following layers stack: glass/Ag/AZO/Ag NPs/AZO. There are two AZO layers in a plasmonic BR: One layer goes below the Ag NPs, separating the Ag planar film from the Ag NPs, with a thickness
d Ag-NPs, and the other layer is above the Ag NPs, separating the Ag NPs from the Si cell
layers (not shown) deposited on top, with a thickness d NPs-Si. The inset shows an SEM
close-up image of the Ag NPs on an uncoated PBR. ... 53
Figure 2.15 ELECTTRORAVA PECVD system existent in CEMOP used for the deposition of the Silicon thin layers. ... 54
xxi
(Bottom). ... 67
Figure 3.1 Matrix of SEM images showing the Ag NPs obtained via dewetting of ultrathin films at 500 °C, deposited on distinct surfaces. The Ag precursor film thickness is indicated at the top and the different surface materials are shown on the left. The thickness of the TCO layers (ZnO, GZO, AZO) beneath the MNPs is 30 nm for all cases. ... 65
Figure 3.2 Morphological and optical properties of the MNP arrays of Figure 3.1, formed from 6 nm Ag precursor films deposited on glass, ZnO, GZO and AZO (displayed respectively from top to bottom). (a) Histograms of the size distribution with the indication of the surface coverage (SC). (b) Optical properties of the nanostructures, showing the LSPRs spectral extension. ... 67
Figure 3.3 EDS point analyses (left side) and EDS X-ray maps of Ag, Zn and Al (right side) obtained on the AZO substrate and Ag MNPs formed. This analysis reveals that there are no traces of Ag material remaining in the inter-particle spaces after annealing. ... 68
Figure 3.4 Morphology of self-assembled Ag MNPs formed from 6 nm of Ag at 500 °C on AZO substrate. (a) Cross section SEM tilted by 90°, showing close-up images of the Ag NPs and the equilibrium contact angle. (b) Histogram of the height distribution measured by AFM analysis. (c) AFM height profile of an Ag MNP across the center; inset: AFM scan on a 2 × 2 µm2 area. ... 69
Figure 3.5 Dependence of the average Ag MNP size and surface coverage on the substrate electrical conductivity. The red and black lines are guides to the eyes The points in the plot for MD and SC have an associated error estimated by analyzing, for each point, sets of 3 samples fabricated with the same parameters.……….71
Figure 3.6 Top: AFM scans on 2.5 × 2.5 µm2 areas of distinct AZO layers with 30, 90
and 120 nm thickness. The root mean square (RMS) surface roughness values and the electrical conductivity (σ) of the AZO layers are indicated in each image. Bottom: SEM images of Ag NPs. ... 72
Figure 3.7 Schematic structure of a PBR consisting in the following layers stack: glass/Ag/AZO/Ag NPs/AZO. The bottom AZO layer below the Ag NPs separates the Ag planar mirror from the NPs, with a thickness d Ag-NPs. The other layer above the Ag NPs separates them from the µc-Si:H layers of the cell, with a thickness dNPs-Si. The
inset is a tilted SEM showing close-up images of the Ag NPs on an uncoated PBR….73
Figure 3.8 SEM images of Ag NPs formed on 30 nm AZO coated on glass after annealing at 500 ◦C from 6 nm precursor films with different temperature ramp-up rate and 2 min of annealing time. ... 75
Figure 3.9SEM images of Ag NPs formed after annealing (2 min) of precursor films with a thickness of 6 nm at 600 °C, 700 °C and 800 °C using the same temperature ramp rate (150 °C/s). ... 76
xxii
Figure 3.11 SEM images of Ag NPs deposited on PBR configuration (glass/Ag/AZO) for thicknesses of AZO (d Ag-NP) between 30 and 140 nm. The NPs are formed after
annealing of precursor films with a thickness of 6 nm for 10 min at 500 °C with a temperature ramp rate of 150 °C/s. ... 78
Figure 3.12 SEM images of Ag NPs deposited on PBR configuration (glass/Ag/AZO) for thicknesses of AZO (d Ag-NPs) lower than 30 nm. The NPs are formed after annealing
of precursor films with a thickness of 6 nm for 10 min at 500 °C with a temperature ramp rate of 150 °C/s. ... 79
Figure 3.13 (a) Total reflectance (˂RTOT˃) and diffuse reflectance ˂RDIF˃ averaged over
the 600 –1200 nm spectral range for Ag NPs formed from 6 nm thick Ag films, at the same temperature and ramp-up rate (500 °C at 150 °C/s) during 10 min, with varying thickness of AZO layer between the mirror and the particles (d Ag-NPs) The plotted points
have an associated error bar estimated by analyzing, for each point, sets of 3 samples fabricated with the same parameters……...79
Figure 3.14 (a) SEM of the solar cell inner cross-section obtained by milling the layers with FIB, showing a zoom on an MNP embedded in the AZO layers. The solar cells deposited on the PBRs, depicted in (b), present ~200 nm hemispherical corrugations/domes on the top IZO surface (see tilted SEM in (c)) formed from the conformal deposition of material over the NPs (cross sectional SEM in (d)). ... 80
Figure 3.15 (a) Total reflection (RTOT) and diffuse reflectance (RDIF) of plasmonic BRs
with d Ag-NPs of 40 and 100 nm. EQE (b) and total absorption (1 – R) (c) curves of 1.5
µm thick µc-Si:H solar cells deposited on planar and in two plasmonic back reflectors with AZO thickness d Ag-NPs of 40 and 100 nm. The photocurrent density (Jph) values of
the solar cells are indicated in (c). ... 81
Figure 3.16 EQE of solar cells deposited on the PBRs with 30 and 60 nm thick AZO layers on top of the Ag NPs. The inset table shows the J-V parameters of the solar cells. ... 83
Figure 4.1 Schematic of the production of Ag NPs by e-beam on cardboard substrates, for SERS application………...89
Figure 4.2 (a) SEM and (b) AFM images showing the cardboard packaging surface at two distinct magnifications. (c) SEM images showing the uniformly dense surface of cardboard substrates covered with Ag NPs obtained from different Ag mass thickness, and (d) corresponding AFM images………...90
Figure 4.3 Temperature-dependent mass change (TG), and heat flux (DSC) signal of cardboard substrate ... 91
Figure 4.4 Histogram distributions of the Ag NPs for the 2 (a), 4 (b), 6 (c) and 8 (d) nm mass thicknesses. The values for the average size (in-plane major axis, D) of the deposited Ag NPs are indicated for samples with 2, 4 and 6 nm mass thickness. Mass thicknesses of 8 nm or higher resulted in heterogeneous dispersions of NP sizes, for which the average size is not presented……… ... 92
xxiii
function of the particle diameter (D). The sphere is illuminated by a plane wave with wavevector K0 and is immersed in an uniform medium with an effective refractive
index between alumina (Al2O3) and air. Dashed line – Integral of |ES2|/E02| along the
solid line on the surface of the sphere, in the E0, K0 plane. ... 94
Figure 4.7 Absorptance spectra of SERS substrates with 4 nm (A), 6 nm (B), and 8 nm (C) mass thickness of Ag after deposition of R6G, showing the ideal wavelength (λmax)
for maximum SERS intensity with an excitation wavelength λexc. ... 95 Figure 4.8 (a) SERS spectra of the cardboard packaging substrates coated with and without (Reference) NPs, in the presence of R6G (trace labels). (b) Enhancement factor (EF) as a function of mass thickness. ... 97
Figure 4.9 (a) SERS spectra of 10-6 M R6G acquired from the best-performing 6 nm Ag
mass thickness substrate, at 6 randomly selected spots. Each curve represents the average from five individual spectra measured at the vicinity of each spot. (b) Values of the integral of the 1360 cm-1 peaks in the 6 spectra of (a). The red line indicates the
average of the 6 spectra and the gray region represents a 5% variation interval. ... 97
Figure 4.10 (a) SERS spectra of 10-6 M R6G acquired from arrays stored over a six
months under ambient conditions. Each data point represents the average value from five SERS spectra, (b) Enhancement Factor (EF) and error bars showing the standard deviations. ... 98
Figure 4.11 Schematic drawing of the fabrication of SERS platforms on paper, composed of ZnO NRs covered with Ag NPs. In the first step, crystalline ZnO seeds are deposited by sputtering on paper, followed by the growth of ZnO NRs via a hydrothermal technique. Secondly, Ag NPs are spontaneously formed throughout the rods upon thermal evaporation of a thin Ag layer. ... 101
Figure 4.12 Raw paper characterization. (a) SEM images at a low and high magnifications, showing its fibrous morphology; (b) SEM images (artificial colored) together with the corresponding X-ray maps of Cl, C, Na and O species; (c) XRD diffractogram. The inset is the image of the paper used as substrate; (d) 3D profilometer on a 1×1 µm area. ... 102
Figure 4.13 Temperature-dependent mass change, TG (%) (black line), and heat flux (DSC) signal of the paper substrate between room temperature and 550 °C (blue line). ... 103
Figure 4.14 Surface (a,c) and cross-section (b,d) SEM images of the ZnO nanorods directly grown on paper substrate. XRD pattern (e) of the sample and amplification (f) of the pattern in the 30-40 degrees range. ... 104
Figure 4.15 Cross-section (a) and (b) surface SEM images of the ZnO nanorods grown on glass substrate. Inset: XRD pattern and the respectively crystallite sizes of ZnO thin films (seed layers) on glass and paper substrate, obtained with Scherrer’s equation. ... 105
xxiv
nm. Inset: Detail of the SPR peaks with subtracted linear baseline and SEM images of the paper substrate and the arrays of ZnO nanorods after Ag NP decoration. ... 107
Figure 4.17 Raman spectra of 10-6 M of R6G dried (corresponding to 9.58 x 10⁻¹
nanograms) on the SERS paper substrate decorated with Ag NPs@ZnO NRs (I) and Ag NPs (II). These are compared with the respective backgrounds without analyte, (III) Ag NPs@ZnO NRs and (IV) Ag NPs. (b) SERS EF (Enhancement factor) of the strongest Raman vibrational lines (1360 and 1509 cm-1). The inset is the schematic
drawing of each SERS active substrate. ... 108
Figure 4.18 (a) Raman spectra of 10-6 M (i.e. 9.58 x10⁻¹ nanograms) of R6G on paper
substrate with ZnOlayer/Ag NPs and Ag NPs. These are compared with the respective background paper substrate without analyte. (b) SERS EF (Enhancement factor) of the strongest Raman vibrational lines (1360 and 1509 cm-1). ... 109
Figure 4.19 (a) Raman spectra at four different amounts (10-6, 10-7, 10-8 and 10-9 M
corresponding to 9.58 x 10⁻¹, 9.58 x 10⁻², 9.58 x 10⁻³, 9.58 x 10⁻⁴ nanograms of R6G,
respectively) of R6G. The spectrum of Ag NPs@ ZnO NRs is plotted (dash line) as background. (b) Values of the Raman area of the 1360 and 1509 cm-1 vibrational lines
for the different amounts of R6G added to the SERS substrate. ... 111
Figure 4.20 Schematic of the production process of ZnO nanorod arrays, by hydrothermal synthesis assisted by microwave radiation, decorated with Ag NPs, on cardboard substrates, for SERS applications. ... 113
Figure 4.21 Surface and cross section SEM images of ZnO NRs produced by the hydrothermal method assisted by microwave radiation, at 70 °C, with different synthesis times on cardboard substrate: (a, e) 5 min, (b, f) 10 min, (c, g) 20 min, (d, h) 30 min. ... 114
Figure 4.22 Surface and cross section SEM images of ZnO NRs produced by hydrothermal method assisted by microwave radiation, for 30 minutes, with different synthesis temperatures, on cardboard substrate: (a, e) 70 °C, (b, f) 90 °C, (c, g) 110 °C, (d, h) 130°C . ... 115
Figure 4.23 XRD diffractograms of ZnO nanorod arrays produced by the hydrothermal method assisted by microwave radiation, (a) with a temperature of 70 °C for 5, 10, 20 and 30 minutes, and (b) for 30 min with a temperature variation between 70 and 120 °C. ... 116
Figure 4.24 Tauc plots used for the determination of the optical band gap of the ZnO nanorod arrays produced by the hydrothermal method assisted by microwave radiation, on cardboard substrate, (a) with a temperature of 70 °C for 5, 10, 20 and 30 minutes, and (b) for 30 min with a temperature variation between 70 and 130 °C…..118
Figure 4.25 SEM images of ZnO NRs with Ag NPs deposited by thermal evaporation. The NRs were produced at 70 °C, with different synthesis times (5, 10, 20 and 30 minutes). The corresponding values of the average NP size (in-plane major axis, D) of the Ag NPs deposited on the NRs, from 6 nm mass equivalent thicknesses, are indicated below the images. ... 119
xxv
°C, with different synthesis times (5, 10, 20 and 30 minutes), after Ag NPs deposition with 6 nm Ag mass equivalent thickness. ... 121
Figure 4.28 (a) Raman spectra of 10-6 M of R6G on ZnO NRs with and without (control) Ag NPs. The NRs were produced at 70 °C, with different synthesis times (5, 10, 20 and 30 minutes). (b) Enhancement factor (EF) and estimated number of Ag nanoparticles (NNPS) per micrometre square, as function of the ZnO NRs synthesis
times.The points in the plot for MD and SC have an associated error estimated by analyzing, for the different points, sets of 3 samples fabricated with the same parameters...122
Figure 4.29 SEM images of ZnO NRs with Ag NPs deposited by thermal evaporation. The NRs were produced for 30 minutes, with different synthesis temperatures (70, 90, 110 and 130 °C). The values for the average size (in-plane major axis, D) of the deposited Ag NPs from 6 nm mass thicknesses are indicated. ... 123
Figure 4.30 Intensities of the 1360 cm-1 Raman vibrational lines of the spectra of 10-6
M R6G, acquired from the best-performing substrate (tNR = 5 min, covered with 6 nm
Ag mass thickness) at 6 randomly selected spots on its surface. Each bar corresponds to the average from five individual spectra measured within the vicinity of each spot. ... 124
Figure 4.31 Values of the EF at the 1360 vibrational line for the different amounts of R6G (10-6, 10-7, 10-8 M) added to the SERS substrate. Inset: Raman spectra from mean
average value of hundred measurements, at the different amounts (10-6, 10-7, 10-8 M)
xxvii
Table 1.1 Advantages and disadvantages of main SERS substrates [113,139–143]….29
Table 3.1 Summary of the properties of the TCO films deposited on glass substrate [thickness, RMS roughness, electrical conductivity (σ), estimated thermal conductivity via free electrons (λel) and refractive index (N)], determined with the techniques described in sub-section 2.3……….64
Table 3.2 Microcrystalline silicon layers thickness and deposition conditions: hydrogen dilution, DH (%); dopant (trimethilboron or phosphine) ratio to silane, Rd (%);
deposition pressure (Torr); power density, Pd (mW cm−2); frequency, f (MHz)………. 74
Table 3.3 Opto-electronic parameters of solar cells deposited on different BRs…….…82
xxix 3D Three-dimensional
AlGaAs Aluminium gallium arsenide
AZO Aluminum zinc 0xide
AM Air Mass coefficient
AFM Atomic Force Microscopy
AC Alternated contact
a-Si:H Hydrogenated amorphous Silicon
B2H6 Diborane
B(CH3)3 Trimethylborane
BSE Backscattered Electrons
c-Si crystalline silicon
CdTe Cadmium telluride
CIGS Copper-indium-gallium selenide
CVD Chemical Vapor Deposition
CEMOP Centre of Excellence in Microelectronics Optoelectronics and Processes
CENIMAT Centro de Investigação de Materiais
CE Chemical Enhancement
EDS X-ray Spectroscopy
EF Enhancement Factor
EQE External Quantum Efficiency
e-beam Thermal evaporation assisted by electron beam
EM Electromagnetic
FTO Fluorine doped Tin Oxide
FIB Focused Ion Beam
xxx FET Field Effect Transistors
GPD Gross Domestic Product
GaAs Gallium arsenide
GZO Gallium zinc oxide
I3N Instituto de Nanoestruturas, Nanomodelação e Nanofabricação
IZO Indium zinc oxide
ITO Indium tin oxide
InGaAs Indium gallium arsenide
HW Hotwire
HIT Heterojunction
HDI Human Development Index
IR Infrared
LSP Localized Surface Plasmons
LSPR Localized Surface Plasmons Ressonance
LAFD Laser Assisted Flow Deposition
LOD Limit of detection
LOC Limit of quantification
µc-Si microcrystalline silicon MNP Metal Nanoparticle
MDR Morphology Dependent Resonance
MD Mean Diameter
MG Malachite Green
NIR Near-Infrared
NRs Nanorods
NPs Nanoparticles
NSs Nanostars
nc-Si:H Hydrogenated nanocrystalline silicon
xxxi PET Polyethylene Terephthalate
PI Polyimide
PH3 Phosphine
PLD Pulsed Laser
PVD Physical Vapor Deposition
PECVD Plasma-Enhanced Chemical Vapor Deposition
PBR Plasmonics Back Reflectors
PV Photovoltaic
PoC Point of care
PDA Post-Deposition Annealing
QE Quantum Efficiency
RTA Rapid Thermal Annealing
RF Radio Frequency
R6G Rhodamine 6 G
RE Renewable Energy
RT Room Temperature
SSD Solid-State Dewetting
SC Solar Cell
SERS Surface Enhanced Raman Spectroscopy
SC Surface Coverage
SPP Surface Plasmon Polaritons
SE Secondary Electrons
SR Spectral Response
SiH4 Silane
SQ Shockley-Queisser
xxxii TF Thin Film
TFSC Thin Film Solar Cells
TCO Transparent Conductive Oxide
UV Ultraviolet
VHF Very High Frequency
Vis Visible
XRD X-Ray Diffraction
xxxiii . Scalar product
× Vector product
∇
Nabla operator×
∇ Rotational
⋅
∇ Divergence
∂ ∂t
Partial derivative
2θ Peak orientation angle
α Absorption coefficient
a.u. Arbitrary units
Abs Absorptance
A Area
Β
magnetic induction fieldc
Velocity of light in vacuumC
ConcentrationCsca Scattering cross sections
Cabs Absorption cross sections
d Particle size D Average NPs size
D
Grain size
D Displacement field
δ Irradiance
E Electric field
e Electronic charge (also denoted as q)
Etauc Tauc’s optical gap
xxxiv
ε
Dielectric function0
ε
Vacuum permittivityη Efficiency
f Frequency
γ
Surface energy | Collision frequencyh Planck’s constant
Η
Magnetic fieldθ Contact angle |Bragg’s angle
I Electrical current intensity | wave intensity
SERS
I
SERS intensity of a particular Raman vibrational lineRaman
I
Normal (not enhanced) Raman intensityi Imaginary number
−
1
J
Current densityJSC short circuit current density
K Wave vector
kB Boltzmann constant
κ
Extinction coefficientλ Wavelength
λel Thermal conductivity via free electrons
Μ
Magnetizationm Mass of electrons
µ
Permeability0
µ
Vacuum permeabilityn
Refractive index; electron concentrationN Absolute refractive index| free carrier concentration
SERS
N
Number of molecules contributing to the SERS signalRaman
xxxv n Unit vector
ν Frequency
ω
p Plasma frequencyω
Angular frequencyΨ Sphericity
p Dipole moment inside the sphere
P Polarization
p Deposition pressure
P RF power density
RDIF Diffuse reflectance
RTOT Total reflectance
RMS Root-mean-square roughness
RS Series resistance
RSH Shunt resistance
ρ
Charge density0
ρ
Free charge densityσ Electrical conductivity |Standard deviation
S
Spreading parametert Time
τ
Relaxation timeTTOT Total transmittance
TDIF Diffuse transmittance
V
VolumeChapter
1
Introduction
In this chapter a broad overview of topics from Plasmonics, to Photovoltaics and Surface Enhanced Raman Spectroscopy is discussed, where emphasis is putting concerning to their exploitation using paper based substrates, providing so the background for the results presented in the thesis, where clear contributes for the science advances were achieved.
This chapter contains relevant information from the publication:
Vicente A T, Araújo A, Mendes M J, Nunes D, Oliveira M J, Sanchez-Sobrado O, Ferreira M P, Águas H, Fortunato E and Martins R 2018 Multifunctional Cellulose-Paper for Light Harvesting and Smart Sensing Applications J. Mater. Chem. C DOI: 10.1039/C7TC05271E
2
3
1.1
Plasmonics
Plasmonics is a field of study that explores the interaction between electromagnetic radiation and collective oscillations of free electrons (a plasma oscillation) in metals. All metals can sustain plasmons, but the frequency at which it occurs depends on several aspects. For example, in a bulk metal (Figure 1.1 (a)) the plasmons that can be developed are mainly generated within the volume of the metal and can only be generated at very high frequencies (
ω ω
> p). Metals have a shiny appearance, becauseat low frequencies the light cannot penetrate inside the metal, the metal electrons follow the field until they have compensated it. Above the plasma frequency, however, the external field oscillates too fast for the electrons to follow and the metal loses its reflectivity. However, other types of plasmons can be developed if the surface is in contact with a dielectric material (Figure 1.1 (b)), as propagating electromagnetic waves, called Surface Plasmon Polaritons (SPP) [1,2]. Surface plasmon polaritons are electromagnetic excitations propagating at the interface between a dielectric and a conductor, evanescently confined in the perpendicular direction. These electromagnetic surface waves arise via the coupling of the electromagnetic fields to oscillations of the conductor’s electron plasma. The term "surface plasmon polariton" explains that the wave involves both charge motion in the metal ("surface plasmon") and electromagnetic waves in the air or dielectric.
When the size of the metal is reduced to the nano-scale, the plasmons are dominated by surface effects that are confined to the nanoparticle (Figure 1.1 (c)). Localized surface plasmons (LSP), unlike SPP, are non-propagating excitations of the conduction electrons of metallic nanostructures coupled to the electromagnetic field. We will see in the sub-section 1.4.3 that these modes arise naturally from the scattering problem of a small, sub-wavelength conductive nanoparticle in an oscillating electromagnetic field. The surface of the particle causes a restoring force on the displaced free electrons, which changes their plasma resonance relative to bulk. When such resonance (the LSP) occurs it leads to electromagnetic field amplification inside, in the near-field zone outside the particle, and in its propagating far-field scattered light. Another consequence of the effect of the nanoparticle surface is that the excitation of plasmon resonances can be driven solely by direct light illumination, in contrast to propagating SPPs, which require additional wavevector matching.
4
Figure 1.1 Schematic illustration of the different types of plasmons on metal materials with dimensions from macroscale to nanoscale. (a) volume plasmons in a bulk material, (b) bulk metal in contact with a dielectric, sustaining SPP and (c) LSPR, generated in metallic nanoparticles, dominated by surface effects.
1.1.1 Maxwell’s equations and the dielectric function of the free
electron
The interaction of metals (bulk or metallic nanostructures on the order of a few nanometres) with electromagnetic fields can be understood in a classical framework based on Maxwell’s equations at macroscopic level. So, it is more convenient to include the charges fields and polarized currents in the atoms in two new fields D
and
H.
In
function of these fields, the Maxwell’s equations assume the following form [3]:
⋅ =D
ρ
∇ 1. 1
× = −∂ ∂t
Β
∇ Ε 1. 2
∇ Β⋅ =0 1. 3
⋅ = + ∂ ∂t
D
H J
∇ 1. 4
These equations link the four macroscopic fields D(the dielectric displacement),
Ε
(the electric field),
Η
(the magnetic field), andΒ
(the magnetic induction or magnetic flux density) with the external charge and current densitiesρ
ext andJext. Wheretot ext
ρ
=
ρ
+
ρ
andJ
tot=
J
ext+
J
.The four macroscopic fields are further linked via the polarization
Ρ
and magnetizationΜ
by:
D
= Ε + Ρ
ε
01. 5
0
1
= −
µ
Η Β Μ 1. 6
where
ε
0andµ
0 is the electric permittivity and magnetic permeability of vacuum,5
not consider a magnetic response represented byΜ. The response of the material can be described by the electric polarizationΡ, being the volume density of electric dipole moments inside the material caused by the alignment of microscopic dipoles with the electric field.
To solve Maxwell’s equations it is necessary to relate the electric displacement to the electric field. The simplest case is the linear and isotropic media, in which the field
D
is parallel and directly proportional to Ε :0 =
ε ε
D
Ε 1. 7where ε is called the dielectric constant or relative permittivity. Leading to the expression:
0 ( 1) =
ε ε
−Ρ Ε 1.8
However, we have to point out that the statements (1.7) and (1.8) are only correct for linear media that do not exhibit temporal or spatial dispersion. Since the optical response of metals clearly depends on frequency (possibly also on wave vector) we must take account of the non-locality in time and space by generalizing the linear relationships. But, in the interaction of light with metals, the general form of the dielectric response ε (ω,K) can be simplified to the limit of a spatially local response via ε (K = 0, ω) = ε(ω). This simplification is valid as long as the wavelength λ in the material is significantly longer than all characteristic dimensions such as the size of the unit cell or the mean free path of the electrons.
In general,
ε ω
( )=ε ω
1( )+iε ω
2( )is a complex function, where the real part (ε
1)describes the strength of the polarization induced by an external electric field and the imaginary part (
ε
2) describes the losses encountered in polarizing the material. Atoptical frequencies, ε can be experimentally determined for example via reflectivity measurements at varying angles and polarizations (ellipsometry), linking the complex
refractive index of the medium
~
( )= ( )+ ( )
n
ω
nω
iκ ω
with the complex dielectric responseby
n
~=
ε
. Explicitly, this yields2 2 1 =n −
ε
κ
1. 92 =2n
ε
κ
1. 10
2 1 2 2 1 1
1
2 2
= + +
n
ε
ε
ε
6 2
2n
ε
κ
= 1. 12κ
is called the extinction coefficient and determines the optical absorption of electromagnetic field in the medium. The relation below links it to the absorptioncoefficient α of Beer’s law Ι(x) = Ι e0
x α
− by the relation:
( )= 2 ( )
c
κ ω ω
α ω
1. 131.1.2 The Drude theory of metals
The simplest realistic model for the dielectric constant of a metal is the Drude or free electron model. This model was proposed in 1900 [4] by Paul Drude to explain the transport properties of electrons in metals, applying the classical kinetic theory of gases (electrons are modelled as solid spheres and no forces act on them during the travel time) to the conduction electrons. In the Drude model the conduction electrons are treated as a free electron. Solving the equations of motion for a single electron, and multiplying them by the number of electrons per unit volume, we obtain their response to an electric field. The electrons oscillate in response to the applied electromagnetic field, and their motion is damped via collisions occurring with a characteristic collision
frequency
γ
= 1τ
,τ
is known as the relaxation time of the free electron gas (averagetime it travels before suffering collision).
For a harmonic time dependence of the driving field, the motion of electrons subjected to an external electric field Εcan be written as:
2
2
d
+ = − i t
x dx
m m e e
dt dt
ω
γ
Ε 0 − 1. 14and the solution is given by:
2
( )
( )
(
)
Χ
=
+
e
t
t
m
ω
i
γω
Ε
1. 15The displaced electrons contribute to the macroscopic polarization by the relation
= −nex
Ρ , with
n
being the electron concentration and e the elementary charge, explicitly given by:2 2
(
)
= −
+
ne
m
ω
i
γω
7
Consequently, comparison with equation 1.8 yields the following expression for the dielectric constant [5,6]:
2
( ) 1
( ) = − + p i
ω
ε ω
ω ω γ
1. 17Where
ω
p is the plasma frequency given by0
2 2 =
p ne m
ω ε , where
n
is the electrondensity,
ε
0 is the vacuum permittivity, and me is the effective mass of the electrons[5,6].
The real and imaginary components of the complex dielectric function ε(ω) = ε1(ω) + i ε2(ω) are given by:
2 2
1( ) 1 2 2
1 = − + p
ω τ
ε ω
ω τ
1. 182
2( ) 2 2
(1 ) = + p
ω τ
ε ω
ω
ω τ
1. 19It is insightful to study (1.17) for a variety of different frequency regimes with respect to the collision frequency γ. For noble metals like Ag and gold (Au), the Drude model gives a good description of the dielectric constant in the near-infrared (NIR) region of the spectrum, but it starts to break down in the visible (Vis) to near-ultraviolet (UV) (specially with Au), because of the interband transitions [3,7–9]. Which for the case of Ag and Au, the two materials of highest importance for plasmonics, are 3.9 eV and 2.3 eV. In the case of Au, its validity breaks down already at the boundary between the near-IR and the Vis. So, the Drude model adequately describes the optical response of metals only for photon energies below the threshold of transitions between electronic bands.
In the case of noble metals (e.g. Ag, Au), the atoms consist of completely filled 3d-, 4d-, and 5d-shells having just a single electron in the 4s-, 5s-, and 6s-bands. Although, the optical response is essentially determined by the s-shell, the filled d-band close to the Fermi surface causes a residual polarization background due to ion cores. This effect can be described by adding a constant to the dielectric function, which leads to: 2 2 ( )= − + p i
ω
ε ω
ε
ω
γω
i n t 1. 20
2
1( )= − 2+ 2
p
ω
ε ω
ε
ω
γ
i n t
8 2
2( ) 2 2
( )
=
+
p
ω γ
ε ω
ω ω
γ
1. 22Figure 1.2 shows the real and imaginary components ε1 and ε2 for the dielectric function of silver, determined by Johnson and Christy [10] and a Drude model fit to the experimental data [10] according to the equations 1.20 with the following values of parameters
ε
i n t= 3.7,p
ω
=9.2 eV,γ
= 100 THz.Figure 1.2 Drude model fit to the experimental data of Ag [40] according to the equations 1.20 with the following fitting parameters
ε
i n t= 3.7,ω
p= 9.2 eV,γ
= 100THz. The dashed curve represents the threshold frequency for interband transition at 3.9 eV, indicating the limit for the validity of the free-electron model.1.1.3 Localized Surface Plasmon Resonance
When light is incident on a metal nanoparticle, the oscillating electromagnetic field of the light leads to collective oscillations of the conducting electrons (plasmonics excitations). The subsequent polarization effects and restoring forces allow for the occurrence of a resonance behavior. In the wavelength region where the resonance occurs, light is most efficiently scattered at the nanoparticle. At the same time, also the parasitic absorption in the nanoparticle is enhanced. The beneficial feature is that light can be scattered in large angles outside the direction of the impinging light, in the so called ‘forbidden zones’.
9
particle is where the electric field has greater intensity (near-field), being able to be ~ 100x higher than the intensity of the incident light. The MNP also produces far-field radiation that spreads away from it, in the form of spherical waves.
The MNPs far-field scattering has been considered as a promising light trapping mechanism, since it can improve the optical path length in photovoltaic devices [11,12]. SERS, on the other hand, takes advantage of the near–field, mainly associated to the enhanced local electric field intensity in the MNPs vicinity [13,14]. Such localized field enhancement can lead to highly amplified Raman scattering signals at the surface of the nanoparticles, resulting in an increase of Raman signals from molecules that have been adsorbed onto or are in the vicinity of nanometer-sized metallic particles [15].
Figure 1.3 Schematic of the distribution of the electric field inside and outside of an arbitrary sized nanoparticle.
As previously mentioned, the maximum scattered field intensity is proportional to the polarizability of the particle [16]:
) ( ) ( ) ( | E | S ω ε ω ε ω ε P C m P L Max + ∝ 1. 23
Where
ε
p( )ω andε
m( )ω are the dielectric functions of the particle and surroundingmedium, respectively, and LC is a geometric factor that dependents on the particle
shape. Usually the surrounding medium is a dielectric material, so the
ε
m( )ω has a10
negative value, which means that for a certain frequency the denominator in eq. 1.23 can be close to zero1. That situation corresponds to a resonance in the polarizability that occurs at the localized plasmon frequency of the particle and maximizes the field dispersed by the particle.
1.1.4 Sub-wavelength metal particles
When an electric plane-wave impinges on a particle (size d) much smaller than its wavelength (d <<λ) the electric field induced inside the particle can be assumed uniform [17]. As such, the scattering problem can be simplified to a particle in an electrostatic field, known as quasi-static approximation [18].
We start with the most convenient geometry for an analytical treatment: a homogeneous, isotropic sphere with radius a, located at the origin in a uniform, static
electric field Ε0
∧
=
Ε zas depicted in Figure 1.4. The surrounding medium is taken to be
isotropic and non-absorbing with dielectric constant
ε
m and the sphere is described bya complex dielectric function
ε ω
( ). The electric field is parallel to the z-direction atsufficient distance from the sphere. Solving the Maxwell equations in this regime, we obtain that the nanoparticle responds as a dipole, creating around it a dipolar-like electric field distribution [19].
Figure 1.4 Sketch of a spherical particle with radius a and complex dielectric function
ε ω
( ) placed in homogeneous mediumε
m.The distribution of the electric field inside (Εin) and (Εout) outside the particle is given
by [18]:
1 Note that the quantity in the denominator of eq. 1.23 never really reaches zero due to the
11 m p m
3
2
=
+
Ε
inΕ
0ε
ε
ε
1. 240 3
p m
3 (
) -
1
2
r
⋅
=
+
+
Ε
outΕ
n n p
p
ε
ε
1.25Where Ε0is the incident electric field,
ε
pthe dielectric function of the sphere,ε
m thedielectric constant of the isotropic and non-absorbing surrounding medium, p the
dipole moment inside the sphere, r is the radial distance to point P and n the unit vector in the direction of the point P.
The radiation of the dipole leads to scattering of the plane wave by the sphere. The corresponding cross sections for scattering and absorption, Csca and Cabs
determined via the Poynting-vector of such an oscillating electric dipole, are given by [16]:
2 4
2 6 m
sca
m
8
6 3 2
ε − ε
ε
k
C = α = πka
π ε + 1. 26
[ ]
3 mabs
m
Im
4
Im
2
ε − ε
α
π
ε
ε
C
=
k
=
ka
+
1. 27Where
α
is the (complex) polarizability of a small sphere of sub-wavelength diameter in the electrostatic approximation.It is important to note that, for small particles with a≪
λ
the efficiency of absorption, scaling with a3, dominates over the scattering efficiency, which scales with a6. Therefore, the optical response of small particles is dominated by absorption, while due to the rapid increase of Csca with NP size, the response of big particles is chieflydriven by scattering.
Though the theory of dipolar particles outlined above is valid only for small sub-wavelength particles, it assures a reasonably good agreement for spheres with dimensions below 100 nm illuminated with visible or near infrared radiation, and is adequate for the purpose of the chapters 4 related with SERS. For particles of larger dimensions (>100 nm, as those used for solar cell light trapping), where the quasi-static approximation is not justified due to significant phase-changes of the driving field over the particle volume, a rigorous electrodynamic approach is required.

![Figure 1.5 Relationship between GDP per capita and primary power consumption per capita for world regions [25]](https://thumb-eu.123doks.com/thumbv2/123dok_br/16693505.743734/50.892.205.687.146.466/figure-relationship-capita-primary-power-consumption-capita-regions.webp)
![Figure 1.6 Human Development by Country versus Per Capita Power Consumption [25].](https://thumb-eu.123doks.com/thumbv2/123dok_br/16693505.743734/51.892.194.702.108.505/figure-human-development-country-versus-capita-power-consumption.webp)