ABSTRACT: Objective: To describe the prevalence of the self-rated poor and very poor health status among elderly people who were not in nursing homes and were living in São Paulo, Brazil, in 2010, and to identify whether the social inequalities previously reported for this condition persist. Methods: We carried out a cross-sectional study, with a representative sample of 1,344 people aged 60 years or more living in the city, who participated in the SABE Study (Health, Well-Being, and Aging). We applied a questionnaire about sociodemographic characteristics, which included three questions on self-rated health status: a direct question about the current condition, a comparison with the condition of the other people of the same age, and a comparison with oneself a year before. The comparative analysis used Poisson regression models, reporting the prevalence ratio as a measure of association between variables. Results: Only 7.8% of the elderly individuals reported a negative self-rated health status in 2010, similar proportion to those that consider themselves to be in worse health condition than the other people of the same age (8.7%). However, the prevalence of elderly people that reported worsening in comparison with the previous year was higher, of 29.2%. Regardless of the question used, the prevalence of negative self-rated health was directly associated with worse indicators of income, educational status, and consumer classes. Significant differences between genders, age groups, and skin color categories were also observed. Conclusion: Differences in the prevalence of self-rated negative health status continue to affect the sociodemographic groups. The knowledge already available about social inequalities in health did not eliminate or attenuate social injustice in this outcome.
Keywords: Self-assessment. Aged. Socioeconomic factors. Income. Educational status. Demographic data.
Social inequalities in the self-rated health of the
elderly people in the city of São Paulo, Brazil
Desigualdades sociais na autoavaliação de saúde dos idosos da cidade de São Paulo
José Leopoldo Ferreira AntunesI, Alexandre Dias Porto Chiavegatto FilhoI,
Yeda Aparecida Oliveira DuarteI,II, Maria Lúcia Lebrão (in memoriam)I
ISchool of Public Health, Universidade de São Paulo – São Paulo (SP), Brazil. IISchool of Nursing, Universidade de São Paulo – São Paulo (SP), Brazil.
Corresponding author: José Leopoldo Ferreira Antunes. Faculdade de Saúde Pública da Universidade de São Paulo. Avenida Doutor Arnaldo, 715, Pacaembu, CEP: 01246-904, São Paulo, SP, Brasil. E-mail: [email protected]
Conflict of interests: nothing to declare – Financial support: none.
INTRODUCTION
The self-rated health assessment is an indicator of general health widely used in Brazil and in the international context. The direct question about the health status is a strat-egy of simple application in population surveys. In addition to the operational ease for obtaining data, its widespread use has been justified by the expectation that this infor-mation effectively reflects the presence of functional limitations, besides anticipating the possible demand for medical care and the mortality in the subsequent period1-3. In Brazil, the self-reported health assessment was validated as an indicator of the general health of the elderly people, despite the recognition of its lack of specificity concerning the health
problems that were being measured4.
To identify the presence of socioeconomic differences in health has been a growing priority in public health5. For the elderly population, the study of health inequalities has its importance increased by the perception that the accumulation of different chronic health problems causes an almost exponential growth in the spending on health services6. DeSalvo et al.7 found that simple models based on self-rated health and age provided robust estimates of future spend-ing on drugs, hospitalizations, and total health spendspend-ing.
In Brazil, recent studies have examined the self-rated health of the elderly peo-ple, focusing on their socioeconomic determinants. An analysis of the data for elderly people (60 years old or more) in the National Household Sample Survey (PNAD) doc-umented the association between income and self-rated health, showing that it has
ReSUMO: Objetivo: Descrever a prevalência da autoavaliação de saúde ruim e muito ruim em idosos não asilados vivendo na cidade de São Paulo em 2010 e identificar se persistem as desigualdades sociais anteriormente relatadas para esta condição. Métodos: Foi realizado um estudo transversal, com amostra representativa de 1.344 pessoas com 60 anos ou mais vivendo na cidade, participantes do Estudo SABE (Saúde, Bem-Estar e Envelhecimento). Foi aplicado questionário sobre características sociodemográficas, incluindo três questões de autoavaliação de saúde: uma pergunta direta sobre a condição atual, uma comparação com a condição das demais pessoas da mesma idade, e uma comparação consigo mesmo há um ano. A análise comparativa utilizou modelos de regressão de Poisson, relatando a razão de prevalências como medida de associação entre variáveis. Resultados: Apenas 7,8% dos idosos relataram autoavaliação negativa de saúde em 2010, proporção análoga à dos que se consideraram em pior condição de saúde que as demais pessoas de mesma idade (8,7%). No entanto, foi mais elevada a prevalência de idosos que relataram piora em relação ao ano anterior: 29,2%. Independentemente da questão utilizada, a prevalência de autoavaliação negativa de saúde associou-se diretamente com piores indicadores de renda, escolaridade e classes de consumo. Também foram observadas diferenças significativas entre os sexos, grupos etários e categorias de cor da pele. Conclusão: Diferenças na prevalência de autoavaliação negativa de saúde persistem afetando os grupos sociodemográficos. O conhecimento já disponível sobre desigualdades sociais de saúde não propiciou suprimir ou atenuar a injustiça social neste desfecho.
remained unchanged over the 10 years of the research (1998–2008)8. In fact, two subse-quent studies have also found that the association between low income and worse health perception by the elderly people persists9,10. The knowledge already obtained about this association does not seem to have been used in attenuating the negative impact of poor socioeconomic condition on the self-rated health assessment.
In the city of São Paulo, the association between income and self-rated health in the elderly people had already been observed in a population-based study, which had a sample referring to the year 200011. In this study, the authors identified the fear of violence and phys-ical inactivity as the factors that mediate this association. These evidences could instruct the planning of specific programs to promote the health of the elderly people, reducing the prevalence of the negative self-assessment or modifying its association with variables of socioeconomic nature, such as income and educational statuses.
In this sense, we tried to describe the perception of health of the elderly people in São Paulo in a more recent period, in order to assess whether the prior knowledge already avail-able was avail-able to attenuate the social inequality in the health perception of the elderly individuals. This study aimed at describing the prevalence of poor and very poor self-rated health from elderly people who were not in nursing homes and lived in São Paulo in 2010 and to iden-tify if the social inequalities previously reported for this condition persist.
METHODS
This study used data from SABE (Health, Welfare, and Aging), a longitudinal study that began in 2000 under the auspices of the Pan American Health Organization (PAHO). The sample of this study consisted of elderly individuals (60 years old or more) who were not in nursing homes and lived in São Paulo, Brazil. The national and international ethical guidelines for research involving human participants were followed; the research protocol was evaluated and approved by the Research Ethics Committee of the School of Public Health at Universidade de São Paulo.
The initial sample was obtained in 2000 using complex design, of multiple stages, and was planned to enable statistical inference for the urban population of 60 years old or more. The primary sampling units were the census sectors of the city, and the households were the secondary sampling units. Of a total of 263 census tracts included in the National Household Sample Survey carried out by the Brazilian Institute of Geography and Statistics (IBGE) in 1995, 72 were randomly selected. The households were also randomly selected, with all individuals aged 60 years or more living in these households being considered eligible for the study, totaling 2,143 participants.
355 new participants aged from 60 to 64 years were included, to reconstruct again the age range of the sample. With this, the total sample included 2,143 individuals in 2000, 1,413 in 2006 and 1,344 in 2010. The sample weights applied in 2000 were reestimated in 2006 and 2010, in order to allow statistical inferences for the population aged 60 years or more in the municipality. Sample weights were estimated as the inverse of the sampling fraction with an adjustment for the corresponding distribution of the population by sex and age group.
All the participants were interviewed in their own households. Health professionals specifically trained for this purpose applied a detailed questionnaire on characteristics that included sociodemographic aspects, behavior, quality of life, use of health services, and clinical information, besides some physical tests. The SABE study, its methodology, sample design, and questionnaire were described in more detail in other publications12,13.
This study considers three outcomes related to the quality of life and perception of health of the elderly. The first was the answer to the direct question about how the per-son evaluates his or her own current health: “Would you say that your health is very good, good, fair, poor, or very poor?” The second outcome involved the comparison between the current health status and the participant’s opinion about the health of others of the same age: “Compared to others of your age, would you say that your health is better, equal, or worse?”. The third outcome was obtained by comparing the current health status with the condition experienced 12 months prior to the interview: “Comparing your health today with the one from 12 months ago, would you say that now your health is better, the same, or worse than it was then?”.
The study of factors associated with these results was carried out only for the sample of 2010 and considered demographic characteristics (sex, age, skin color, and current mari-tal status) and socioeconomic conditions (educational status, income, consumption level, and occupation). The age was stratified into 60 to 64 years, 65 to 74 years, 75 to 84 years, and 85 years or older. Skin color involved the categories used by IBGE: white, brown, black, and yellow; the category for other answers includes “indigenous,” “do not know,” and “no answer.” Current marital status was assessed in a dichotomous way: with spouse (married and cohabiting) and without spouse (unmarried, widowed, and separated).
Advertisers (ABA) and the Brazilian Association of Market Research Institutes (ABIPEME)14, with subsequent stratification by quartiles.
The association between self-rated health outcomes and the factors of demographic and socioeconomic nature was studied using the prevalence ratio, estimated by Poisson regression analysis15. For the construction of models with multiple variables, a technique proposed by Victora et al.16 was used to integrate the conceptual framework to the regres-sion adjustments. According to this conceptual framework, the demographic characteristics were considered distal in relation to the socioeconomic conditions, and the educational sta-tus was considered distal in relation to the other socioeconomic variables. In general, the educational status is obtained in previous periods of the life of the elderly people, and this influences their present condition of income, occupation, and consumption17. Thus, in the Poisson regression analysis with multiple variables, the prevalence ratios involving demographic characteristics were adjusted among each other but not for socioeconomic conditions, while the prevalence ratios involving socioeconomic conditions were adjusted for demographic characteristics included in the models and for educational status.
The statistical analysis used the Stata 13.0 2013 software (Stata Corporation, College Station, TX, USA). Specifically, the statistical analysis used the survey module of Stata, which enables us to incorporate in the analysis the characteristics of the complex design of the sample: disproportionate stratification of primary and secondary sampling units and attri-bution of sampling weights.
RESULTS
The proportion of elderly people with poor or very poor self-rated health was relatively low: 7.8% [95% confidence interval (CI): 6.1–9.4%] of the sample of 2010. This proportion has remained virtually unchanged compared with previous evaluations: 8.8% in 2006 and 8.2% in 2000. Similar data were observed when the question about the assessment of health involved the comparison with other people of the same age. When asked about their per-ception, only 8.7% (95%CI 6.8–10.7%) of the participants in 2010 informed that their health was worse than the health of the others; a proportion close to what was observed in 2006 (10.0%) and 2000 (11.2%) (Table 1).
However, the negative health perception was about three times higher when the question regarding self-rated health referred to the comparison with oneself in the period of 1 year. In 2010, 29.2% (95%CI 25.9–32.4%) of the elderly participants reported being worse than in the previous year; the proportion was equivalent in 2006 (28.5%) and 2000 (27.4%) (Table 1).
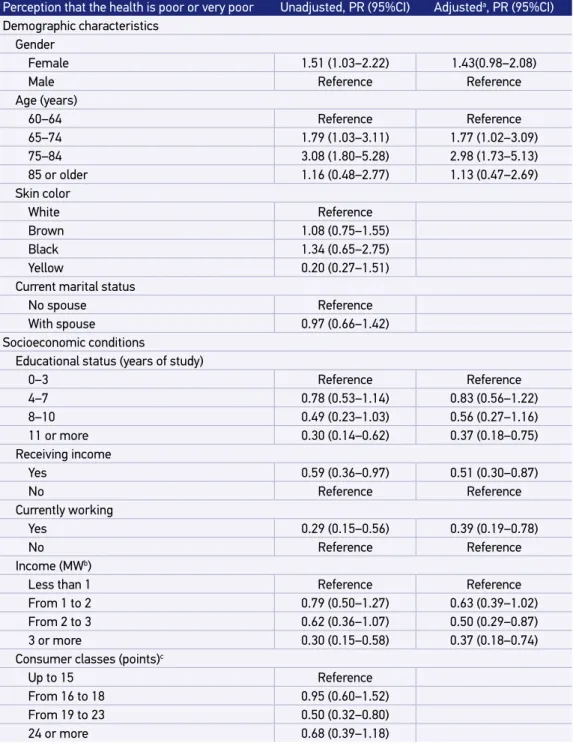
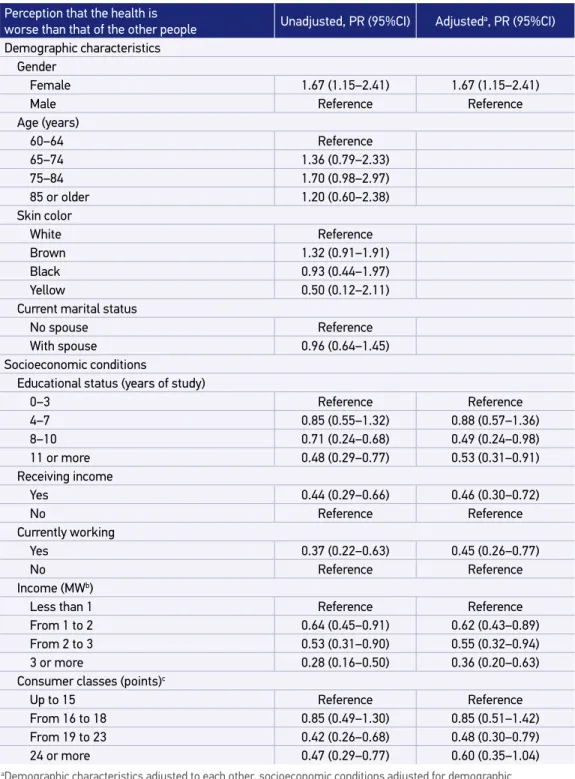
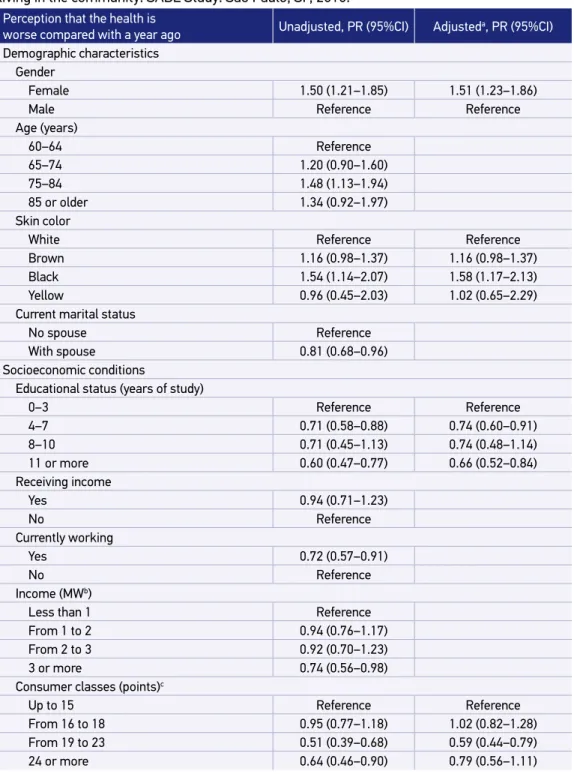
Tables 3, 4, and 5 summarize the study of association between the three measurements of self-rated health and the sociodemographic factors of interest. The variable “gender” was selected for the three adjusted models, indicating that the proportion of women with health complaints was higher than that of men, regardless of how the perception of health was evaluated. Differences in health complaints between the age groups were significant only for the first variable: with higher prevalence of poor or very poor health reports for people aged over 75 years (Table 3). As for skin color, there was a record of worse condition from elderly people with black skin for the report of worsening compared with the previous year (Table 5). Living with spouse was appointed as protection for only one of the health assessment measurements, but the association lost significance in the adjusted model for other sociodemographic variables (Table 5).
The three self-assessment indicators were associated with educational status, indicating better perception of health for elderly people with more years of study (Tables 3, 4, and 5). The elderly individuals who were still working and receiving income showed significantly lower prevalence of poor or very poor self-rated health. A similar association was observed in comparison with others of the same age.
The income level was inversely associated with the indicators of self-assessment, indicat-ing better perception from elderly participants with higher incomes (Tables 3 and 4). The indicators of income and current work were not associated with the complaint of worse health condition compared with the previous year (Table 5).
Finally, the distribution of participants according to consumer class was inversely asso-ciated with the comparison measurements between the current health status and the one
Table 1. Self-rated health status of elderly people living in the community: SABE Study. São Paulo,
SP, 2000, 2006, and 2010.
DK/NA: do not know/no answer.
Health perception 2000, %
(n = 2,143)
2006, % (n = 1,413)
2010, % (n = 1,344) Your health is
Poor or very poor 8.2 8.8 7.8
Regular 45.6 46.2 41.1
Good or very good 46.0 44.4 48.7
DK/NA 0.2 0.6 2.4
Compared with other people of the same age, your health is
Worse 11.2 10.0 8.7
Equal 20.7 20.1 26.2
Better 58.0 59.2 58.3
DK/NA 10.1 10.7 6.8
Compared with a year ago, your health is
Worse 27.4 28.5 29.2
Equal 54.5 54.2 51.2
Better 17.7 16.6 17.1
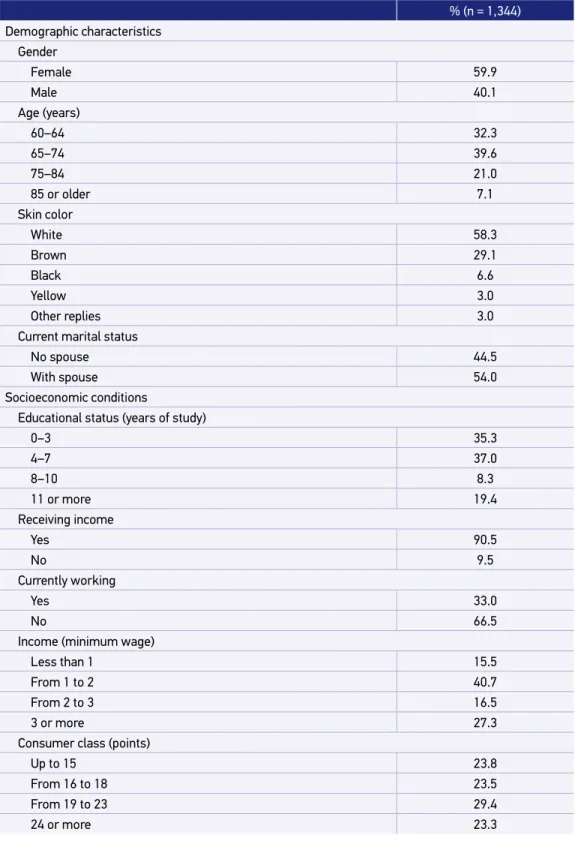
Table 2. Elderly people living in the community: distribution according to demographic and socioeconomic characteristics: SABE Study. São Paulo, SP, 2010.
% (n = 1,344)
Demographic characteristics
Gender
Female 59.9
Male 40.1
Age (years)
60–64 32.3
65–74 39.6
75–84 21.0
85 or older 7.1
Skin color
White 58.3
Brown 29.1
Black 6.6
Yellow 3.0
Other replies 3.0
Current marital status
No spouse 44.5
With spouse 54.0
Socioeconomic conditions
Educational status (years of study)
0–3 35.3
4–7 37.0
8–10 8.3
11 or more 19.4
Receiving income
Yes 90.5
No 9.5
Currently working
Yes 33.0
No 66.5
Income (minimum wage)
Less than 1 15.5
From 1 to 2 40.7
From 2 to 3 16.5
3 or more 27.3
Consumer class (points)
Up to 15 23.8
From 16 to 18 23.5
From 19 to 23 29.4
Table 3. Poor and very poor self-rated health status and associated factors of sociodemographic nature. Poisson regression analysis. Elderly people living in the community: SABE Study.
São Paulo, SP, 2010.
aDemographic characteristics adjusted to each other, socioeconomic conditions adjusted for demographic characteristics and education; PR: prevalence ratio; 95%CI: 95% confidence interval; bMW: minimum wage – R$ 510 (US$ 300) in the period of data collection, cHigher values correspond to greater capacity of consumption.
Perception that the health is poor or very poor Unadjusted, PR (95%CI) Adjusteda, PR (95%CI)
Demographic characteristics
Gender
Female 1.51 (1.03–2.22) 1.43(0.98–2.08)
Male Reference Reference
Age (years)
60–64 Reference Reference
65–74 1.79 (1.03–3.11) 1.77 (1.02–3.09)
75–84 3.08 (1.80–5.28) 2.98 (1.73–5.13)
85 or older 1.16 (0.48–2.77) 1.13 (0.47–2.69)
Skin color
White Reference
Brown 1.08 (0.75–1.55)
Black 1.34 (0.65–2.75)
Yellow 0.20 (0.27–1.51)
Current marital status
No spouse Reference
With spouse 0.97 (0.66–1.42)
Socioeconomic conditions
Educational status (years of study)
0–3 Reference Reference
4–7 0.78 (0.53–1.14) 0.83 (0.56–1.22)
8–10 0.49 (0.23–1.03) 0.56 (0.27–1.16)
11 or more 0.30 (0.14–0.62) 0.37 (0.18–0.75)
Receiving income
Yes 0.59 (0.36–0.97) 0.51 (0.30–0.87)
No Reference Reference
Currently working
Yes 0.29 (0.15–0.56) 0.39 (0.19–0.78)
No Reference Reference
Income (MWb)
Less than 1 Reference Reference
From 1 to 2 0.79 (0.50–1.27) 0.63 (0.39–1.02)
From 2 to 3 0.62 (0.36–1.07) 0.50 (0.29–0.87)
3 or more 0.30 (0.15–0.58) 0.37 (0.18–0.74)
Consumer classes (points)c
Up to 15 Reference
From 16 to 18 0.95 (0.60–1.52)
From 19 to 23 0.50 (0.32–0.80)
Table 4. Perception that the health status is worse than that of the other people and associated factors of sociodemographic and socioeconomic nature. Poisson regression analysis. Elderly people living in the community: SABE Study. São Paulo, SP, 2010.
aDemographic characteristics adjusted to each other, socioeconomic conditions adjusted for demographic characteristics and education; PR: prevalence ratio; 95%CI: 95% confidence interval; bMW: minimum wage – R$ 510 (US$ 300) in the period of data collection, cHigher values correspond to greater capacity of consumption.
Perception that the health is
worse than that of the other people Unadjusted, PR (95%CI) Adjusteda, PR (95%CI)
Demographic characteristics
Gender
Female 1.67 (1.15–2.41) 1.67 (1.15–2.41)
Male Reference Reference
Age (years)
60–64 Reference
65–74 1.36 (0.79–2.33)
75–84 1.70 (0.98–2.97)
85 or older 1.20 (0.60–2.38)
Skin color
White Reference
Brown 1.32 (0.91–1.91)
Black 0.93 (0.44–1.97)
Yellow 0.50 (0.12–2.11)
Current marital status
No spouse Reference
With spouse 0.96 (0.64–1.45)
Socioeconomic conditions
Educational status (years of study)
0–3 Reference Reference
4–7 0.85 (0.55–1.32) 0.88 (0.57–1.36)
8–10 0.71 (0.24–0.68) 0.49 (0.24–0.98)
11 or more 0.48 (0.29–0.77) 0.53 (0.31–0.91)
Receiving income
Yes 0.44 (0.29–0.66) 0.46 (0.30–0.72)
No Reference Reference
Currently working
Yes 0.37 (0.22–0.63) 0.45 (0.26–0.77)
No Reference Reference
Income (MWb)
Less than 1 Reference Reference
From 1 to 2 0.64 (0.45–0.91) 0.62 (0.43–0.89)
From 2 to 3 0.53 (0.31–0.90) 0.55 (0.32–0.94)
3 or more 0.28 (0.16–0.50) 0.36 (0.20–0.63)
Consumer classes (points)c
Up to 15 Reference Reference
From 16 to 18 0.85 (0.49–1.30) 0.85 (0.51–1.42)
From 19 to 23 0.42 (0.26–0.68) 0.48 (0.30–0.79)
Table 5. Perception that the health status is worse compared with the precedent year and associated factors of demographic and socioeconomic nature. Poisson regression analysis. Elderly people living in the community: SABE Study. São Paulo, SP, 2010.
aDemographic characteristics adjusted to each other, socioeconomic conditions adjusted for demographic characteristics and education; PR: prevalence ratio; 95%CI: 95% confidence interval; bMW: minimum wage – R$ 510 (US$ 300) in the period of data collection, cHigher values correspond to greater capacity of consumption.
Perception that the health is
worse compared with a year ago Unadjusted, PR (95%CI) Adjusteda, PR (95%CI)
Demographic characteristics
Gender
Female 1.50 (1.21–1.85) 1.51 (1.23–1.86)
Male Reference Reference
Age (years)
60–64 Reference
65–74 1.20 (0.90–1.60)
75–84 1.48 (1.13–1.94)
85 or older 1.34 (0.92–1.97)
Skin color
White Reference Reference
Brown 1.16 (0.98–1.37) 1.16 (0.98–1.37)
Black 1.54 (1.14–2.07) 1.58 (1.17–2.13)
Yellow 0.96 (0.45–2.03) 1.02 (0.65–2.29)
Current marital status
No spouse Reference
With spouse 0.81 (0.68–0.96)
Socioeconomic conditions
Educational status (years of study)
0–3 Reference Reference
4–7 0.71 (0.58–0.88) 0.74 (0.60–0.91)
8–10 0.71 (0.45–1.13) 0.74 (0.48–1.14)
11 or more 0.60 (0.47–0.77) 0.66 (0.52–0.84)
Receiving income
Yes 0.94 (0.71–1.23)
No Reference
Currently working
Yes 0.72 (0.57–0.91)
No Reference
Income (MWb)
Less than 1 Reference
From 1 to 2 0.94 (0.76–1.17)
From 2 to 3 0.92 (0.70–1.23)
3 or more 0.74 (0.56–0.98)
Consumer classes (points)c
Up to 15 Reference Reference
From 16 to 18 0.95 (0.77–1.18) 1.02 (0.82–1.28)
From 19 to 23 0.51 (0.39–0.68) 0.59 (0.44–0.79)
from the previous year and with the condition of others of the same age. In both situa-tions, the health perception was progressively better for classes with higher consumption capacity (Tables 4 and 5).
DISCUSSION
This study documented the prevalence of elderly people with negative self-rated health assessment in the city of São Paulo. Moreover, the study found that such condition per-sists, affecting unequally the different sociodemographic strata. These are the main results of this study.
By exploring different ways to evaluate the perception of health of the elderly, this study identified a measure with significantly higher proportion of negative results. We believe that increasing the sensitivity of the self-rated health assessment may present operational advantages to the population research in the health field.
The prevalence of elderly individuals with poor or very poor health perception was rel-atively low (8.2% in 2010). Differences in the form of measurement, in the scales used, and in the age composition of the participants reduce the interest in comparing this result with other databases. However, it is important to note that relatively low magnitudes were also recorded by major surveys in Brazil and abroad. In the edition of 2006–2007, the National Health and Nutrition Examination Survey (NHANES) showed that only 3.2% of American adults evaluated their health as poor. This figure rises to 16.9% if the adults who rate their health as regular are added to the count3. In the European Social Survey (ESS) carried out in 2006, the negative self-evaluation, that is, poor or very poor health, showed a prevalence of 7.5% of European adults18. In the National Household Sample Survey carried out in 2008, the prevalence of Brazilian elderly people (65 years or more) with poor or very poor health perception was 13.6%19.
Despite the proportion of elderly people with negative self-rated health being reduced, the prevalence of self-reported chronic diseases was high in this population. Almost seven of ten survey participants reported taking medication to lower the blood pressure. Almost one of four participants was informed by doctors or nurses that he or she had dia-betes. More than a third received a diagnosis of joint disease (arthritis, osteoarthritis, and rheumatism), and almost the same proportion reported having fallen in the previous year20.
Regardless of the question used to measure the self assessment, the negative perception of health was more prevalent for groups of worse socioeconomic condition, and this find-ing was statistically adjusted to the already known fact of the greater propensity to negative self-rated health in women and elderly people with higher age21,22. The association between poor socioeconomic conditions and negative self-rated health is widely recognized in the lit-erature and influenced by individual factors and by the social context in which it is inserted, including cultural and psychosocial aspects, housing characteristics, and the physical envi-ronment in which one lives23,24.
The socioeconomic gradient in health exists in both high-income and in low-income countries and has persisted even when there is a better distribution of income25. For elderly people in particular, the social inequalities in health reflect differences in conditions expe-rienced throughout life. Some elderly participants can obtain an increase in income and can even be able to modify their formal educational status, but the socioeconomic gradi-ent in health does not reflect only currgradi-ent conditions but the accumulation of advantages and disadvantages that occurred throughout life. In this sense, reducing social inequalities in health would require more than socioeconomic changes; it would require health pro-grams and actions specifically targeted to give an increased provision of resources to the groups with greater needs.
The moderating effect of health care on the socioeconomic gradient in the health con-ditions of the elderly people has been reported in studies addressing different outcomes26, including the self-rated health27. In this sense, one would expect that the wide recognition of social inequalities in health, in the national and international contexts, could have motivated actions and health programs directed to the promotion of social justice. The socioeconomic gradient of the same outcome (negative self-rated health) had been documented for the same population (elderly people of São Paulo) in the previous period (2000)11. Nevertheless, this study found that this unfavorable condition remained unchanged in 2010. This observation should be considered as an eloquent sign of the need for initiatives from the health system to attend the social groups with larger demands.
The main limitation of this study is to have evaluated only self-reported information. The participants were asked about how they assessed their own health condition. This information was not checked by comparisons with medical records and administrative records of health care. This strategy is not free from memory bias. However, a previous study evaluated favor-ably the validity of measuring self-rated health in the elderly people as a predictive factor for subsequent mortality in the Brazilian context4.
CONCLUSION
to prevent a worse outcome to continue affecting, in 2010, the less-educated elderly indi-viduals, those who do not work or do not earn income, and those who were stratified into classes of smaller consumption capacity. The previous recognition that the less-educated elderly individuals and with lower income show a worse perception of health11 did not show favorable consequences regarding the modification of the profile of health inequalities. In this sense, we reiterate the importance of programmatic actions for promoting health to the poorest socioeconomic strata, in order to encourage the modification of their worse self-reported health.
1. Burström B, Fredlund P. Self rated health: is it as good a predictor of subsequent mortality among adults in lower as well as in higher social classes? J Epidemiol Community Health 2001; 55(11): 836-40.
2. Idler EL, Russell LB, Davis D. Survival, functional limitations, and self-rated health in the NHANES I Epidemiologic Follow-up Study, 1992. First National Health and Nutrition Examination Survey. Am J Epidemiol 2000; 152(9): 874-83.
3. Zajacova A, Dowd JB. Reliability of self-rated health in US adults. Am J Epidemiol 2011; 174(8): 977-83. 4. Lima-Costa MF, Cesar CC, Chor D, Proietti FA.
Self-rated health compared with objectively measured health status as a tool for mortality risk screening in older adults: 10-year follow-up of the Bambuí Cohort Study of Aging. Am J Epidemiol 2012; 175(3): 228-35. 5. Marmot M. Fair society, healthy lives: strategic review of health inequalities in England post-2010. London: The Marmot Review; 2010.
6. Lehnert T, Heider D, Leicht H, Heinrich S, Corrieri S, Luppa M, et al. Review: health care utilization and costs of elderly persons with multiple chronic conditions. Med Care Res Rev 2011; 68(4): 387-420. 7. DeSalvo KB, Jones TM, Peabody J, McDonald J, Fihn
S, Fan V, et al. Health care expenditure prediction with a single item, self-rated health measure. Med Care 2009; 47(4): 440-7.
8. Lima-Costa MF, Facchini LA, Matos DL, Macinko J. Mudanças em dez anos das desigualdades sociais em saúde dos idosos brasileiros (1998-2008). Rev Saúde Pública 2012; 46(1): 100-7.
9. Borim FS, Barros MB, Neri AL. Autoavaliação da saúde em idosos: pesquisa de base populacional no Município de Campinas, São Paulo, Brasil. Cad Saúde Pública 2012; 28(4): 769-80.
10. Loyola Filho AI, Firmo J de O, Uchôa E, Lima-Costa MF. Fatores associados à autoavaliação negativa da saúde entre idosos hipertensos e/ou diabéticos: resultados do projeto Bambuí. Rev Bras Epidemiol 2013; 16(3): 559-71.
11. Chiavegatto Filho AD, Lebrão ML, Kawachi I. Income inequality and elderly self-rated health in São Paulo, Brazil. Ann Epidemiol 2012; 22(12): 863-7.
12. Lebrão ML, Duarte YA. SABE – Saúde, bem-estar e envelhecimento – O Projeto SABE no município de São Paulo: uma abordagem inicial. Brasília: Organização Pan-Americana da Saúde; 2003.
13. Albala C, Lebrão ML, León Díaz EM, Ham-Chande R, Hennis AJ, Palloni A, et al. Encuesta Salud, Bienestar y Envejecimiento (SABE): metodología de la encuesta y perfil de la población estudiada. Rev Panam Salud Publica 2005; 17(5-6): 307-22.
14. Almeida PM, Wickerhauser H. O critério ABA/ ABIPEME - em busca de uma atualização. São Paulo: LPM/Burke; 1991.
15. Barros AJ, Hirakata VN. Alternatives for logistic regression in cross-sectional studies: an empirical comparison of models that directly estimate the prevalence ratio. BMC Med Res Methodol 2003; 3: 21.
16. Victora CG, Huttly SR, Fuchs SC, Olinto MT. The role of conceptual frameworks in epidemiological analysis: a hierarchical approach. Int J Epidemiol 1997; 26(1): 224-7.
17. Grzywacz JG. Socioeconomic status and health behaviors among Californians. In: Kronenfeld JJ. Health, illness, and use of care: the impact of social factors. New York: Elsevier Science; 2000. p. 121-49. 18. Huijts T, Perkins JM, Subramanian SV. Political regimes,
political ideology, and self-rated health in Europe: a multilevel analysis. PLoS ONE 2010; 5(7): e11711.
19. Oliveira BL, Thomaz EB, Silva RA. Associação da cor/ raça aos indicadores de saúde para idosos no Brasil: um estudo baseado na Pesquisa Nacional por Amostra de Domicílios (2008). Cad Saúde Pública 2014; 30(7): 1438-52.
20. Ferreira SR, Chiavegatto Filho AD, Lebrão ML, Duarte YA, Laurenti R. Doenças cardiometabólicas. Rev Bras Epidemiol. 2018; 21 Suppl 2: e180008.sup2. http:// dx.doi.org/10.1590/1980-549720180008.supl.2 21. Peres MA, Masiero AV, Longo GZ, Rocha GC,
Matos IB, Najnie K, et al. Self-rated health among adults in Southern Brazil. Rev Saúde Pública 2010; 44(5): 901-11.
22. Garcia LP, Höfelmann DA, Facchini LA. Self-rated health and working conditions among workers from primary health care centers in Brazil. Cad Saúde Pública 2010; 26(5): 971-80.
23. Santos SM, Chor D, Werneck GL, Coutinho ES. Associação entre fatores contextuais e auto-avaliação de
saúde: uma revisão sistemática de estudos multinível. Cad Saúde Pública 2007; 23(11): 2533-54.
24. Jylhä M. What is self-rated health and why does it predict mortality? Towards a unified conceptual model. Soc Sci Med 2009; 69(3): 307-16.
25. Marmot MG. Review of social determinants and the health divide in the WHO European Region: final report. Copenhagen: WHO Regional Office for Europe; 2013.
26. Antunes JL, Waldman EA, Borrell C, Paiva TM. Effectiveness of influenza vaccination and its impact on health inequalities. Int J Epidemiol 2007; 36(6): 1319-26.
27. Aas E, Alstadsæter A, Feiring E. Does healthcare moderate the impact of socioeconomic status on self-rated health? J Clin Res Bioeth 2013; 5: 169.
Received on: 11/04/2014 Accepted on: 03/20/2015