Licenciada em Ciências da Engenharia Química e Bioquímica
Case Study for N
2O Purification in a
Wastewater Treatment Plant, through an
Economic Analysis
Dissertação para obtenção do Grau de Mestre em
Engenharia Química e Bioquímica
Orientador: Eng. Pedro Póvoa, Águas de Portugal
Co-orientador: Dr. Adrian Oehmen, FCT-UNL
Júri:
Presidente: Prof. Dr. Mário Fernando José Eusébio Arguente: Dra. Gilda de Sousa Carvalho Oehmen
Vogal: Eng. Pedro Ricardo Neto Póvoa
Março 2016
Case Study for N
2O Purification in a
Wastewater Treatment Plant, through an
Economic Analysis
Dissertação para obtenção do Grau de Mestre em
Engenharia Química e Bioquímica
Orientador: Eng. Pedro Póvoa, Águas de Portugal
Co-orientador: Dr. Adrian Oehmen, FCT-UNL
UNIVERSIDADE NOVA DE LISBOA
Faculdade de Ciências e Tecnologia
Departamento de Química
Case Study for N2O Purification in a Wastewater Treatment Plant, through an Economic
Analysis
Copyright © Margarida Maria Lima Martins, Faculdade de Ciências e Tecnologia, Universidade Nova de Lisboa.
A Faculdade de Ciências e Tecnologia e a Universidade Nova de Lisboa têm o direito, perpétuo e sem limites geográficos, de arquivar e publicar esta dissertação através de exemplares impressos reproduzidos em papel ou de forma digital, ou por qualquer meio conhecido ou que venha a ser inventado, e de a divulgar através de repositórios científicos e de admitir a sua cópia e distribuição com objetivos educacionais ou de investigação, não comerciais, desde que seja dado crédito ao autor e editor.
Faculdade de Ciências e Tecnologia and Universidade Nova de Lisboa have the perpetual right with no geographical boundaries, to archive and publish this dissertation through printed copies reproduced on paper or digital form, or by any means known or to be invented, and to divulge through scientific repositories and admit its copy and distribution for educational purposes or research, non-commercial, as long as the credit is given to the author and publisher.
But if you judge a fish on its ability to climb a tree,
it will live its whole life believing that it is stupid.
This project, consuming a huge amount of work and research, as well as effort and dedication not only from myself but from all my tutors, would not have been possible without the support and help from all the people involved.
To Lord God Almighty, for the completion of this work. Only due to his blessings I could finish my master thesis.
To my supervisors Eng. Pedro Póvoa and Prof. Dr. Adrian Oehmen, I would like to thank for the tireless support and advices.
To Prof. Dr. Mário Eusébio (Auxiliar Professor in the Department of Chemistry and Biochemistry Engineering of FCT/UNL) for giving me the amazing opportunity of doing my master thesis in Alcântara’s WWTP.
To my beloved parents, and family, as always, helped me economically. A very special thanks for making this amazing journey possible and also for their tireless support in every moment of my life.
Estações de Tratamento de Águas Residuais (ETARs). Nos últimos anos, os custos operacionais das ETARs aumentaram principalmente devido aos aumentos no custo de energia. Os métodos estabelecidos para a purificação das águas residuais têm a desvantagem do grande consumo de energia, pelo que é necessário explorar potenciais para economizar os sistemas estabelecidos.
Uma ETAR em larga escala tem o potencial para a produção de N2O e combinando a
possibilidade de tratamento de águas residuais com a produção de combustível (CH4),
associada à redução de gases efeito estufa (recuperação N2O), abre uma nova dimensão no
ciclo da água e realmente representa os termos-chave para uma economia sustentável e circular. Três cenários avaliam a possibilidade para a purificação do gás N2O, numa ETAR em
particular localizada em Alcântara (Portugal). A seguinte avaliação é apresentada:
Caso Cenário 1 Cenário 2 Cenário 3
Purificação N2O 24% 24% 99.7%
Pressão Sistema a vácuo Até 3 bar Até 44 bar Propósito Pré-tratamento biogás Pré-tratamento biogás Receita adicional
Purificação Final N2O 68% 68% 99.7%
Objetivo Combustão do biogás Combustão do biogás Vender N2O
O uso de membranas e bombas a vácuo têm lugar no primeiro cenário, que compromete um sistema a vácuo. O segundo cenário, tem um sistema de compressão até 3 bar, seguido por um sistema de arrefecimento e também por membranas. O terceiro cenário tem um sistema de compressão até 44 bar, que também é seguido por sistemas de arrefecimento e membranas, e ainda comprometendo colunas de adsorção com regeneração e uma unidade de liquefação. As folhas de balanços (secção Flowsheet) e os diagramas de instrumentação e tubagens (secção P&ID), relativo a cada cenário, também são apresentados nesta tese.
Uma análise económica para cada cenário também está incluída no presente estudo, para uma possível oportunidade de investimento. Particularmente, o primeiro cenário seria o projeto mais propício a seguir em frente, com um significante baixo grau de risco. A ETAR de Alcântara tem um valor de retorno de 0,10 € por kWh de energia gerada pela combustão do biogás. No terceiro cenário, estima-se 4 € por kg de N2O vendido. Os seguintes resultados são
apresentados:
Caso Cenário 1 Cenário 2 Cenário 3
Investimento Total (CAPEX) 95,925 € 298,429 € 1,855,189 € Período de retorno de capital 4 meses superior a 10 anos 2 anos e 9 meses
Valor Atual Líquido (VAL) 1,718,792 € - 673,462 € 3,549,223 € Taxa Interna de Retorno (TIR) 269 % Inferior a 7 % 40 %
Taxa mínima de atratividade 14 % 14 % 14 %
Ponto Crítico (BEP) 11.7 % - 47.0 %
Palavras-chave: N2O, Gás Efeito Estufa, ETAR, Três Cenários, Oportunidade de Investimento,
V The present study is focused on the evaluation of nitrous oxide (N2O) recovery in
Wastewater Treatment Plants (WWTPs). In the recent years, the operating costs of WWTPs have increased substantially due to the increases in the unit cost of energy. The established methods for wastewater purification have a substantial disadvantage which is the higher energy consumption, and saving potentials need to be explored.
A full-scale WWTP brings the potential of N2O production. Combining the possibility of
wastewater treatment with fuel production (CH4) associated to greenhouse gases reduction
(N2O recovery) opens a new dimension in water cycle, and really represents the key terms of
sustainably and circular economy. Three case scenarios evaluate the possibility for N2O gas
purification in a particular WWTP, located in Alcântara (Portugal). The following evaluation is presented:
Case Scenario 1 Scenario 2 Scenario 3
N2O Purification 24% 24% 99.7%
Pressure Vacuum system Up to 3 bar Up to 44 bar Purpose Biogas Pre-treatment Biogas pre-treatment Additional Revenue
Final N2O Purification 68% 68% 99.7%
Objective Biogas Combustion Biogas Combustion Selling N2O
The use of membranes and suction pumps take place in the first case scenario, which has a vacuum system. The second case scenario has a compression system up to 3 bar, which is followed by a cooling system and also membranes. The third case scenario has a compression system up to 44 bar, also followed by cooling systems and membranes, and still having continuous swing adsorption and a unit of liquefaction. Flow balances (Flowsheet section) and piping and instrumentation diagrams (P&ID section), of each case scenario, are also presented in this thesis.
An economic analysis of each case scenario is also included in the present study, for a possible investment opportunity. Particularly, the first case scenario would be the project most likely to go ahead, with a significantly low degree of risk. Alcântara’s WWTP has a return value of 0.10 € per kWh of generated energy through biogas combustion. In the third case scenario, it is estimated 4 € per kg for the selling product (N2O). The following results are presented:
Case Scenario 1 Scenario 2 Scenario 3
Total Investment (CAPEX) 95,925 € 298,429 € 1,855,189 € Payback Period 4 months more than 10 years 2 years + 9 months Net Present Value (NPV) 1,718,792 € - 673,462 € 3,549,223 € Internal Rate of Return (IRR) 269 % less than 7 % 40 %
Hurdle Rate 14 % 14 % 14 %
Break-even Point (BEP) 11.7 % - 47.0 %
Keywords: N2O, Greenhouse Gas, WWTP, Three Case Scenarios, Investment Opportunity,
VII Resumo ... III Abstract ... V List of Contents ... VII List of Figures ... IX List of Tables ... XI List of Equations ... XIII List of Abbreviations ... XV List of Units and Symbols ... XVII
1. Introduction and Objectives ... 1
2. Literature Review... 3
2.1 Greenhouse Gases (GHGs) ... 3
2.2 GHGs Emissions ... 3
2.3 GHGs Emissions from Domestic WWTPs ... 6
2.4 Schematic Overview of a Domestic WWTP ... 8
2.5 Oxygen-depleting forms of Carbon and Nitrogen from Water ... 8
2.6 N2O Generation in Domestic WWTPs ... 9
2.7 Domestic WWTPs as Engineered Systems ... 12
2.8 Energy Consumption... 13
2.9 Biogas Production ... 14
2.10 N2O as a Powerful Oxidant in Combustion Reactions ... 15
2.11 CANDO, a New Nitrogen Removal ... 16
2.12 Maximizing N2O production, in WWTPs: Risks and Safety ... 17
2.13 Domestic WWTPs as Potential Sources of N2O ... 19
2.13.1 Potential of Aeration Control: the impact of N-removal over Nitrite ... 19
2.13.2 Potential Production of N2O, at full-scale WWTPs ... 23
2.14 N2O Production via SNDPR Systems ... 29
2.15 The N2O Market ... 30
3. Case Study of N2O Purification ... 35
3.1 Fate of Gases Produced Through Denitrification ... 35
3.2 Alcântara’s WWTP (Portugal) ... 36
3.3 Maximizing N2O production, in Alcântara’s WWTP ... 38
3.4 Three Case Scenarios of N2O Purification, in Alcântara’s WWTP ... 39
3.5 Mass and Energy Balances ... 40
3.6 Dimensioning the Equipment ... 40
3.6.1 Compressors ... 40
3.6.2 Heat Exchangers ... 47
3.6.3 Drums ... 56
VIII
3.6.8 Buffer Tank ... 70
3.6.9 Liquefaction Unit ... 71
3.6.10 Storage Tanks ... 77
3.6.11 Instrumentation and Control Engineering ... 78
4. Economic Analysis for N2O Recovery ... 79
4.1 Base Equipment Cost ... 79
4.2 Total Fixed Investment (CAPEX) ... 80
4.3 Investment Plan ... 81
4.4 Total Operational Costs, OPEX ... 83
4.5 Revenues ... 87
4.6 Cash-flows ... 90
4.7 Analysis of Economic Profitability ... 93
4.8 Break-even Analysis ... 95 4.9 Discussion of Results ... 96 5. Conclusions ... 99 6. Future Work ... 101 7. References ... 103 8. Appendix ... 117 8.1 Appendix I ... 117 8.2 Appendix II ... 121 8.3 Appendix III ... 124 8.4 Appendix IV ... 127 8.5 Appendix V: N2O Monitoring ... 129 9. Attachments ... 131 9.1 Annex I ... 131 9.2 Annex II ... 132 9.3 Annex III ... 133 9.4 Annex IV ... 134 9.5 Annex V ... 135 9.6 Annex VI ... 136
IX
Figure 2 – Total GHGs Emissions, including LUCF, of Top Emitters and from Selected ... 4
Figure 3 – Global GHGs Emissions by Gas ... 5
Figure 4 – Global GHGs Emissions by Sector. ... 6
Figure 5 – Methane emission from domestic WWTPs, of Selected Countries. ... 6
Figure 6 – Nitrous oxide emission from domestic WWTPs, of Selected Countries. ... 7
Figure 7 – Locations where CH4 and N2O can be emitted at a WWTP. ... 8
Figure 8 – Conversion steps in the nitrification process (Colliver, 2000). ... 9
Figure 9 – Conversion steps in the denitrification process (Otte, 2000). ... 10
Figure 10 – Schematic illustration of a known technique for microbially processing nitrogen. ... 11
Figure 11 – Biological Nitrogen Conversions. ... 12
Figure 12 – Schematic diagram of biogas usage and biomethane production (CALSTART White Paper, 2010). ... 15
Figure 13 – Main process parameters leading to N2O formation and emission. ... 19
Figure 14 – N-removal over nitrite, with intermittent aeration ... 20
Figure 15 – N-removal over nitrate, with intermittent aeration. ... 21
Figure 16 – N-removal over nitrite, with constant DO of 30%. ... 21
Figure 17 – N-removal over nitrate, with constant DO of 30% ... 22
Figure 18 – Representative profiles of N2O emission rates, in the gas phase, measured at a full-scale domestic WWTP, located in Spain (La Roca de Vallès) ... 23
Figure 19 – Representative profiles of N2O emission rates, in the liquid phase, measured at a full-scale domestic WWTP, located in Spain (La Roca de Vallès) ... 24
Figure 20 – Dynamics of (A) N2O emission rate (grey line) and (B) aeration flow rate, measured at a full-scale domestic WWTP, located in Spain (Granollers). ... 24
Figure 21 – Cycle study profile measured at a municipal WWTP (Catalonia, Spain) operating in SBR mode, with a settling time of 7 min and an aeration flow of 100 L/min. ... 25
Figure 22 – Concentration profiles of N2O (gas phase), ammonium and nitrite (liquid phase) and aeration gas flow measured at a full-scale granular sludge reactor, located in Olburgen (Netherlands). ... 26
Figure 23 – N2O emission from a full-scale partial nitritation SHARON reactor, located in Rotterdam (Netherlands). ... 27
Figure 24 – Two consecutive SBR cycles showing DO and NH4+-N concentrations, pH and levels of N2O, NO and NO2 in the off-gas, at a full-scale sludge liquor treatment plant, located in Sj lunda (Malm , Sweden). ... 28
Figure 25 – Global N2O Consumption, in 2010. ... 31
Figure 26 – Manufacturing, repackaging and distributing N2O. ... 34
Figure 27 – Process for Recovery and Purification of N2O, with Wet Scrubbing. ... 34
Figure 28 – Alcântara’s WWTP, located in Lisbon (Portugal). ... 36
Figure 29 – Main Compressor Types. ... 41
Figure 30 – Selection of the Compressor Type. ... 41
Figure 31 – P-v and T-s diagrams illustrating polytropic process paths for special cases of constant pressure (n = 0), constant temperature (n = 1), constante entropy (n = ), and constant volume (n = ).44 Figure 32 – Estimation of Polytropic Exponent, . ... 44
X
Figure 37 – Permeability coefficient (P) and ideal selectivity (α) of polymeric membranes. ... 60
Figure 38 – Membrane Vessel. ... 62
Figure 39 – Roll Membrane. ... 62
Figure 40 –Specifications of Cellulose Acetate. ... 62
Figure 41 – Adsorption-desorption isotherms of adsorptive materials, at 25ºC ... 65
Figure 42 – CO2 adsorption isotherms in a gravimetric (mg/g) basis on VR carbon molecular sieves samples, at 25ºC and up to 50 bar. MOF materials with exceptional adsorption properties and commercial activated carbon MAXSORB are included for the sake of comparison. ... 66
Figure 43 – CO2 isotherms for activated carbon monolith VR-93 at 25ºC and up to 50 bar after different adsorption-desorption cycles, in a volumetric basis (cm3/cm3). ... 67
Figure 44 – Binary Analysis of Aspen Plus Software Program (1/5). ... 71
Figure 45 – Binary Analysis of Aspen Plus Software Program (2/5). ... 72
Figure 46 – Binary Analysis of Aspen Plus Software Program (3/5). ... 72
Figure 47 – Binary Analysis of Aspen Plus Software Program (4/5). ... 72
Figure 48 – Binary Analysis of Aspen Plus Software Program (5/5). ... 73
Figure 49 – Internal rate of return. ... 94
Figure 50 – Break-even Point, in Case of Scenario 1. ... 95
Figure 51 – Break-even Point, in Case of Scenario 2 ... 96
Figure 52 – Break-even Point, in Case of Scenario 3. ... 96
Figure 53 – Process for Recovery and Purification of N2O, with Wet Scrubbing. ... 132
Figure 54 – Process for Recovery and Purification of N2O, without Wet Scrubbing. ... 132
XI
horizon) of Selected GHGs. ... 5
Table 2 – Implied N2O Emission Factor, from selected domestic WWTPs, in 2013, ... 7
Table 3 – Biological Nitrogen Conversions. ... 12
Table 4 – Typical composition of biogas from normally functioning digesters. ... 14
Table 5 – Theoretical upper bound for four N removal processes treating U.S per capita nitrogen and BODL. ... 16
Table 6 – N2O emissions with N-removal over nitrite and nitrate, respectively, with intermittent aeration and constant DO of 30%. ... 20
Table 7 – N2O Production via SBR systems. ... 29
Table 8 – Physical Gas Proprieties of N2O. ... 32
Table 9 – Fate of Gases Produced Through Denitrification. ... 35
Table 10 – Estimated Steady State, during denitrification. ... 36
Table 11 – Estimated Gas Emission, during denitrification, from Alcântara’s WWTP, in 2015. ... 38
Table 12 – Estimated Gas Emission, with N2O maximized during denitrification, from Alcântara’s WWTP. ... 38
Table 13 – N2O gas Purification, in Alcântara’s WWTP. ... 39
Table 14 – Differences between Fans, Blowers and Compressors. ... 41
Table 15 – Discharge Pressure and Inlet Flow of Scenarios 2 and 3. ... 42
Table 16 – Centrifugal Compressors Limitations. ... 42
Table 17 – Compression Ratios of Scenarios 2 and 3. ... 43
Table 18 – Special Cases of Polytropic Processes. ... 44
Table 19 – Discharge Temperatures of Scenarios 2 and 3. ... 45
Table 20 – Suction and Discharge Volumes, of Scenarios 2 and 3. ... 46
Table 21 – Suction and Discharge Volumes of Scenarios 2 and 3. ... 47
Table 22 – Outlet Temperatures of the Cold and Hot Streams, of Scenarios 2 and 3. ... 50
Table 23 – Heat Transfer Areas, of Scenarios 2 and 3. ... 51
Table 24 – Standard Dimensions for Steel Tubes. ... 51
Table 25 – Number of Tubes in the Shell, of Scenarios 2 and 3. ... 53
Table 26 – Minimum Shell Diameter, of Scenarios 2 and 3. ... 55
Table 27 – Minimum Number of Baffles, of Scenarios 2 and 3. ... 56
Table 28 – Drum Volumes, of Scenarios 2 and 3. ... 57
Table 29 – Pump Hydraulic Power, of Scenarios 2 and 3. ... 59
Table 30 – Pure Gas Permeability Coefficient (P), for Cellulose Acetate at 20ºC. ... 60
Table 31 – Ideal Selectivity (α), of Cellulose Acetate. ... 60
Table 32 – Inlet Membrane Volumes, of Scenarios 2 and 3... 61
Table 33 – Inlet Membrane Conditions, of Scenarios 1, 2 and 3. ... 61
Table 34 –Membrane Modules Dimensions and Operational Conditions. ... 63
Table 35 – Power Consumption of Vacuum Pumps, of Scenario 1. ... 64
Table 36 – Adsorption and Desorption Uptakes. ... 66
Table 37 – Activated Carbon. ... 67
Table 38 – Regeneration Step. ... 68
Table 39 – Parameters of Adsorbers. ... 70
Table 40 – Buffer Tank Volume. ... 70
Table 41 – Initial Mass Balances. ... 71
Table 42 – Mass Balances. ... 73
Table 43 – Mass Balances (S-207 = 0.425*S-206; S-208 = S-206 – S-207). ... 74
Table 44 – Mass Balances (S-205 = S-207 + S-204; S-209 = S-205 – S-206)... 74
Table 45 – Considered Values and Heat Transfer for Liquefier. ... 75
XII
Table 50 – Storage Tank Volumes. ... 77
Table 51 – Nitrogen gas in Storage Tanks. ... 78
Table 52 – N2O Purification Operation Time. ... 79
Table 53 – CE Plant Cost Index (CEPCI). ... 79
Table 54 – Base Equipment Cost. ... 80
Table 55 – Capital Expenditure (CAPEX). ... 80
Table 56 – Investment Plan, in case of Scenario 1. ... 82
Table 57 – Investment Plan, in case of Scenario 2. ... 82
Table 58 – Investment Plan, in case of Scenario 3. ... 82
Table 59 – Electricity Costs, in case of Scenario 1. ... 83
Table 60 – Electricity Costs, in case of Scenario 2. ... 84
Table 61 – Electricity Costs, in case of Scenario 3. ... 84
Table 62 – Utility Costs, in case of Scenario 3. ... 85
Table 63 – Operational Expenditure (OPEX), in case of Scenario 1. ... 86
Table 64 – Operational Expenditure (OPEX), in case of Scenario 2. ... 86
Table 65 – Operational Expenditure (OPEX), in case of Scenario 3. ... 87
Table 66 – Energy Recovery, in case scenarios 1 and 2. ... 88
Table 67 – N2O Annual Production, in case scenarios 1 and 2. ... 88
Table 68 – N2O Production Cost, in case scenarios 1 and 2. ... 88
Table 69 – Revenues, in case scenarios 1 and 2. ... 88
Table 70 – N2O Annual Production, in case scenario 3. ... 89
Table 71 – N2O Production Cost, in case scenarios 3. ... 89
Table 72 – Revenues, in case scenario 3. ... 89
Table 73 – Heat Recovery, in case scenarios 2 and 3. ... 89
Table 74 – Cash-Flows, in Case of Scenario 1. ... 91
Table 75 – Cash-Flows, in Case of Scenario 2. ... 91
Table 76 – Cash-Flows, in Case of Scenario 3. ... 92
Table 77 – Net Present Value Analysis. ... 93
Table 78 – Hurdle Rate Analysis. ... 94
Table 79 – Profitability Indicators. ... 95
Table 80 – Break-even point. ... 95
Table 81 – Global GHGs Emissions. ... 117
Table 82 – Total GHGs Emissions (including LUCF), of Top Emitters ... 118
Table 83 – Global GHGs Emissions by Gas. ... 119
Table 84 – CH4 Emission from domestic WWTPs, of Selected Countries. ... 119
Table 85 – Global GHGs Emissions by Sector. ... 120
Table 86 – N2O Emission from domestic WWTPs, of Selected Countries. ... 120
Table 87 – Molecular Weights [Aspen Plus]. ... 121
Table 88 – Mass densities [Aspen Plus]. ... 121
Table 89 – Specific Heats [Aspen Plus]. ... 123
Table 90 – Base Equipment Cost, in each case scenario. ... 125
Table 91 – Break-even Point, in case of scenario 1. ... 127
Table 92 – Break-even Point, in case of scenario 2. ... 127
XIII
Equation 2 – Net energy demand for WWTPs. ... 14
Equation 3 – Decomposition of N2O. ... 15
Equation 4 – Combustion of CH4 with N2O. ... 15
Equation 5 – Combustion of CH4 with O2. ... 15
Equation 6 – Decomposition of ammonium nitrate (exothermic reaction). ... 33
Equation 7 – Dissociation of ammonium nitrate (endothermic reaction). ... 33
Equation 8 – N2O Emission factor. ... 37
Equation 9 – N2O conversion factor. ... 37
Equation 10 – The Law of Conservation of Mass... 40
Equation 11 – The Law of Conservation of Energy. ... 40
Equation 12 – Compression Ratio per Stage. ... 42
Equation 13 – Discharge Temperature. ... 42
Equation 14 – Isentropic Process. ... 43
Equation 15 – Polytropic Process. ... 43
Equation 16 – Polytropic Efficiency. ... 45
Equation 17 – Ideal Gas Law. ... 45
Equation 18 – Polytropic Head... 46
Equation 19 – Power to Compress the Gas. ... 46
Equation 20 – Power Losses. ... 47
Equation 21 – Total Power Required. ... 47
Equation 22 – Heat Capacity of the Hot Fluid. ... 48
Equation 23 – Heat Capacity of the Cold Fluid. ... 48
Equation 24 – Smaller Heat Capacity Rate. ... 48
Equation 25 – Maximum Temperature Difference. ... 49
Equation 26 – Maximum Heat Transfer Rate. ... 49
Equation 27 – Outlet Temperature of the Cold Stream. ... 49
Equation 28 – Outlet Temperature of the Hot Stream. ... 49
Equation 29 – Heat Transfer Area. ... 50
Equation 30 – Log-mean Temperature Difference ... 51
Equation 31 – Inside Diameter of Tubes. ... 52
Equation 32 – Number of Tubes in the Shell. ... 52
Equation 33 – Cross-sectional Area per tube... 53
Equation 34 – Tight Diameter. ... 54
Equation 35 – Cross-sectional Corrected Area. ... 54
Equation 36 – Minimum Shell Diameter. ... 54
Equation 37 – Minimum baffle spacing. ... 55
Equation 38 – Minimum number of baffles. ... 55
Equation 39 – Pump Hydraulic Power. ... 57
Equation 40 – Total Drop Pressure. ... 57
Equation 41 – Total Drop Pressure. ... 58
XIV Equation 46 – Adsorber Radius. ... 69 Equation 47 – Relation between Height and Diameter, for Adsorbers. ... 69 Equation 48 – Adsorber Diameter. ... 69 Equation 49 – Equipment Update Cost. ... 79 Equation 50 – Mid-term Interest Fee ... 81 Equation 51 – Annual Provision. ... 81 Equation 52 – Amortization. ... 81 Equation 53 – Utility Price Estimation. ... 84 Equation 54 – Net Present Cash Flow. ... 90 Equation 55 – Accumulated Cash Flow. ... 90 Equation 56 – Net Present Value. ... 93
XV AC – Activated Carbon
AOA – Ammonium-oxidizing archaea AOB – Ammonium-oxidizing bacteria
Anammox – Anaerobic ammonium oxidation bacteria BEP – Break-even Point
BOD – Biochemical Oxygen Demand (Biodegradable COD) BODL – Liquid BOD
CAPEX – Capital Expenditure CAS – Chemical Abstracts Service
CEPCI – Chemical Engineering Plant Cost Index
CANDO – Coupled Aerobic-anoxic Nitrous Decomposition Operation CANON – Completely Autotrophic Nitrogen Removal Over Nitrite COD – Chemical Oxygen Demand
DEN – Denitrifying bacteria
DGAOs – Denitrifying glycogen-accumulating organisms DO – dissolved oxygen
DPAOs – Denitrifying polyphosphate-accumulating organisms EPA – Environmental Protection Agency
EU-28 – European Union comprising 28 member states e.g. – for example
FCT/UNL – Faculdade de Ciências e Tecnologia da Universidade Nova de Lisboa GAC – Granular Activated Carbon
GHGs – Greenhouse gases GHG – Greenhouse gas
GWP – Global Warming Potential IHS – Information Handling Services IRR – Internal Rate of Return
IUPAC – International Union of Pure and Applied Chemistry i.e. – that is, namely, in other words
Lab – Laboratory
LUCF – Land-Use Change and Forestry Nitrox – Gas Mixture Composed of Nitrogen NOB – Nitrite-oxidizing bacteria
NOD – Nitrogenous Oxygen Demand NPV – Net Present Value
OLAND – Oxygen-limited Autotrophic Nitrification-denitrification OPEX – Operational Expenditure
XVI SHARON – Single reactor system for High activity Ammonium Removal Over Nitrite
SNDPR – Simultaneous Nitrogen and Phosphorus Removal SRT – Solids residence time
ThOD – Theoretical Oxygen Demand TKN – Total Kjeldahl Nitrogen TN – Total Nitrogen
U.K. – United Kingdom
UNFCCC – United Nations Framework Convention on Climate Change U.S.A. – United States of America
U.S. – United States
WWTP – Wastewater Treatment Plant WWTPs – Wastewater Treatment Plants
XVII CF4 – Tetrafluoromethane
CH4 – Methane
CO2 – Carbon dioxide
e- – Electron HNO3 – Nitric acid
H2O – Water H2O(L) – Liquid water H+ – Hydrogen ion H2S – Hydrogen sulphide N – Nitrogen N2 – Dinitrogen N2O – Nitrous Oxide N2H4 – Hydrazine NH3 – Ammonia NH4 + – Ammonium ion NH2OH – Hydroxylamine NH4NO3 – Ammonium nitrate NO – Nitric oxide NO2 – Nitrogen dioxide NO2 - – Nitrite ion NO3 - – Nitrate ion NOx – Nitrogen oxides O2 – Dioxygen PO4– Phosphate PO4 3- – Phosphate ion P – Phosphorous SF6 – Sulfur hexafluoride
acfm – actual cubic foot per minute
bar – Pressure unit (1 bar = 14.504 psi = 0.1 MPa) cfm – cubic foot per minute (1 cfm = 0.0283 m3
min-1) cP – centipoises
ft2 – square foot (1 ft2 = 0.093 m2) g – gram (weight)
gall – gallon (1 U.S. gallon = 3.79 dm3
= 0.0038 m3) h – hour
hp – horsepower (1 horsepower = 745.7 W = 0.746 kW) in – inch’’ (1 ’’ = 0.0254 m)
XVIII m – meter m2 – square meter m3 – cubic meter mm – millimeter mol – mole mmHg – Millimeter of mercury min – Minute mg – milligram
MT CO2 Eq. – Metric tons CO2 equivalent
Pa – Pascal
pH – potential hydrogen ppm – Parts per million
ppmv – Parts per million by volume ppt – Parts per trillion
psi – Pound per square inch (1 psi = 0.0689 bar) s – second
tons - tonnes W – watt µ – Micro > – higher than
. – symbol for the decimal separator , – symbol for the thousand separator
% – Percent
ºC – Celsius degree & – and
Δ R
0 – Standard enthalpy of reaction
ºF – Fahrenheit degree – More and less
1
1.
Introduction and Objectives
Fossil fuels are the most utilized source of fuel energy. They are abundant and highly energy dense, making them a desirable source of energy (Alternative Energy, 2013). However, they are also responsible for many of our greatest environmental problems. These problems include global warming, air quality deterioration, oil spills, and acid rain. Nitrogen oxides, products of fossil fuel combustion, contribute to the formation of smog that can irritate the lungs, especially those of people that have asthma, cause bronchitis and pneumonia, and decrease resistance to respiratory infections.
Renewable and alternative energy sources provide a method of energy generation that does not rely on fossil fuels. Photovoltaic solar panels, wind turbines, and hydroelectric generators are examples of renewable technologies that produce electricity and are currently being developed and marketed, resulting in an increase of their use (Department of Energy Resources, 2012). Another way in which fossil fuels can be replaced is by using renewable or alternative sources to produce heat energy that would have otherwise been derived from fuel oil or natural gas.
Parallel to this, domestic wastewater utilities face a challenge of optimizing processes in order to reduce energy consumption and reduce the emission of greenhouse gases (GHGs) arising from wastewater drainage and treatment without compromising discharge permits to which they are subjected. In spite of the progress made in the last decades, a large percentage of water and wastewater systems in Europe and in the rest of the world are still being operated below optimum achievable performances, where considerable savings are possible by optimizing its design and operation. It´s important to notice that drinking water and wastewater systems account for approximately 3–4 percent of energy use in the United States, resulting in the emissions of more than 45 million tons of GHGs annually (U.S. EPA, 2012b).
Nitrous oxide (N2O) is an extremely potent GHG and it is often incidentally generated in
domestic wastewater treatment plants (WWTPs) at levels that are low but still problematic for GHG emissions. As such, researchers have never attempted to maximize N2O production rates
but have instead focused on minimizing/eliminating N2O production in WWTPs [1].
In addition to N2O, loss of other forms of reactive nitrogen to natural systems has led to
public health problems, including ammonia toxicity to aquatic life, eutrophication of nutrient limited natural water bodies, oxygen depletion and vast dead zones in the ocean margins. It is thus apparent that approaches to N2O mitigation must be accompanied by strategies to control
2 Recently, a new process for the removal of nitrogen from wastewater is introduced. This new process could permit the production on N2O. Nitrous oxide can act as a powerful oxidant in
combustion reactions. It is commonly used to supercharge the engines of high performance vehicles (i.e. Nitrox) and as an oxidant in hybrid rocket motors in the aerospace industry [2].
For this reason this thesis is focused on the possibility for N2O recovery in a WWTP,
through an economic analysis. Three case scenarios of N2O gas purification are evaluated in
order to find out whether they’ll be viable and economically safe to be applied in Alcântara’s WWTP (Portugal).
3
2.
Literature Review
2.1
Greenhouse Gases (GHGs)
The two most abundant gases in the atmosphere nitrogen (N2), comprising 78% of the dry
atmosphere, and oxygen (O2), comprising 21%, exert almost no greenhouse effect. Instead, the
greenhouse effect comes from molecules that are more complex and much less common. Those trap heat in the atmosphere and so are named greenhouse gases (GHGs) [3].
This section provides information based on emissions of the main GHGs. The values are not usually measured directly but instead are estimated through the application of formulas that link emissions to data on generally reported parameters (Foley and Land, 2009).
2.2
GHGs Emissions
Greenhouse gas emissions are typically expressed in metric tons (MT) carbon dioxide (CO2) equivalent, since this universal standard measurement allows for the comparison of
different GHGs based on their ability to trap heat in the atmosphere [4].
Since 1990 the amount of GHGs emitted into the atmosphere was equivalent to more than 30 million metric tons of CO2, according to World Resources Institute. In fact, the concentration
of total GHGs in the atmosphere has increased over the years. However, emissions can rise and fall due to changes in economy, such as, the price of fuel [6]. One of the greatest global financial crises of crude oil prices was in 2009, which led to a small decrease of the emissions by the year [7]. Global emissions of GHGs are presented in Figure 1.
Figure 1 – Global GHGs Emissions (Appendix I, Table 82). World Resources Institute1[5]
1
The most recent year for public inventory submissions of global GHGs by World Resources Institute is 2012. 0 10,000 20,000 30,000 40,000 50,000 MT C O 2 eq uiv al e nt Years
4 Land-Use Change and Forestry (LUCF) is defined by the United Nations Climate Change as a GHG inventory sector resulting from direct human-induced land-use change and forestry activities [8].
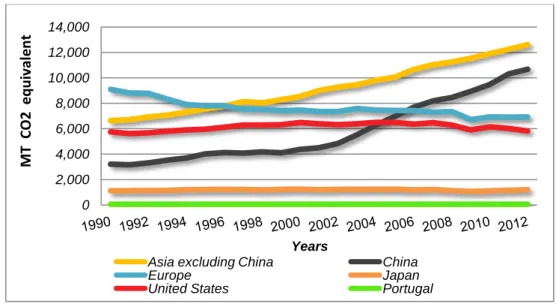
The world’s top emitters are Asia, United States of America and Europe. Over the years, these countries represented an emission equivalent to more than half of the global GHGs emissions. The emissions growth of China is driven by China’s rapid economic and industrial growth and its reliance on fossil fuels [9]. Portugal only represents a small part of the global GHGs emissions equivalent to more than 60 metric tons of CO2 over the years. Emissions of
GHGs by top emitters, and other selected countries, are presented in Figure 2.
Figure 2 – Total GHGs Emissions, including LUCF, of Top Emitters and from Selected Countries (Appendix I, Table 83). World Resources Institute [5]
The negative effects of climate change will be felt all over the world, and actually the consequences are expected to be most severe in least-developed nations which have produced few emissions [10].
There are many types of greenhouse gases, and some gases are more effective at warming the atmosphere than others because they trap heat more effectively and longer. Each of these gases can remain in the atmosphere for different amounts of time [4]. N2O is a potent
greenhouse gas (298 times more powerful than CO2).
Global atmospheric concentration, atmospheric lifetime and global warming potential (GWP) of selected GHGs are presented in Table 1.
0 2,000 4,000 6,000 8,000 10,000 12,000 14,000 MT C O 2 eq uiv al ent Years
Asia excluding China China
Europe Japan
5 Table 1 – Global Atmospheric Concentration, Atmospheric Lifetime and Global
Warming Potencial (for 100-year time horizon) of Selected GHGs [11].
GHG Concentration Lifetime (years) GWP
CO2 399 ppm - 1
CH4 1.762-1.893 ppm 12 25
N2O 0.324-0.326 ppm 114 298
SF6 7.39-7.79 ppt 3,200 22,800
CF4 79 ppt > 50,000 7,390
The relationship between kilotons of a gas and metric tons (MT) CO2 equivalent can be
expressed as Equation 1.
Equation 1 – Calculation of MT CO2 Equivalent [11].
The Kyoto Protocol sets limits on total emissions by the world’s major economies [10]. Global GHGs emissions by gas are presented in Figure 3. As expected, powerful GHGs have the lowest gas emissions as compared to CO2 emission. On the other hand, they have higher
GWP meaning a much greater greenhouse effect.
Figure 3 – Global GHGs Emissions by Gas2
(Appendix I, Table 84). World Resources Institute [5]
Human activities, primarily the burning of fossil fuels for electricity, heat and transportation (which represents part of the energy sector) have greatly intensified the natural greenhouse effect. Global GHGs emissions by sector are presented in Figure 4.
2Land-Use Change and Forestry (LUCF) doesn’t include F-gas emission. 0 5,000 10,000 15,000 20,000 25,000 30,000 35,000 40,000 MT C O 2 eq uiv al e nt Years
Total CO2 (including LUCF) Total CH4 (including LUCF) Total N2O (including LUCF) Total F-gas (excluding LUCF)
6 Waste sector, which mainly includes solid waste disposal on land, biological treatment of solid waste, incineration and open burning of waste, and also wastewater handling [11], hasn’t exceed more than 2 million metric tons CO2 equivalent over the years.
Figure 4 – Global GHGs Emissions by Sector (Appendix I, Table 86). World Resources Institute [5]
2.3
GHGs Emissions from Domestic WWTPs
Wastewater handling includes industrial and domestic wastewater treatment processes. Emissions from domestic WWTPs are mainly methane (CH4) and nitrous oxide (N2O) [11].
Figures 5 and 6 present CH4 and N2O emissions, respectively, from domestic WWTPs of
selected countries. In 2013, emission from Portugal’s domestic WWTPs was equivalent to 35.2 kt of CH4 emitted (0.88 MT CO2 eq.) and to 1.36 kt of N2O emitted. (0.41 MT CO2 eq.).
Figure 5 – Methane emission from domestic WWTPs, of Selected Countries. (Appendix I, Table 85) UNFCCC3 [11][12]
3
The most recent year for public inventory submissions of GHGs (from domestic WWTPs) by UNFCCC is 2013. 0 5,000 10,000 15,000 20,000 25,000 30,000 35,000 40,000 MT C O 2 eq uiv al ent Years Energy Agriculture
Land-Use Change and Forestry Industrial Processes
Waste Bunker Fuels
0 200 400 600 800 1,000 1990 2005 2009 2010 2011 2012 2013 kt Years
CH
4
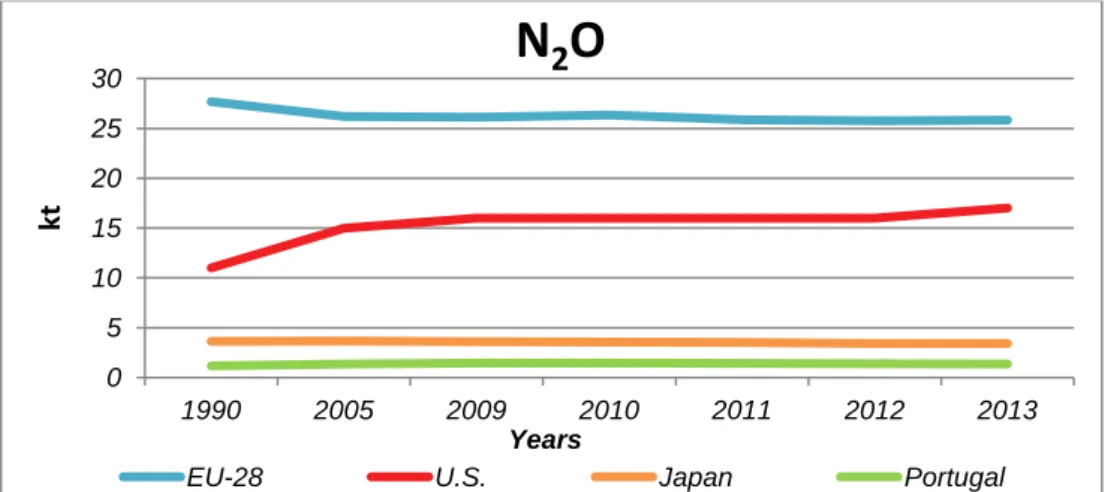
7 N2O emissions from domestic wastewater are from centralized wastewater treatment
processes and from effluent that has been discharged into aquatic environments [11].
Figure 6 – Nitrous oxide emission from domestic WWTPs, of Selected Countries. (Appendix I, Table 87) UNFCCC [11][12]
Individual industrialized countries will have mandatory emissions targets they must meet. However, it is understood that some will do better than expected, coming in under their limits, while others will exceed them [10].
A coefficient that relates the activity data to the amount of chemical compound is named as emission factor, and is the source of later emissions [8]. Table 2 presents implied N2O emission
factor in 2013, from selected domestic WWTPs.
Table 2 – Implied N2O Emission Factor, from selected domestic WWTPs, in 2013,
expressed as g N2O-N per kg sewage of N produced. UNFCCC [13]
N2O Emission Factor EU-28 U.S. Japan Portugal
g N2O-N.(kg Ninfluent)-1 5.7 5.0 5.0 9.98
Percentage 0.57 % 0.5 % 0.5 % 0.998 ≈ 1 %
As far as N2O is concerned, the Intergovernmental Panel on Climate Change (IPCC, 2006)
proposes an emission factor of 3.2 g N2O-N.PE -1
, which amounts to 0.35 g N2O-N.(kgNinfluent) -1
(0.035%) for developed countries [28]. This emission factor is based on a single study (Czepiel et al., 1995). However, the value from this study falls within the wide range of emission factors from previous studies:
0.001% - 14.6% of the in-coming nitrogen (Kampschreur et al., 2009) 0.01% - 1.8% of the in-coming nitrogen (Ahn et al., 2010) 0.06% - 25.3% of the in-coming nitrogen (Foley et al., 2010)
The wide variability between the normalized N2O emissions, from different plants that were
monitored, demonstrates the meaninglessness of the use of a single emission factor [28].
0 5 10 15 20 25 30 1990 2005 2009 2010 2011 2012 2013 kt Years
N
2
O
8
2.4
Schematic Overview of a Domestic WWTP
The non CO2 greenhouse gases that can be emitted from a domestic wastewater treatment
plant are N2O and CH4 (chapter 2.3). A schematic overview of the plant is presented in Figure 7,
as well as, the locations where these gases can be emitted.
Secondary clarifier
N2O
CH4
Influent works & Primary clarifier Anaerobic or anoxic tank CH4 CH4 N2O CH4 N2O Effluent Aeration tank CH4 Sludge handling
Figure 7 – Locations where CH4 and N2O can be emitted at a WWTP [14].
Methane that is emitted from the influent works is most likely formed in the sewer system, as the retention time of the wastewater in the influent works is too short to form CH4.
Furthermore, CH4 formation will only occur where anaerobic4 or anoxic5 conditions prevail, as in
the anaerobic or anoxic tank, but then only in the biofilms at the side of tanks, and at sludge handling sites. For this reason, no CH4 formation is expected in an aeration tank. Methane that
is emitted here is formed earlier and is stripped to the gas phase in the aeration tank [14].
Formation and emission of N2O can only occur under anoxic or aerobic6 conditions in the
presence of nitrate (and carbon source) and ammonium [14]. Measurements at one WWTP, indicate that 90% of the N2O emission occurs from the activated sludge compartments (where
biological processes remain), 5% from the grit tanks (mechanically cleaning) and 5% from the sludge storage tanks (Czepiel et al. 1995). Nitrogen that is not converted leaves the WWTP via the effluent and can lead to the emission of N2O from surface water.
2.5
Oxygen-depleting forms of Carbon and Nitrogen from Water
A major goal of biological wastewater treatment is removal of oxygen-depleting forms of carbon and nitrogen from water. These substances are routinely quantified in terms of the mass of oxygen required for complete oxidation [2].
4
Microbes living without air (total absence of free oxygen (O2) or bound oxygen (NO2, NO3)).
5
Microbes living in the absence of free oxygen (O2), but in the presence of bound oxygen (NO2, NO3)).
6
9 Organic compounds are collectively quantified as Chemical Oxygen Demand (COD7). Reduced, oxygen-depleting forms of nitrogen (ammonia, organic nitrogen, and nitrite) are likewise quantified as Nitrogenous Oxygen Demand (NOD8). Theoretical Oxygen Demand (ThOD) is the sum of COD plus NOD. Many processes efficiently remove ThOD, but these processes differ dramatically in production and consumption of energy and in production of biosolids. The use of aerobic processes to remove biodegradable COD, for example, requires energy-intensive O2 delivery and generates large quantities of biomass, but anaerobic
processes remove COD for energy production and generate comparatively little biomass [2].
2.6
N
2O Generation in Domestic WWTPs
Nitrous oxide can be produced during the conversion of nitrogen compounds in WWTPs. The processes involved are nitrification and denitrification. Beyond that, there can also be N2O
generation when e.g. biogas9 is burned at the WWTP for electricity production [14].
Nitrification
Nitrification is performed by three different groups of autotrophic microbes: Ammonium-oxidizing bacteria (AOB) and ammonium-Ammonium-oxidizing archaea (AOA), that convert ammonia into nitrite (NO2
-); Nitrite-oxidizing bacteria (NOB), that convert nitrite into nitrate (NO3
-) [14]. The different steps involved in the nitrification are presented in Figure 8.
NH3 + O2 + 2H+ + 2e -NH2OH + H2O 0.5 O2 + 2H+ + 2e -NH3 + 1.5 O2 AOB / AOA Total NH2OH + H2O NO2- + 5H+ + 4e -H2O NO2- + H+ + H2O NO2- + H2O 0.5 O2 + 2H+ + 2e NO2- + 0.5 O2 NOB Total NO3- + 2H+ + 2e -H2O NO3
-Figure 8 – Conversion steps in the nitrification process (Colliver, 2000).
7
The mass of oxygen (O2) required for stoichiometric oxidation of organic compounds to carbon dioxide (CO2).
8
The mass of oxygen (O2) needed for stoichiometric oxidation of oxygen-depleting forms of nitrogen to nitrate (NO3).
9
10 In WWTPs, nitrification is assumed to be predominantly performed by autotrophic AOB and NOB that use ammonia or nitrite as their energy source and CO2 as carbon source [15]. Even
though N2O is not present as an intermediate in the main catabolic pathway of nitrification, AOB
are known to produce N2O since AOB contain as well the enzymes to reduce NO2- and NO, with
N2O as final product. These enzymes are the same as in regular denitrifying bacteria (DEN), but
that in AOB denitrification is not associated with growth [14].
Ammonia oxidation can also be performed by heterotrophic bacteria, which, however, do not gain energy from this conversion. Pure culture studies indicate that heterotrophic nitrification can emit more N2O than autotrophic nitrification [15].
Denitrification
Denitrification is performed by a diverse group of microorganisms, bacteria as well as archaea, which couple oxidation of organic or inorganic substrates to reduction of nitrate, nitrite, NO and N2O. As N2O is an intermediate in the denitrification process, incomplete denitrification
can lead to N2O emission. Many denitrifying microorganisms are facultative denitrifiers, which
preferentially use oxygen as electron acceptor, due to the higher energy yield [14]. The different steps involved in the denitrification are presented in Figure 9.
Total 2 NO3- + 4H+ + 4e- 2 NO2- + 2 H2O 2 NO2- + 4H+ + 2e- 2 NO + 2 H 2O 2 NO + 2H+ + 2e- N2O + H2O N2O + 2H+ + 2e- N2 + H2O 2 NO3- + 12H+ + 10e- N2 + 6H2O
Figure 9 – Conversion steps in the denitrification process (Otte, 2000).
Some microorganisms can denitrify under both aerobic and anoxic conditions, a process known as aerobic denitrification (Robertson et al., 1995). Often these microorganisms can also catalyze heterotrophic nitrification (Robertson et al., 1989).
Also AOB can denitrify from nitrite to N2O, with ammonium or hydrogen as the electron
11 Anaerobic ammonium oxidation bacteria (Anammox) can also denitrify, but do not use reduce nitrite through conventional denitrification via N2O and consequently are not expected to
emit N2O. It’s a particular type of denitrification, in which reduction of nitrite is coupled to
ammonia oxidation (Kartal et al., 2007). A schematic overview is present in Figure 10.
4e- NH3 NO2 - N2H4 N2 O2 NH3 Anammox (slow growing) AOA, AOB
Figure 10 – Schematic illustration of a known technique for microbially processing nitrogen [1].
In other words, Anammox bacteria obtain reducing equivalents for reduction of NO2
to N2
from the oxidation of NH4 +
rather than COD, with hydrazine (N2H4) as a critical intermediate. By
avoiding the use of COD as the source of reducing equivalents, more COD is available for recovery as CH4 [16].
In wastewater treatment, it is generally agreed that anoxic heterotrophic denitrification is the dominant process, meaning that aerobic denitrification and nitrifier denitrification only play a minor role. Both aerobic denitrification and nitrifier denitrification seem to yield (relative to the N-converted) more N2O than heterotrophic denitrification (Otte et al., 1996; Colliver and
Stephenson, 2000).
Chemical Reactions
Possible chemical pathways leading to N2O formation in WWTPs are the reaction between
NO2
and NH2OH leading to NO and N2O, and nitrite reductions with organic or inorganic
compounds. In the first reaction the intermediate NH2OH production by AOB is required,
12
Schematic Overview of Biological Nitrogen Conversions
The relevant biological nitrogen processes are schematically presented in Figure 11. Complete nitrification comprises step 1 and 2; Complete denitrification step 3-6.
N2O
NO
Figure 11 – Biological Nitrogen Conversions [15].
The biological steps in Figure 11 are synthesized in Table 3.
Table 3 – Biological Nitrogen Conversions [15].
Step Biological Reactions
1 Aerobic ammonia oxidation (autotrophic and heterotrophic AOB and AOA) 2 Aerobic nitrite oxidation (NOB)
3 Nitrate reduction to nitrite (DEN) 4 Nitrite reduction to nitric oxide (AOB and DEN) 5 Nitric oxide reduction to nitrous oxide (AOB and DEN) 6 Nitrous oxide reduction to dinitrogen gas (DEN) 7 Nitrogen fixation (not relevant in most WWTPs) 8 Ammonium oxidation with nitrite to dinitrogen gas (Anammox)
2.7
Domestic WWTPs as Engineered Systems
The microbial nitrogen transformation processes in a wastewater treatment plant are fundamentally the same as in other environments such as soil, marine and freshwater habitats. However, unlike most other environments, wastewater treatment plants are engineered systems designed to achieve high nitrogen conversion rates [16]. There are several key features that distinguish these plants from other environments:
13 Domestic wastewater usually contains relatively high concentrations of nitrogen, around 20 – 70 mg/L total nitrogen as N. In order to attain almost complete nitrogen removal within 3 – 8 h, high nitrogen loading rates are applied, incurring relatively high nitrification and denitrification rates. These are expected to impact on the rate of N2O
production [16].
Bacterial communities in the plants are subjected to rapid changes in process conditions that are applied to promote aerobic or anoxic microbial reactions. Such rapid changes in environmental conditions probably cause physiological stress to both the nitrifying and denitrifying communities, with the potential to induce transient behaviours [16].
Active aeration is used to induce aerobic conditions. The aeration systems are engineered to efficiently provide oxygen to the bioreactor, which also enables efficient transfer of N2O from the liquid phase to the gas phase. Therefore, any temporary
imbalance between N2O production and consumption could result in accumulation and
then stripping of N2O during aeration [16].
Activate sludge system is the most widely used form of secondary wastewater treatment. It refers to conversion of organic matter into CO2, water, and other inorganic
compounds, thus it can be appropriate where high removal of organic pollution is required. The process itself has flexibility and numerous modifications can be tailored to meet specific requirements (e.g. for nitrogen removal) [17].
Given that wastewater treatment systems are highly engineered systems, there are opportunities to mitigate N2O emissions by improving process design and/or operational
conditions [16].
2.8
Energy Consumption
A substantial disadvantage of the established methods for domestic wastewater purification is the higher energy consumption, which results chiefly from the high demand for delivery of air (or oxygen), for the oxidation reactions, and from the large quantities of wastewater that must be treated, transported, and as applicable heated, in wastewater treatment facilities [18]. Also, the operating costs of WWTPs in the recent years have increased substantially due to the increases in the unit cost of energy [19].
14
Net energy demand = energy demand for aeration – energy recovered from biogas combustion + energy of baseline plant operation
Equation 2 – Net energy demand for WWTPs [20].
2.9
Biogas Production
Anaerobic digestion is an established technology for the treatment of wastes and wastewater. It’s a simple process, with a low energy requirement, used to convert organic material, such as solid wastes and biomass, into biogas [21]. The biogas product is typically composed of 50-75% methane and 25-50% carbon dioxide. Depending on the feedstock, biogas can also contain significant amounts of hydrogen sulphide, water and traces of other chemical products, which are presented in Table 4.
Table 4 – Typical composition of biogas from normally functioning digesters [22].
Compound Chemical Range %
Methane CH4 50 – 75 Carbon dioxide CO2 25 – 50 Nitrogen N2 0 – 10 Hydrogen H2 0.01 – 5 Oxygen O2 0.1 – 2 Water vapour H2O 0 – 10 Hydrogen sulphide H2S 10 – 30,000 ppm Ammonia NH3 0.01 – 2.5 mg/m3
Biogas can be utilised for the production of heat, co-generation of electricity and heat or for upgrading to natural gas or fuel gas quality [23]. In WWTPs, biogas most often is used for processing into electricity and/or heat. Recovered generator heat can be used to dry the remaining digester solid for plant fertilizer, which can be sold for additional revenue for the WWTP [24].
The amount of energy used for a plant operation ranges between 20 – 50% of the total biogas energy contents depending on climate and technical specifications [21]. Due to the efficiency of energy conversion processes, preferred are processes involving the purification of biogas [23].
Purification of biogas is mainly focused on the removal of hydrogen sulphide and water [23], to prevent corrosion of installed equipment or to achieve adequate quality standards for use. A general overview of biogas usage and biomethane production is present in Figure 12.
15 Biomass feedstocks Raw biogas Heat Electricity Mechanical work Biomethane production Anaerobic digestion H2S removal Biomethane CO2 removal H2O removal Biogas usage Heat Burner Generation-set Biogas engine
Figure 12 – Schematic diagram of biogas usage and biomethane production (CALSTART White Paper, 2010).
Environmental Protection Agency (EPA) concluded that WWTPs with influent flow rate less than 19,000 m3/day didn’t produce enough biogas, to make its use as a renewable source economically feasible. This problem limits the use of biogas (for the plant in-field sustainable power generation) from the point of WWTP scale [19].
2.10
N
2O as a Powerful Oxidant in Combustion Reactions
N2O has a positive enthalpy of formation, releasing 82 kJ/mol when decomposed (Equation
3). Thermal decomposition of N2O occurs at approximately 850ºC, but the presence of a
transition metal oxide catalyst can enable self-sustaining decomposition and net energy production at decomposition temperatures as low as 300ºC.
Equation 3 – Decomposition of N2O [2].
The energy released by decomposition of 1 mole of N2O is approximately equivalent to the
energy released by combustion of 0.1 mole of CH4. When used to oxidize methane, N2O
increases the heat of reaction by -329 kJ/mol (Equation 4) as compared to O2 (Equation 5).
Equation 4 – Combustion of CH4 with N2O [2].
Equation 5 – Combustion of CH4 with O2 [2].
16
2.11
CANDO, a New Nitrogen Removal
Over the past two decades, European researchers have vastly improved treatment options for nitrogen removal using ecological “short-circuits” that avoid NO3
production. Examples include SHARON, OLAND, and CANON with Anammox. In these processes, NH4
+
is only partially oxidized to NO2
-, decreasing O2 requirements, and NO2
is reduced to N2 in three steps,
rather than four, conserving COD for energy recovery as CH4. This is achieved by implementing
a correspondingly adapted process control system and by using alternative microorganisms. Treatment of anaerobic digester centrate with Anammox has the potential to decrease energy consumption of a full-scale plant by > 50% and increase CH4 production by up to 25% [2].
Many processes recovery energy from waste COD as methane, but none recovers energy from NOD as nitrous oxide. A new nitrogen removal exploits the thermodynamic proprieties of N2O (chapter 2.10) for energy recovery and is referred as Coupled Aerobic-Anoxic Nitrous
Decomposition Operation (CANDO), which involves the following three steps:
I. Partial aerobic nitrification of NH4+ to NO2
-II. Partial anoxic denitrification of NO2
to N2O
III. N2O conversion to N2 with energy recovery via catalytic decomposition of
N2O or use of N2O as an oxidant of CH4
Step I and III in CANDO have been demonstrated at full-scale. Step I is achieved with the SHARON process: partial oxidation of NH4
+
to NO2
-. Full-scale SHARON processes have reported over 95% nitrogen removal efficiency. Accordingly, bench-scale experiments focused on step 2 [2].
Table 5 compares oxygen requirements, biomass production and energy recovery for complete nitrification-denitrification (“nit-denit.”) and three “short-circuit” nitrogen removal processes [2].
Table 5 – Theoretical upper bound for four N removal processes treating U.S per
capitanitrogen and BODL10 (Annex I, notes/assumptions).
Process SRT denit. (days) fs 0 denit.11 Oxygen (g day-1) Biomass (gCOD day-1) Energy (MJ day-1) Complete nit.-denit. 5 0.58 48 37 1.06 SHARON 5 0.58 37 27 1.36 CANON (Anammox) 60 0.14 21 13 1.78 CANDO 5 0.58 38 22 1.5612 10
Loads of 13.3 g-N (nitrogen) and 142 g-BODL, per day, respectively.
11
fs0 is defined as the maximum biomass yield expressed in dimensionless units. 12
17 The CANON process with Anammox (slow growing bacteria) has the highest theoretical energy recovery, the lowest O2 requirements, and the lowest biomass production. This is
followed by CANDO, which generates a smaller energy surplus because more oxygen is required for partial-nitrification and more COD is consumed for partial-denitrification [20].
If CANDO can be scaled up and its efficiency improved, or another N2O-producing strategy
developed, CANDO would be an attractive option in terms of footprint for nitrogen removal [2]. This process mitigates the release of N2O to the atmosphere [2] and relies upon faster growing
heterotrophic organisms, decreasing solids residence time and enabling more rapid start-up and recovery from disturbances [20].
2.12
Maximizing N
2O production, in WWTPs: Risks and Safety
From previous literature review, two substantial problems are identified, at WWTPs:
I.
Higher energy consumption leading to increased operating costs, due to the increases in the unit cost of energy (chapter 2.8);II.
N2O is a generated by-product, and it may leave via the effluent if reductionto N2 is incomplete (chapter 2.4). Enabling its emission into the atmosphere,
N2O can contribute to the greenhouse effect and consequently to global
climate change (chapter 2.2).
As researchers have never attempted to maximize N2O production rates, but have instead
focused on minimizing or eliminating N2O production in WWTPs [1], then if N2O gas is
recovered and purified in WWTPs, a chance to have this by-product recognized as a saving potential may be possible:
If N2O production is maximized in WWTPs, a chance to convert WWTPs into
higher energy generators may be possible. N2O increases the energy recovered in
combustion reactions, as compared to conventional process which uses O2 to
oxidize CH4, at WWTPs (chapter 2.10).
If N2O production is maximized in WWTPs, a chance to convert WWTPs into a
business company also may be possible, using N2O as the selling product. N2O is
commonly used to supercharge the engines of high performance vehicles (i.e. Nitrox) and as an oxidant in hybrid rocket motors in the aerospace industry [2].
18 As such, both options may mitigate the release of N2O to the atmosphere, through its
recovery from wastewater to the gas phase. However, there are some points that necessary need to be focused on the maximization process, concerning its risks and hazards to the environment. Safety strategies must be taken for instance.
N
2O From the Liquid Phase to the Gas Phase
In WWTPs, producing N2O in large quantities may cause a great formation of N2O in the
liquid phase, as in the activated sludge compartments where biological processes remain. Even though there’s a relatively high solubility of N2O in water (1.08 g/L at 25ºC, 1 atm [1]), if N2O is
subjected to active aeration then enables the efficient transfer of N2O from the liquid phase to
the gas phase, due to turbulences in water. In order to make sure that all N2O formed is stripped
to the gas phase, accurate control measurements (e.g. N2O microsensors), in situ, must be
taken to prevent N2O escaping via the effluent.
Infrastructures
In order to N2O gas be captured some kind of campanula must exist, and between it and the
biological tank(s) a pressured zone is created, allowing the N2O gas to be pulled in a particular
direction. It should be similar to the way biogas is removed from sludge digesters, at WWTPs.
The biogas zone areas are classified as ATEX zones (explosives atmospheres13), since CH4 is highly flammable, and therefore are associated with assured local safety conditions. N2O
is a non-flammable gas [42] so there is no major risks of explosion. However, N2O capturing
zone area may also be associated with assured local safety conditions, to prevent possible gas dispersion out of the capturing environment for instance.
In case the biological tank(s) are open air zones then handling infrastructures to cover the entire N2O capturing zone area, should be required. N2O gas can’t be allowed to escape, except
via the suction tube (e.g. campanula). In other words, there must only be one exit in which N2O
gas goes through.
13
Air mixtures with flammable substances (gases, vapors or dusts), in which, after ignition, combustion spreads to the entire unburned mixture.
19
2.13
Domestic WWTPs as Potential Sources of N
2O
In WWTPs the release of N2O from biological nitrogen removal processes has been
identified to be particularly influenced by the DO concentration and rapidly changing oxygenation conditions – i.e. periodical switch between anoxic and oxic conditions (Chandran et al., 2011). It has been observed that a low concentration in the aerated zones may enhance N2O production throughout the nitrifier denitrification pathway. At the same time, too high
aeration rates in the nitrification tank may lead to an increased oxygen introduction to the denitrification tank and lead to incomplete heterotrophic denitrification with enhanced N2O
emissions (Ahn et al., 2010, Kampschreur et al., 2009).
The main parameters leading to N2O emission are schematically presented in Figure 13.
Nitrification Low O2 N2O Denitrification Insufficient aeration NH4+ concentration Insufficient aeration Low SRT Toxic compounds Low temperature High NH4+ concentration
High O2 Low COD/N
Over-aeration nitrifying stage
Influent characteristics
Too efficient pre-sedimention
COD limitation
Nitrite transfer from nitrification stage
Figure 13 – Main process parameters leading to N2O formation and emission [14].
Within this context, the following aeration strategies will aim at comparing N2O emission
patterns.
2.13.1 Potential of Aeration Control: the impact of N-removal over Nitrite
At a bench-scale experiment, a study (from literature) investigated the potential of aeration control for the achievement of N-removal. The flocculent sludge used for inoculation was provided by the WWTP Thunersee (Switzerland), which treats N and P biologically in a continuous anaerobic-anoxic-aerobic process.
Granular sludge with N-removal over nitrite (NO2
-) and nitrate (NO3
-), respectively, was maintained in two SBRs. Conventional microbial nitrogen removal is carried out via-nitrate (chapter 2.6).
![Figure 7 – Locations where CH 4 and N 2 O can be emitted at a WWTP [14].](https://thumb-eu.123doks.com/thumbv2/123dok_br/19193521.950819/34.892.141.738.288.452/figure-locations-ch-n-o-emitted-wwtp.webp)
![Table 4 – Typical composition of biogas from normally functioning digesters [22].](https://thumb-eu.123doks.com/thumbv2/123dok_br/19193521.950819/40.892.129.766.524.729/table-typical-composition-biogas-normally-functioning-digesters.webp)
![Table 5 compares oxygen requirements, biomass production and energy recovery for complete nitrification-denitrification (“nit-denit.”) and three “short-circuit” nitrogen removal processes [2]](https://thumb-eu.123doks.com/thumbv2/123dok_br/19193521.950819/42.892.125.769.964.1096/compares-requirements-production-recovery-complete-nitrification-denitrification-processes.webp)
![Table 6 – N 2 O emissions with N-removal over nitrite and nitrate, respectively, with intermittent aeration and constant DO of 30% [26]](https://thumb-eu.123doks.com/thumbv2/123dok_br/19193521.950819/46.892.128.769.460.572/emissions-removal-nitrite-nitrate-respectively-intermittent-aeration-constant.webp)
![Figure 15 – N-removal over nitrate, with intermittent aeration [26].](https://thumb-eu.123doks.com/thumbv2/123dok_br/19193521.950819/47.892.246.649.265.533/figure-n-removal-nitrate-intermittent-aeration.webp)
![Figure 18 – Representative profiles of N 2 O emission rates, in the gas phase, measured at a full-scale domestic WWTP, located in Spain (La Roca de Vallès) [27]](https://thumb-eu.123doks.com/thumbv2/123dok_br/19193521.950819/49.892.229.665.685.979/figure-representative-profiles-emission-measured-domestic-located-vallès.webp)
![Figure 23 – N 2 O emission from a full-scale partial nitritation SHARON reactor, located in Rotterdam (Netherlands) [32]](https://thumb-eu.123doks.com/thumbv2/123dok_br/19193521.950819/53.892.140.755.471.945/figure-emission-partial-nitritation-sharon-reactor-rotterdam-netherlands.webp)
