1
A Work Project presented as part of the requirements for the Award of a Master’s Degree in Economics from INSPER and an International Master’s Degree in Finance from the NOVA – School of Business and Economics.
BEHAVIOR PROFILES AND INVESTMENTS
DANIELA RINO SANCHES - 32450
A Project carried out on the Master’s in Finance Program, under the supervision of: Professor. Dr. Ricardo Brito / INSPER and Professor Dr. Alexander Coutts / Universidade Nova de Lisboa
2
BEHAVIOR PROFILES AND INVESTMENTS
Abstract
This dissertation studies the connection between behavior and investment decision. Investors are usually guided based only on risk-tolerance level and their behavioral bias is not considered for portfolio construction. We study ANBIMA’s (Associação Brasileira das Entidades dos Mercados Financeiro e de Capitais) investors profile and its relationship with financial decision-making and long-term portfolio allocation. Some authors suggest incorporating behavioral questions in the risk-profile questionnaire made by financial institutions. We find that demographic information does not explain behaviors in Brazilian individuals. Furthermore, investors profile is useful to understand some characteristics and behaviors that should be considered in long-term investments portfolio.
Keywords: Behavioral Finance, Investor’s profile, Behavioral Biases, Investments
JEL Codes: D90, D91, G40, G41
1. Introduction
Irrational behavior is often observed in the investment decision-making process and biases can interfere with this process. The main objective of this study is to verify the influence of investor’s profiles in investments and if the risk-profile questionnaires used in Brazil are vulnerable to the presence of behavioral biases among investors. First step is to determine if it is possible to identify and classify these biases with demographic information about Brazilian investors. Next, we verify if the risk profile questionnaire submitted by Brazilian financial institutions to their clients is able to identify those biases prior to proposing investments.
3
Behavioral finance analysis emerged to complement traditional finance models, as a response to behavior not considered fully rational by classical models, related to investment decisions. Biases arise from the combination of investor’s beliefs and preferences. The behavioral finance literature identifies and categorizes biases in two main categories, cognitive and emotional, which should be moderated or adapted through adequate investment process, depending on investors’ characteristics. Cognitive biases are the ones formed from information processing or memory errors; emotional biases are raised from emotions, impulse, and intuitions. Kahneman and Riepe (1998) connected decision theory with financial advising, a prescriptive activity stating that “advisors must be guided by an accurate picture of the cognitive and emotional weaknesses of investors that relate to making investment decisions”.
Kahneman and Riepe (1998) also recommend actions to deal with some biases: biases of judgment or cognitive illusions – such as overconfidence, optimism and hindsight –, errors of preference – such as the tendency of people to value changes, not states and the use of purchase price as reference point –, and biases associated with the consequences of decisions – as omission and commission. As stated by the authors, investment decisions have emotional and financial consequences over time. Since investors deal with decision making as a gamble with unknown outcomes and their intuitions might play a role into that process, it is important to be familiar with client’s profiles to attend to theirs best interests.
Wealth management practitioners should be able to identify and take these behavioral biases when creating investment solutions for clients. Whether to adapt or moderate those biases depends on their clients’ level of wealth, as explored in Pompian and Longo (2005). The authors also suggested that alongside a risk profile questionnaire, clients should also answer a personality questionnaire. In another front, Pompian and Longo (2004) examined the link
4
between gender and investor behavioral bias, an issue that would also be among our interests in developing this study.
Clients are usually guided based only on risk profile questionnaires and their behavioral bias is not considered for long term portfolio. Unaware of their biases, investors occasionally tend to trust their intuitions on decision-making which can led them taking risks that they do not acknowledge or accusing others for bad outcomes. An advisor needs to encourage clients to adopt a broader view of their wealth and discuss long-term commitments with a realistic view of different investments outcomes, Kahneman and Riepe (1998). Pompian (2012a) argues about how compounding investor bias in portfolio construction can enhance the financial planners’ framework. Individuals tend to simplify the decision-making process by using only part of the information given, finding a solution that is not always the optimal one. By identifying and understanding this process, an advisor might improve economic outcomes and build a portfolio that the client would be willing to keep and be adherent to in the long term.
ANBIMA, a Brazilian entity that represents banks, brokers, asset management, and investment advisors in financial and capital market, with the purpose to self-regulate the market and represent those members, published a study about the relationship of individuals and their finances. That study associated individuals’ personal life with decision-making and investments. Anbima (2017) brought behavioral questions into finance environment among Brazilians.
Kahneman and Riepe (1998) advised understanding investor’s behaviors in a decision-making process. Using some concepts of behavioral finance, we intend to understand the association among Brazilian investor’s profiles developed by Anbima (2017) and investments solutions. This report will be developed as follows: in section 2, we review the literature in behavioral finance and investor psychology, with the purpose of developing a conceptual basis for the
5
analysis to be established, mainly with respect to the effects of behavioral biases in the investments decision-making processes; next, in section 3, we analyze Brazil’s directive system for investment suitability – investments recommendation complied with investors inclination, attitude towards risk and losses, and investment knowledge –, review recommendations and regulations proposed by ANBIMA and by the “Comissão de Valores Mobiliários - CVM” and look to identify how financial institutions translate those directives in their risk profile questionnaires and suitability procedures; section 4 we describe the methodology applied by Anbima (2017), and the data used to study investor’s profile; in section 5, results are present – social demographic variables do not explain behaviors, and the influence of investors’ behavioral profiles in investments decisions, and; finally, in section 6, we summarize our conclusions regarding the relationship between investors’ profiles and investment, and verify the possibility of adding personality questions in risk profile questionnaires in Brazil.
2. Literature review
Allais (1953), a relevant author for the literature in this field, showed that the theory of maximization of expected utility did not fit decision making under risk and uncertainty. After that, research in cognitive psychology and decision theory emerged developing what is considered the modern behavioral finance. Traditional finance theory considers that individuals follows the principles of expected utility, and claims that individuals are rational, and base their decisions on all available information started to be questioned – market efficiency.
Kahneman and Tversky (1979) created prospect theory, now viewed as the foundation of behavioral finance which examines biases of investors that differentiate from the rational investors in classical theory. Prospect theory assumes that gains and losses are valued differently by investors, so the final choice would be made based on perceived values of gains and losses instead of the final outcome. According to the authors, “Choices among risky
6
prospects exhibit several pervasive effects that are inconsistent with the basic tenets of utility theory. […] This tendency, called the certainty effect, contributes to risk aversion in choices involving sure gains and to risk seeking in choices involving sure losses.”
Investors usually tend to ignore the presence of their cognitive illusions in decision-making under risk and uncertainty. Advisors should accurate guide investors by moderating or adapting investors’ biases in portfolio allocation. In Kahneman and Riepe (1998), a practical application was proposed, challenging advisors into a prescriptive analysis into behavioral finance. Investors tend to be guided by the attractiveness of the options immediately available and financial planners need to encourage clients to adopt a broader view of investments.
Biases, defined by the authors as systematic errors of judgment, need to be previously identified by advisors and considered in the portfolio construction since financial decisions are made in a high uncertain environment. Investor’s profile developed by Anbima (2017) helps identifying some behaviors and behavioral biases described by Kahneman and Riepe (1998).
Investors and advisors still rely only on risk tolerance profile for investments decision-making, ignoring the presence of bias. Pompian and Longo (2004) advised about individual segmentation by personality type and gender and correlated with specific investor bias. The authors argue that some individuals should be saved from themselves in their portfolio allocation.
Pompian (2012a) identifies 20 behavioral biases in both emotional and cognitive areas, while describing how to diagnose each one of them. He also gives some advice on how to incorporate this information in financial markets. Additionally, he suggests diagnostic questions to identify behavioral bias that should be incorporated in interview processes or in risk profile questionnaires to help building a better asset allocation for investors.
7
Pompian (2012a) claims that behavioral finance analysis is being recognized by financial services firms when creating an asset allocation portfolio for high-net-worth investors. The author complements what Kahneman and Riepe (1998) attested as a proper financial approach. Financial planners should also consider clients’ interests derived from natural psychological preferences and behavioral bias. The suitable allocation is the one that not only aims at the efficient frontier but also simultaneously provide financial goals and psychological security for the client.
3. The current Brazilian investor profile environment
In Brazil, financial institutions have a risk profile questionnaire to address its clients. This questionnaire is required by the self-regulation ANBIMA, which represents financial institutions in Brazil and regulates suitability practice in financial markets, and its tendencies over time. This practice requires advisors to recommend only products that are suitable for the investor, considering their risk tolerance and financial goals. Each financial institution must submit a suitability questionnaire to their clients for risk tolerance identification, but the current process lacks a questionnaire to determine their personality profile or behavioral bias – an example of financial institutional risk-tolerance questionnaire can be found in Appendix 1. ANBIMA’s current guidelines on suitability processes asks market participants to obtain clients information about time frame for investments, preferences on risky options, investment purposes, client’s financial situation – income, wealth and financial assets –, and market knowledge – known products, frequency of trading and financial market experience. Besides that, the client is required to update this information minimally every 24-months. ANBIMA also requires that financial products are risk categorized based on liquidity, issuer’s risk profile and covenants information. However, investors’ profiles are not defined by ANBIMA; each financial institution can classify profiles differently.
8
Therefore, an improvement in ANBIMA’s current guidelines was proposed by some market participants to bring minimum parameters regarding investors risk profiles. These new guidelines, valid from 2019 on, requires a minimum of three different risk profiles – profile one is low risk tolerance with high liquidity; profile two includes investors that requires capital maintenance in long-term objectives; and profile three embraces those who accept losses pursuing higher returns.
Since the current requested parameters are focused on quantitative aspects of investors preferences, this suitability process is grounded only in risk tolerance, not in emotions or behavioral aspects of investors.
Nowadays, typically, the profile model in financial institutions is based on a 5-level risk profile, from conservative (1) to aggressive (5) depending on the total score derived from the given answers. The same investor could have different profiles in different institutions or portfolios as regulation requires investors answers different questionnaire for each portfolio on their accounts that are not shared between financial institutions; thus, one questionnaire can result in a conservative risk-tolerance level and another an aggressive one.
This regulation has been changing over the years to protect investors from unknown investments and unsuitable risks products. Another possible outcome from this regulation relies on confidence of investors’ answers on those risk profile questionnaires. Since ANBIMA prohibits product offering that is not suitable for the client, some of them could answer the questionnaire with the wrong intention. If an investor wants to receive the full offer of investments available, the answers given might not represent the correct tolerance of risk but will result in the most aggressive profile.
Brazilian questionnaires differ between each financial institution and the monitoring process is not ideal to help financial planners identify behavioral bias into client’s answers. The same
9
explanation is suitable in this scenario. Mistrust is also related to each separate question, making the identification process harder to achieve.
As indicate in Pompian (2012a), practitioners should rely on psychological information alongside with risk-profile to achieve better results in portfolio construction. As suggested by the author, those questionnaires could incorporate specific questions to deal with irrational behavioral bias identification. Since each questionnaire is different, this study will try to perceive the existence of specific questions that could give more precise information about behavioral bias.
Raising questions about personality type and gender and combining this information with risk-profile questionnaires might serve as a tool for financial planners in portfolio construction process.
One of the Brazilian financial market regulator, ANBIMA, published a study relating investors’ behaviors, conducts, and attitudes with investments and financial life. Anbima (2017) gathered information from 2,653 Brazilian investors argues that they connect investments with their stage of life and the purpose of wealth. The sample covered individuals over 16-years-old from social classes A, B and C through 130 cities in Brazil. Anbima (2017) categorizes investors in Brazil into five different profiles. Each of these profiles is related not only with investment risk but with future destination of financial resources, and personality characteristics. At appendix 2 we present Anbima (2017) complete questionnaire.
Constructor, Chameleon, Planner, Unconcerned and Dreamer (“Construtor, Camaleão, Planejador, Despreocupado, Sonhador”) were the profiles developed for by AMBIMA, which we describe next.
10
The first profile, Constructor, is the most disciplined of the profiles; he likes to always have control of the situation and struggles a lot to accomplish what he wants, always little by little, sparingly. He does not like to take chances, he would rather feel safe in all situations. And, as he has a system to accumulate slowly but surely, he always tends to stick to more guaranteed and predictable investments. or him, effort is an intrinsic part of the value of money. They want to see or have constant proof of money, they look for the sense of security and concreteness of cash in hand. This is the most common profile as only 30% of Brazilians fit with these characteristics.
The second profile, representing 29% of investors, Chameleon, is the one who accepts things as they are; he adapts to the world. Chameleon’s secret is to find pleasure and personal fulfillment in what it is more day-to-day, natural, and that requires little financial effort, and he copes well with the limits by adapting to them. Chameleons are predictable, steady and conservative people (in the sense of not seeking to change the situation in which they live), they do not have great ambitions. Money is something quite elusive in their life: not because they spend too much, but because they always have many debts.
Planner is the one characterized by pragmatic people, who live reality in full and know how to handle it well. Driven by challenges, they can accomplish what they want to. A Planner is very confident of his ability to organize and perform. For this segment, goals are fundamental. The Planner's relation with money itself (accumulated value) is very strong. The accumulation and financial growth are sources of pleasure that outweigh all others. He prioritizes the final result and does not measure efforts to gain more. This makes him a very flexible person in relation to various aspects of life – except in relation to his goal of earning and accumulating money. But it is important to note that he can also accumulate money in more concrete ways, for example,
11
acquiring goods, rather than investing directly in the financial market. This profile corresponds to 22% of Brazilians.
The fourth profile, the Unconcerned are people who have particular pleasure in the fluidity of life events. This causes the unconcerned not to plan or to commit himself very seriously to anything. He prefers to live intensely one day at a time. On the other hand, people in this segment are very competent in taking advantage and embarking on opportunities that turn up. The Unconcerned’s relationship with money is fleeting. He tends to spend without thinking, because he wants instant gratification, he lives today. This profile represents only 11% of the population.
The last profile, the smallest group, with 6% of the population, the Dreamer is driven by dreams. He has a restless mind, is always thinking of a new opportunity to invest in something, to undertake – but always with passion influencing his choices. His dreams are always built upon values and strong personal beliefs – that is why the dreamer is so resilient. Deep down, this is an impulsive, daring profile that trusts the future a lot. Freedom is a very important value. Therefore, the rules may represent limitations in the pursuit of his dream. Money is mainly a means to realize the dream.
The general goals of this study are to assess the influence of investor’s profile in financial decisions and to propose alternatives for advisors to address these concerns in order to serve the best long-term interest of their clients. Financial institutions divide investors in risk profiles obtained with responses in specific questionnaires, and then suggest a portfolio allocation. We intend to verify the relationship between investor’s profile and investment decision.
Notwithstanding, thispaper intends to discuss the inclusion of information on the investor’s bias into the process of building an asset allocation for investors in Brazil. Additionally, it
12
intends to investigate the inclusion of questions in risk profile questionnaires to enhance the financial advising processes, as suggested by behavioral literature.
4. Methodology and report plan
After a literature review on the theme and an analysis of documentation from Brazilian regulatory institutions and agencies regarding regulation of investment practices, our basic methodology involves analysis of examples of risk profile questionnaires used by Brazilian financial institutions, and of model questionnaires proposing assessment of psychological characteristics of investors as related to investment behavior. Regarding the Anbima (2017) database, our methodology will be based on a multivariate logit to infer about Brazilian investor’s profiles.
Questionnaires and behavioral identification requires a qualitative research analysis to help us answer what type of bias we can identify, depending on the given answer. “Content analysis is a research method that uses a set of procedures to make valid inferences from the text” (Weber 1990). As described in Saunders, Lewis and Thornhill (2012), the first step in a qualitative analysis is to categorize data. Weber (1990) states that this is more than merely counting words, a qualitative content analysis requires interpretation of context and patterns identification. This is a continuous process to extract meaning from text with quality, summarize information and generate results.
With this research method in mind, we reviewed more than 10 financial institutions risk-profile questionnaires that attends Brazilian investors in Brazilian market, regarding investments solutions to understand which type of bias each question should reveal. After that, we compared those possible questions with Pompian (2012b)’s suggestion in his 10-question BIT orientation
13
quiz. Finally, we compared those results with Anbima (2017)’s questionnaire to describe the main traits of behaviors.
Anbima (2017) compiled 2,653 interviews with an 8-question test (p1 – p8 of the questionnaire in Appendix 2). A multivariate logistic regression analysis was used to calculate the probability of each investor fits to each of those five profiles. The multinomial logit model serves when the dependent variable, the profile, is a categorical variable; in this case, we have five profiles – that cannot be ordered in any meaningful way, and the objective is to calculate the probability to fit in one of those categories.
With the 8-question test answers, we categorized each investor in the most probable profile of those five. It is important to note that an individual will be in the profile that has predominant characteristics but may have some characteristics of another one.
Based on ANBIMA’s complete survey, we attempt to explain if some basic or demographic information could be helpful in explaining some behaviors. For that purpose, we analyzed the most common information regarding individuals, such as age, gender, education, income, and career, and whether this information can significantly explain behavior.
Regarding the financial institution’s questionnaires analyzed, we noticed that 85% ask if the client had any knowledge in finance (question 3 of risk-profile questionnaire in Appendix 1 and question p20 of Anbima in Appendix 2). This same approach was made by Pompian (2012b) that also highlighted the importance of this kind of questions in his BIAS questionnaire. Another important factor, asked by 85% of the financial institutions, touches on the motivation for investment decision (question 1 of risk-profile questionnaire in Appendix 1 and question p10.7, p10.8 and p10.31 of Anbima in Appendix 2). Similarly, both Anbima (2017) and Pompian (2012b) emphasized how this can be vital to bias identification. Beyond that, the most relevant question asked in 92% of the risk-profile questionnaire studied is related to loss
14
aversion in some detailed investment scenario (questions 6 and 7 of risk-profile questionnaire in Appendix 1 and question p10.5 of Anbima in Appendix 2). That information is founded in ANBIMA’s questionnaire and in Pompian (2012b) BIT identification quiz.
The analysis hereby conducted will be focused on investments knowledge, investments made and the relevance of these for behavior profiles. Given that 85% of risk-profile questionnaires have specific questions about this topic, is fair to infer that Brazilian financial institutions also want to know this type of information (question 8 of risk-profile questionnaire in Appendix 1 and question p20 and p21 of Anbima in Appendix 2). Nonetheless, ANBIMA differs from financial institutions and divides its questions about investments between previous knowledge on the subject and existing or current investments in financial instruments.
5. Results
15.1 Life-cycle and behavioral profiles
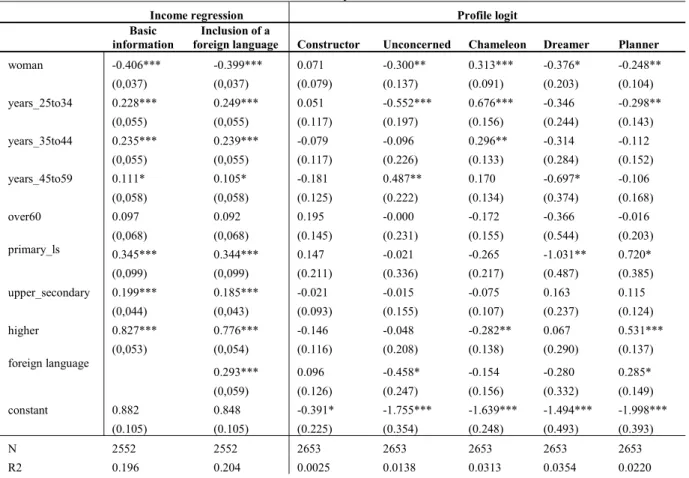
The first aspect we checked regards income and the life-cycle hypothesis on Table 1. Data showed the known and positive relationship among income and age, and among income and school degree – attainment. Another known pattern is the negative relation between income and gender – which states that being a woman is associate with lower levels of income when compared to man. Additional recognized information extracted in this database is the income difference prevailing through Brazilian regions – North and Northeast regions were negative and significant when compared to Southeast, the richest region in the country.
The positive and significant result of the life-cycle hypothesis allowed us to continue studying the results about investor’s profile and behavior. Another interesting outcome refers to individuals with foreign language skills. It shows a significant and positive relationship with
15
income, meaning that it could be complementary information on the educational quality that adds income to the individual.
Since the ANBIMA profile is a categorical variable, we used logit instead of linear regression to study the effect of those variables. Analyzing each profile independently, we could observe that some demographic variables are important for some of them, but when analyzing them together in a multivariate logit, we noticed that they were not significantly relevant to differentiate one profile from another.
Tabel 1 - Life-cycle information
Income regression Profile logit
Basic information
Inclusion of a
foreign language Constructor Unconcerned Chameleon Dreamer Planner woman -0.406*** -0.399*** 0.071 -0.300** 0.313*** -0.376* -0.248** (0,037) (0,037) (0.079) (0.137) (0.091) (0.203) (0.104) years_25to34 0.228*** 0.249*** 0.051 -0.552*** 0.676*** -0.346 -0.298** (0,055) (0,055) (0.117) (0.197) (0.156) (0.244) (0.143) years_35to44 0.235*** 0.239*** -0.079 -0.096 0.296** -0.314 -0.112 (0,055) (0,055) (0.117) (0.226) (0.133) (0.284) (0.152) years_45to59 0.111* 0.105* -0.181 0.487** 0.170 -0.697* -0.106 (0,058) (0,058) (0.125) (0.222) (0.134) (0.374) (0.168) over60 0.097 0.092 0.195 -0.000 -0.172 -0.366 -0.016 (0,068) (0,068) (0.145) (0.231) (0.155) (0.544) (0.203) primary_ls 0.345*** 0.344*** 0.147 -0.021 -0.265 -1.031** 0.720* (0,099) (0,099) (0.211) (0.336) (0.217) (0.487) (0.385) upper_secondary 0.199*** 0.185*** -0.021 -0.015 -0.075 0.163 0.115 (0,044) (0,043) (0.093) (0.155) (0.107) (0.237) (0.124) higher 0.827*** 0.776*** -0.146 -0.048 -0.282** 0.067 0.531*** (0,053) (0,054) (0.116) (0.208) (0.138) (0.290) (0.137) foreign language 0.293*** 0.096 -0.458* -0.154 -0.280 0.285* (0,059) (0.126) (0.247) (0.156) (0.332) (0.149) constant 0.882 0.848 -0.391* -1.755*** -1.639*** -1.494*** -1.998*** (0.105) (0.105) (0.225) (0.354) (0.248) (0.493) (0.393) N 2552 2552 2653 2653 2653 2653 2653 R2 0.196 0.204 0.0025 0.0138 0.0313 0.0354 0.0220 Legend: *** Significant at the 1 percent level; ** Significant at the 5 percent level; * Significant at the 10 percent level.
(standard error)
N: number of observations R2: coefficient of determination
Woman: dummy variable =0 if male and =1 if female
Years: incremental dummy variable. For example, a 36-year-old would have years_25to34=1 and years_35to44=1
Attainment: incremental dummy variable. For example, an individual who had completed lower secondary level or is in college would have primary_ls=1 and upper_secondary=1 and higher=0
16
5.2 Individual categories
Afterwards, reflecting about individual’s behavior, Anbima (2017) asked another 35 questions related to conduct and attitude, beyond the 8-questions used to establish the profiles. Firstly, we grouped them into 4 main individual categories: forward-looking, unpredictable, objective, and objectless. Some attitude question could fit in more than one category since they have some intersections, for example, a forward-looking individual can also have objective conduct. For that purpose, we made regressions with the behaviors related questions and demographic variables alongside with profile dummies.
Forward-looking behavior could be perceived in questions like: “I try to save so I may have later what I dream of”, “I would rather build my assets gradually without taking risks” and “I do not buy anything I do not need”. By combining those behaviors questions with demographic information and adding profiles, we could notice that profiles were significant and positive in every question and those two profiles that are concerned with future and planning are the higher coefficients, an expected result – Planner and Constructor. Anbima (2017) used this comparison approach differently, they tabulated profiles answers, and concluded that Planner and Constructor were the most worried about financial control. Absence of concern was found in Unconcerned and in Chameleon, sometimes.
At the same time, studying behavior for the unpredictable individual – “When some money comes in, it is already committed with overdue accounts” and “I do not bother to set goals for my life” – those profiles less related to planning showed higher coefficients and, in most cases, school had a negative impact on those behaviors.
The other pair of opposite behaviors, objective and objectless, also results in significant profiles and expected results. The planner and the constructor showed the highest coefficients in objective behavior – sentences like “I am very disciplined and think twice before spending
17
money” and “I do not buy anything I do not need”, reflect those type of objective behaviors, but the dreamer is also high, which was also anticipated given the profile is defined as a future driven individual and those sentences also represent it. Alternatively, “I do not like to plan too much; I let things happen” and “I am a person with plenty of ambitions” may demonstrate objectless behaviors, which result in significant and negative relationship with schooling and higher coefficients for profiles such as the unconcerned and the chameleon.
5.3 Profiles and behaviors relationship
Since the demographic variables were not significant to explain neither profiles nor behaviors, we tried to determine associations between the latter two, employing logit and multinomial logit models to study associations of profiles and behaviors. We first developed a multinomial logit model for profile as dependent variable and all 35 behavior items as independent ones. The results were relatively weak, only two items were significant for all profiles, p10h – “I plan my finances and create future goals for myself”, and p10ah – “I have an entrepreneurial spirit”. So, in a direct way, it would not be practical, or valid, to use the responses to the behavior items to classify individuals in the profiles developed in the survey.
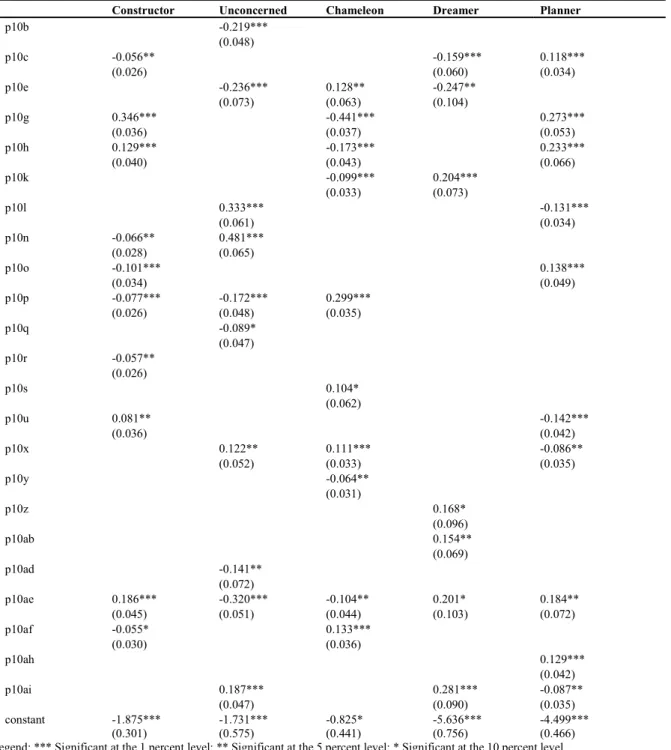
A second approach to using behavior to help determine profile would be in borderline cases, when someone is seen as having similar chances to belonging to two or more profiles, which was determined employing some other methodology. For example, results from separate logit regressions, developed for each profile, with results shown in Table 2, could help, in principle, decide which profile someone fits best, by comparing responses to selected items (which would be different for each profile, as can be seen from the table). This is still relatively weak in general terms, but, in some specific situations, as mentioned above, this table could be used to make a decision in terms of profile assignment, at least in a preliminary way, which could be later confirmed or not, depending on the availability of more information about the individual.
18 Table 2 – Profiles and behaviors
Constructor Unconcerned Chameleon Dreamer Planner
p10b -0.219*** (0.048) p10c -0.056** -0.159*** 0.118*** (0.026) (0.060) (0.034) p10e -0.236*** 0.128** -0.247** (0.073) (0.063) (0.104) p10g 0.346*** -0.441*** 0.273*** (0.036) (0.037) (0.053) p10h 0.129*** -0.173*** 0.233*** (0.040) (0.043) (0.066) p10k -0.099*** 0.204*** (0.033) (0.073) p10l 0.333*** -0.131*** (0.061) (0.034) p10n -0.066** 0.481*** (0.028) (0.065) p10o -0.101*** 0.138*** (0.034) (0.049) p10p -0.077*** -0.172*** 0.299*** (0.026) (0.048) (0.035) p10q -0.089* (0.047) p10r -0.057** (0.026) p10s 0.104* (0.062) p10u 0.081** -0.142*** (0.036) (0.042) p10x 0.122** 0.111*** -0.086** (0.052) (0.033) (0.035) p10y -0.064** (0.031) p10z 0.168* (0.096) p10ab 0.154** (0.069) p10ad -0.141** (0.072) p10ae 0.186*** -0.320*** -0.104** 0.201* 0.184** (0.045) (0.051) (0.044) (0.103) (0.072) p10af -0.055* 0.133*** (0.030) (0.036) p10ah 0.129*** (0.042) p10ai 0.187*** 0.281*** -0.087** (0.047) (0.090) (0.035) constant -1.875*** -1.731*** -0.825* -5.636*** -4.499*** (0.301) (0.575) (0.441) (0.756) (0.466) Legend: *** Significant at the 1 percent level; ** Significant at the 5 percent level; * Significant at the 10 percent level.
(standard error)
p10b: Level of agreement – I am very disciplined and think twice before spending money.
p10c: Level of agreement – I do not need to make much effort for my personal accomplishments.
p10e: Level of agreement – I would rather build my assets gradually without taking risks.
p10g: Level of agreement – I control myself financially, and always save part of what I earn.
p10h: Level of agreement – I plan my finances and create future goals for myself.
p10k: Level of agreement – My need of achievements is endless. p10l: Level of agreement – I do not like to plan, I prefer to let things happen. p10n: Level of agreement – Money is meant for spending, and to give us pleasure
p10o: Level of agreement – I really like to be in new places, get to know new people and live different experiences.
p10p: Level of agreement – When some money comes in, it is already committed with overdue accounts.
p10q: Level of agreement – If a financial need occurs, I will certainly have to turn to family and friends.
p10r: Level of agreement – My debts are related to patrimony building. p10s: Level of agreement – I am always trying to better organize my financial life. p10u: Level of agreement – You can be happy with only the essential - money is not everything in life.
p10x: Level of agreement – I often mess up with money on an everyday basis. p10y: Level of agreement – I would risk the money I have saved to realize an idea I have in my head.
p10z: Level of agreement – I live with my head in the future and I usually follow my intuition.
p10ab: Level of agreement – I would rather invest in my dreams instead of having a steady job that I do not like.
p10ad: Level of agreement – I know exactly where I am getting at. p10ae: Level of agreement – I try to save so I may have later what I dream of. p10af: Level of agreement – I do not buy what I do not need.
p10ah: Level of agreement – I have an entrepreneurial spirit. p10ai: Level of agreement – I do not bother to set goals for my life. Level of agreement – from complete disagreement to totally agreement.
19
5.4 Savings and retirement
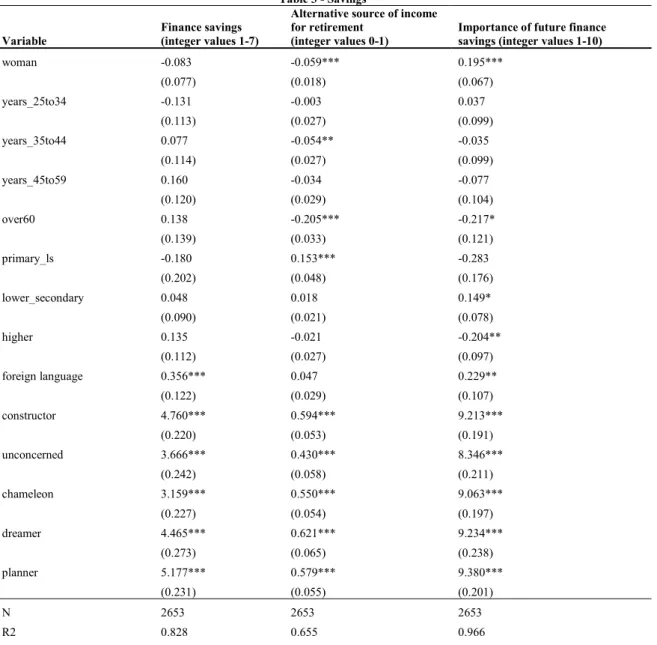
Next, we investigated the relationship between profiles, demographic variables and financial life. We have analyzed this topic by developing linear regression models for three variables, separately: Finance Savings, Alternative Source for Retirement, and Future Savings (Table 3). The profile variables are very significant, and their coefficients need to be read as absolute values in their range scales, which vary (see Table 3), as we did not use constants in the models. Thus, one should compare the profiles’ coefficients to analyze their effects, and, as they are exclusive, i.e., if one has value 1, the others have value 0, one does not have additive effects for profile variables, as an individual cannot assume two different profiles.
In general, the results show that demographic variables are not very important when discussing savings, many not being statistically significant and, even when they are significant, their coefficients are smaller than differences between coefficients of profiles.
The demographic variables that showed significance were sex, education and (older) age, in the last two columns of Table 3. Women are less concerned with saving to complement public retirement income, while more concerned with having future savings, a seemingly contradictory result. But possibly, despite recent changes in Brazilian society, where women have become more economically active, they may still consider themselves as a secondary source of family retirement income. So, even though women may be more concerned with future savings, that would not necessarily be related to retirement income. People 60 and over are not interested in saving for retirement, likely because most of them are already retired an cannot change their financial situation anymore. Those with low educational level tend to be concerned with saving for having extra income after retirement (column 2). Those at higher educational level seem not to be concerned with future savings, while those with intermediate level of education showed some concern with that (column 3).
20
Profiles were all significantly associated with all three aspects analyzed, but one must have in mind that each dependent variable assumed a different range of values (see Table 3). Thus, one should interpret the coefficients for each profile as the average of response values for those with that profile in the reference for all demographic variables (all set to 0). For financial savings, Planner and Constructor were the ones with highest effects, Chameleon and Unconcerned the lowest, both expected results. For savings to complement public retirement funds, Dreamer showed highest and Unconcerned the lowest levels, again not unexpected. The last column, regarding importance of future savings, shows that Unconcerned shows a lower level of concern than the others, while the remaining ones show relatively similar coefficients, so that the profile variable is less important, in terms of effect size, for this aspect of savings.
Besides the general information about profiles and savings, this last attempt would be better adjusted if more information were provided regarding retirement options, financial reserve and profiles.
21 Table 3 - Savings
Variable
Finance savings (integer values 1-7)
Alternative source of income for retirement
(integer values 0-1)
Importance of future finance savings (integer values 1-10)
woman -0.083 -0.059*** 0.195*** (0.077) (0.018) (0.067) years_25to34 -0.131 -0.003 0.037 (0.113) (0.027) (0.099) years_35to44 0.077 -0.054** -0.035 (0.114) (0.027) (0.099) years_45to59 0.160 -0.034 -0.077 (0.120) (0.029) (0.104) over60 0.138 -0.205*** -0.217* (0.139) (0.033) (0.121) primary_ls -0.180 0.153*** -0.283 (0.202) (0.048) (0.176) lower_secondary 0.048 0.018 0.149* (0.090) (0.021) (0.078) higher 0.135 -0.021 -0.204** (0.112) (0.027) (0.097) foreign language 0.356*** 0.047 0.229** (0.122) (0.029) (0.107) constructor 4.760*** 0.594*** 9.213*** (0.220) (0.053) (0.191) unconcerned 3.666*** 0.430*** 8.346*** (0.242) (0.058) (0.211) chameleon 3.159*** 0.550*** 9.063*** (0.227) (0.054) (0.197) dreamer 4.465*** 0.621*** 9.234*** (0.273) (0.065) (0.238) planner 5.177*** 0.579*** 9.380*** (0.231) (0.055) (0.201) N 2653 2653 2653 R2 0.828 0.655 0.966
Legend: *** Significant at the 1 percent level; ** Significant at the 5 percent level; * Significant at the 10 percent level. (standard error)
N: number of observations R2: coefficient of determination
Woman: dummy variable =0 if male and =1 if female
Years: incremental dummy variable. For example, a 36-year-old would have years_25to34=1 and years_35to44=1
Attainment: incremental dummy variable. For example, an individual who had completed lower secondary level or is in college would have primary_ls=1 and upper_secondary=1 and higher=0
Foreign language: dummy variable =1 if individual has a fluency in a foreign language Finance savings: level of financial savings – 1 to 7
Alternative source of income for retirement: dummy variable = 1 if the individual thinks about an alternative source of income to retirement besides current one and government program, otherwise zero (question p17 of Anbima’s questionnaire in Appendix 2)
Importance of future finance savings: Importance of saving money – 1-10 (question p19 of Anbima’s questionnaire in Appendix 2)
5.5 Investments and behavioral profiles
Regarding investments, the survey (Anbima, 2017) follows the same purpose as most Brazilian financial institutions risk-profile questionnaires. It is related to the knowledge about financial
22
products, the investments made and the time of each one of the investments. However, some caveats need to be made in this topic. The question had some yes-or-no options, and an open item in which the individual could answer anything. Someone could answer in a straightforward way about that alternative or could made a broader interpretation about the product. For example, one of the items was: fixed income, like money market. This could be classified as a conservative option as a liquidity market, or as a bond that could be illiquid and face some issuer risk. For simplification purposes, we created labels as fixed income was classified as money market. The same approach was adopted with currency exchange. An individual may see this as an alternative and diversified investment, while others could see as speculative, so we labeled it as a risky option of investment. Some individuals answered the open item with “investment fund with no specification”. We classified those as hedge fund.
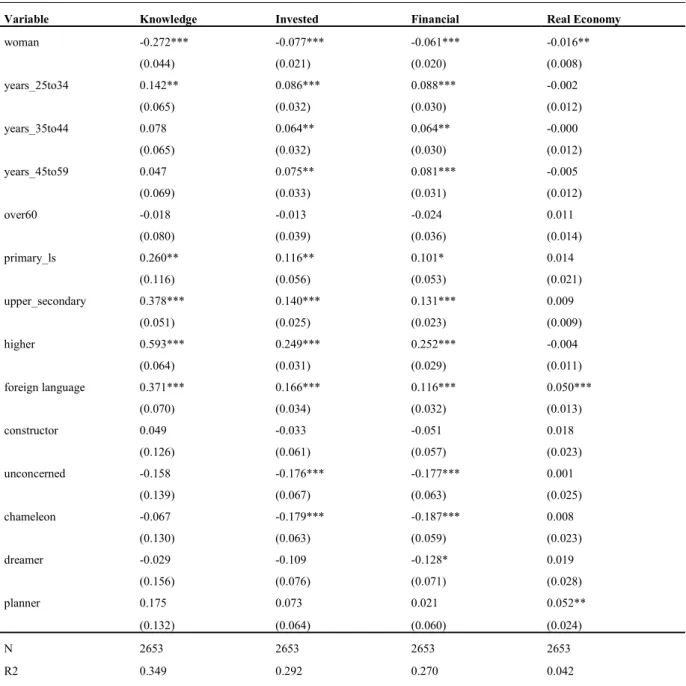
Table 4 concerns the different category of investments calculated as a quantity. The first column regards knowledge of investment products, which calculates how many different products an individual stated as knowing. This is the broader aspect of investment. The second one concerns about the number of products that the individual invests. Then, we split the total number of investments made between financial investments, for example savings account, money markets, hedge funds, currencies, stocks and bonds, and real economy investment, such as different types of business - real state, franchising, agribusiness, general commerce among others.
That analysis concluded that women know and invest less than men in any category. Educational attainment was also a significant variable with a positive signal, showing that an individual with more years of study tends to invest more. Regarding profiles, they were significant and negative for investments in the case of Unconcerned and Chameleon, and positive for investing in the real economy for Planner and Dreamer. The real economy
23
investment for these two profiles was also highlighted as entrepreneurship mindset in Anbima (2017).
Table 4 - Total Investments
Variable Knowledge Invested Financial Real Economy woman -0.272*** -0.077*** -0.061*** -0.016** (0.044) (0.021) (0.020) (0.008) years_25to34 0.142** 0.086*** 0.088*** -0.002 (0.065) (0.032) (0.030) (0.012) years_35to44 0.078 0.064** 0.064** -0.000 (0.065) (0.032) (0.030) (0.012) years_45to59 0.047 0.075** 0.081*** -0.005 (0.069) (0.033) (0.031) (0.012) over60 -0.018 -0.013 -0.024 0.011 (0.080) (0.039) (0.036) (0.014) primary_ls 0.260** 0.116** 0.101* 0.014 (0.116) (0.056) (0.053) (0.021) upper_secondary 0.378*** 0.140*** 0.131*** 0.009 (0.051) (0.025) (0.023) (0.009) higher 0.593*** 0.249*** 0.252*** -0.004 (0.064) (0.031) (0.029) (0.011) foreign language 0.371*** 0.166*** 0.116*** 0.050*** (0.070) (0.034) (0.032) (0.013) constructor 0.049 -0.033 -0.051 0.018 (0.126) (0.061) (0.057) (0.023) unconcerned -0.158 -0.176*** -0.177*** 0.001 (0.139) (0.067) (0.063) (0.025) chameleon -0.067 -0.179*** -0.187*** 0.008 (0.130) (0.063) (0.059) (0.023) dreamer -0.029 -0.109 -0.128* 0.019 (0.156) (0.076) (0.071) (0.028) planner 0.175 0.073 0.021 0.052** (0.132) (0.064) (0.060) (0.024) N 2653 2653 2653 2653 R2 0.349 0.292 0.270 0.042
Legend: *** Significant at the 1 percent level; ** Significant at the 5 percent level; * Significant at the 10 percent level. (standard error)
N: number of observations R2: coefficient of determination
Woman: dummy variable =0 if male and =1 if female
Years: incremental dummy variable. For example, a 36-year-old would have years_25to34=1 and years_35to44=1 Attainment: incremental dummy variable. For example, a college student would have elementary=1 and secondary=1 Foreign language: dummy variable =1 if individual has a fluency in a foreign language
Knowledge: total number of different investments products that the individual knows Invested: total number of different investments products that the individual invests Financial: total number of investment knowledge on financial products
24
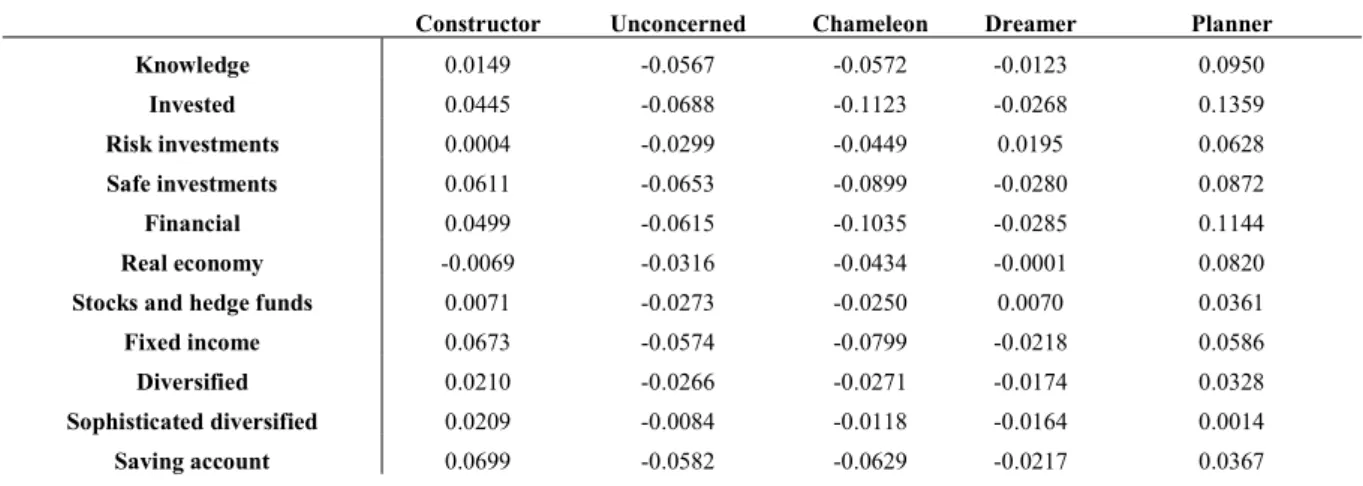
The correlation between profiles and investments variables are described in the Table 5, where we could notice that Constructor and Planner are positively correlated with knowledge and investment itself. Unconcerned and Chameleon showed negative correlations with investments in general.
Table 5 – Correlation between profiles and investment variables
Constructor Unconcerned Chameleon Dreamer Planner Knowledge 0.0149 -0.0567 -0.0572 -0.0123 0.0950 Invested 0.0445 -0.0688 -0.1123 -0.0268 0.1359 Risk investments 0.0004 -0.0299 -0.0449 0.0195 0.0628 Safe investments 0.0611 -0.0653 -0.0899 -0.0280 0.0872 Financial 0.0499 -0.0615 -0.1035 -0.0285 0.1144 Real economy -0.0069 -0.0316 -0.0434 -0.0001 0.0820 Stocks and hedge funds 0.0071 -0.0273 -0.0250 0.0070 0.0361 Fixed income 0.0673 -0.0574 -0.0799 -0.0218 0.0586 Diversified 0.0210 -0.0266 -0.0271 -0.0174 0.0328 Sophisticated diversified 0.0209 -0.0084 -0.0118 -0.0164 0.0014 Saving account 0.0699 -0.0582 -0.0629 -0.0217 0.0367 Legend: Knowledge: total amount of different investments products that the individual knows
Invested: total amount of different investments products that the individual invests Risk investments: total amount of investment knowledge on currencies, stocks, hedge funds
Safe investments: total amount of investment knowledge on saving account, money market and government bonds Financial: total amount of investment knowledge on financial products
Real economy: total amount of investment knowledge on real economy investments Stocks and hedge funds: total amount of investment knowledge on stock exchange Fixed income: total amount of investment knowledge on savings account and money market Diversified: dummy variable = 1 if the individual invests both in financial product and real economy
Sophisticated diversified: dummy variable = 1 if the individual invests in stocks, hedge funds and fixed income Saving account: dummy variable = 1 if the individual invests in savings accounts
6. Conclusions
Our study concerns the need to understand the presence of bias in investment decisions and uses ANBIMA’s profiles as reference for our analysis, described briefly as follows. A Constructor does not like to take risks but is the most disciplined, humble and persistent. Unconcerned is the most optimistic profile, with an emotional way of dealing with life, tending to be focused in the present. Chameleon is characterized as those who are used to adapt to every situation, being the most fleeting of them and regarded as more emotional than rational. Dreamer describes those who tend to show overconfidence in their own abilities, which lead them to invest in ideas, the characteristic of entrepreneurs. A Planner sets goals and is
25
determined to achieve what has been planned. In this profile, the intrinsic value of money is central and wealth grow is among his main goals.
In section 5.1 we observed that demographic variables were not significantly relevant to differentiate one profile from another. In section 5.2 we studied further behavioral questions, developed an analysis of four types of attitudes (forward-looking, unpredictable, objective, and objectless), and observed expected associations with the four profiles. In section 5.3, we perceived that the previous information could help determine profile depending on the availability of more information about the individual since some behaviors are related to a specific profile, but not to another, necessarily. Results in section 5.4 showed that demographic variables have weaker associations, in this case to savings and investments variables, than profiles. For financial savings, Planner and Constructor were the highest effects, and regarding the importance of future savings, Unconcerned shows a lower level of concern, as expeted. In section 5.5, we noticed that Anbima (2017) follows the same approach as Brazilian financial institutions and profiles as Planner and Dreamer are significantly positive for investment in the real economy, whilst Unconcerned and Chameleon are significantly negative for investments in general.
Understanding the relationship between those profiles and investment attitudes is useful for financial institutions as well. Looking at the behavior relationship between profiles and investments information, we think that it is important to understand which profile an individual fit in order to propose a suitable and effective portfolio allocation for a client, guiding investors to make decisions for the long-term portfolio investment.
Considering the literature suggestion about adding attitude and behavior items to risk profile questionnaires, as proposed by Pompian and Longo (2004) and Pompian (2012b), the 8-question survey that Anbima (2017) provided could be used as a proxy to categorize
26
individual’s profiles as additional information to typical financial institutions risk-profile questionnaires. For future research, we suggested a deeper analysis of financial institutions risk-profile questionnaires to incorporate behavioral questions.
References
Allais, M., 1953. "Le comportement de l'homme rationnel devant le risque: critique des postulats et axiomes de l'école Américaine". Econometrica. 21 (4): 503–546.
Anbima, 2017. “A trajetória financeira do brasileiro”, available at
http://www.anbima.com.br/data/files/76/83/F1/CF/9297F5108901E1F599A80AC2/Relatorio-A-trajetoria-financeira-do-brasileiro.pdf
Kahneman, D., Tversky, A., 1979. “Prospect theory: an analysis of decision under risk”. Econometrica: Journal of the Econometric Society, p. 263-291, 1979
Kahneman, D., Riepe, M., 1998. “Aspects of investor psychology”, Journal of Portfolio Management, vol 24, no. 4, Summer 1998, p. 52-64.
Pompian, M.M., Longo, J.M. Longo, 2004. "A new paradigm for practical application of behavioral finance: creating investment programs based on personality type and gender to produce better investment outcomes." Journal of Wealth Management Fall 2004, 7, p. 9-15. Pompian, M.M., Longo, J.M., 2005. “Incorporating Behavioral Finance into your practice.” Journal of Financial Planning. March 2005, Vol. 18, Issue 3, pp. 58-63.
Pompian, M.M, 2012a. “Behavioral Finance and Wealth Management”, New Jersey, John Wiley & Sons, Inc., 2nd edition.
Pompian, M.M., 2012b. “Behavioral Finance and Investor Types”, New Jersey, John Wiley & Sons, Inc.
27
Saunders, M. Lewis, P. and Thornhill, A., 2012. “Research Methods for Business Students” 6th edition, 2012, Pearson
Weber, R., 1990. “Basic Content Analysis”, 2nd edition, Sage University Papers Series on Quantitative Applications in the Social Sciences, series no. 07-049), Sage.