“Trade Credit and Bank Information Monopoly: An Empirical evidence
from Portuguese Small Medium Size Enterprises”
Trade Credit and Bank Information Monopoly: An Empirical evidence from Portuguese Small Medium Size Enterprises
Resumo:
A literatura acerca do relacionamento entre bancos e empresas, sustenta que; uma relação de proximidade caracterizada pela troca de informação privilegiada, permite a redução da assimetria de informação, e, deste modo, a obtenção de crédito em condições mais vantajosas. Todavia esta vantagem informacional proporciona ao banco (Hausbank) um monopólio de informação, que lhe permite aumentar no futuro as taxas de juro (hold-up problem), uma vez que os bancos externos a esta relação, apresentam relutância em propor condições de crédito mais vantajosas. Neste contexto, o crédito de fornecedores, obtido junto dos mesmos, assume cada vez mais relevância. O objectivo desta investigação consiste em analisar em que medida o recurso ao crédito de fornecedores permite às empresas minimizar os efeitos do hold-up
problem. Utilizando uma amostra de 468 pequenas e médias empresas industriais portuguesas
(PME) para o período de 1998 a 2006, os resultados obtidos confirmam que um aumento da taxa de juro do crédito bancário está associado a um incremento do crédito de fornecedores. Este incremento é particularmente expressivo nas PME que mantêm uma relação de monopólio (negoceiam com apenas um banco – Hausbank), comparativamente às PME que optam por estabelecer relações multilaterais e, em períodos em que as PME enfrentam problemas de liquidez. Estes resultados estão em sintonia com as teorias que enfatizam a função financeira associada ao crédito de fornecedores, constituindo deste modo, uma fonte de financiamento alternativa ao crédito bancário.
Abstract:
According previous studies, a bank can set up a higher interest rate for small company by establishing a lending relationship since information asymmetry limits competition between banks. Therefore, the bank can acquire monopoly rents from small company. However, not only banks, but also suppliers of trade credit acquire information of buyers´ creditworthiness. This paper investigates how serious is monopoly information for Portuguese SMEs. We investigate if the informed non-financial companies can extend trade credit in order to decrease the monopolistic power of lenders that might lead to hold-up problems, by analyzing companies that obtain funds from just one bank and those who obtain funds from several banks. By using a panel data of 468 Portuguese SMEs for the period of 1998-2006, our results strongly suggest that high interest rates are associated to an increase in the use of trade credit. Furthermore, the findings support the existence of a link between suppliers and customers that take time to build and leads to suppliers help their customers who experience temporary liquidity shocks. Thus, the provision of trade credit alleviates the problem of monopolies information
Key words: Trade Credit, Bank Information Monopoly, Hold-up Problem, Asymmetric Information.
1. Introduction
The existence of asymmetric information in capital markets means financial institutions cannot adequately assess the investment projects of their borrowers. As pointed out by Berger and Udell (1998), this effect becomes marked in the case of small business, due to the huge difficulties they encounter in transmitting reliable information about their real status and performance. As a consequence, smaller companies have higher problems obtaining both their required levels of bank financing and sufficiently favourable conditions of borrowing.
Previous studies argue that the establishing a long-term relationship between the bank and the borrower mitigates the problem of asymmetric information (e.g. Leland and Pyle, 1977; Campbell 1979; Ramakrishnan and Thakor, 1984; Diamond, 1984; Fama, 1985; Boyd and Prescott, 1986; Rajan, 1992; Boot et al. 1993; Bhattacharaya and Thakor, 1993; Boot and Takor, 1994; Yosha, 1995; Bhattacharaya and Chisea, 1995). The establishment of a strong relationship with a financial institution increases the credit availability (Petersen and Rajan 1994), borrowers with longer banking relationships are less likely to pledge collateral (Berger and Udell, 1995). However, recent studies also point out a dark side of the lending relationship (e.g. Kane and Malkiel, 1965; Blackwell and Santomero, 1982; Greenbaum et al. 1989; Sharpe, 1990; Rajan, 1992; Dewatripont and Maskin, 1995; Bolton and Scharfstein, 1996). Sharp (1990) and Rajan (1992) show that companies borrowing from just one financial intermediary are “informationally captured”, as no one else knows the real risk of the company. In these circumstances the monopolistic relationship may be exploited in order to charge higher interest rate on new loans or even to rational additional borrowing. Borrowers cannot borrow from uninformed banks due to the problem of information asymmetry; consequently they come across a hold-up problem. Since the informed bank can extract rent, the borrower (particularly, for good quality companies) is discouraged to invest. To avoid the hold-up-problem, the borrower establishes relationships with multiple banks (Farinha and Santos, 2002; Von Thaden, 1994). When many informed banks accomplish loans to the borrower, they are unable to achieve monopoly rent (Detragiache et al. 2000).
Nevertheless, not only banks, but also suppliers of trade credit acquire information of buyers´ creditworthiness. Some authors argue that trade creditors acquire private information that is similar – in some cases, superior – to the information acquired by banks (e.g. Mian and Smith, 1992; Biais and Gollier, 1997; Cook, 1997; Jain, 2001; Burkart and Ellingsen, 2004; Cunat, 2007; Miwa and Ramseyer, 2005; Fabri and Menichini, 2006). Since trade creditors acquire soft information as well as hard information over time in order to monitor their customers and use this information to make credit decisions, they act like banks as a relationship lenders.
In this paper we investigated how serious is monopoly information for Portuguese small medium size companies (SMEs). We reflected on the point of view of a loan customer who faces severe financing restrictions and finances predominantly through a relationship lender. We investigated if the informed non-financial companies can extend trade credit in order to decrease the monopolistic power of lenders that might lead to hold-up problems, by analyzing companies that obtain funds from just one bank and those who obtain funds from several banks. The main contribution of this paper to the existing literature lies in presenting this rather uncommon approach, and analyzing ways to reduce the hold-up problem as well as ways to gain access to new, more desirable sources of financing.
Using a panel data of 468 Portuguese small companies, our analysis shows that companies that have less collateral assets cannot easily borrow from banks (i.e. bank credit is backward looking and depends on the collateral accumulated in previous periods), so they faced the problem of credit rationing. Since suppliers can easily liquidate the borrower’s current assets, high interest rates are associated to an increase in the use of trade credit, which confirm the finance motive of trade credit. Furthermore, the findings support the existence of a link between suppliers and customers that take time to build and leads to suppliers help their customers when experience temporary liquidity shocks. Hence trade creditors act as relationship lenders. Thus, the provision of trade credit alleviates the problem of information monopolies.
This paper is organized as follows. In section II we review the literature on long-term relationship with banks and trade creditors. We also discuss how serious the monopoly information can be. We describe the dataset, variables and the methodology in section
III. In section IV we discuss empirical results. Section V concludes with a summary of the main findings.
2. Lending Relationship
2.1. Bank Lending Relationship: Cost or Benefit?
The modern literature on financial intermediation has long emphasized the value creation function of lending relationships. In a context of asymmetric information in the credit markets, lending relationships facilitates the information exchange between borrower and the lender through the provision of multiple financial services. Lenders invest in generating information from their client firms and borrowers are more inclined to disclose information (Boot, 2000). In consequence, the information asymmetries between the bank and the company are lessened as time goes by through many channels. Having a long-term scope permits the design of implicit credit contracts over the duration of relationships that increase value, for instance, through reduction in welfare dissipating collateral requirements (Berger and Udell, 1995), through the development of welfare-enhancing intertemporal tax-subsidy schemes in loan pricing (Petersen and Rajan, 1995), as well as through more flexible contracting terms (Boot et al. 1993). The information generated by lender over repeated transactions and over time is also beneficial in terms of savings on the fixed cost of screening and monitoring (Boot and Thakor, 2000). It also avoids the free-rider problem of monitoring since the bank internalizes the benefits of such investments. Higher monitoring levels increase value since for instance; they help solve principal-agent problems of managerial behaviour. Additionally, relationship banks develop sector-specific expertise that enhances the value of financed projects (Boot and Thakor, 2000). Supported on these arguments, lending relationships with banks are valuable for the borrowers to mitigate the problems of adverse selection and moral hazard [e.g. firms whose loans are renewed will be seen as of good reputation (Diamond, 1991)].
However, previous works also point out a dark side of the lending relationship. An exclusive bank relationship originates an asymmetric evolution of the information between that bank and the others lenders (Kane and Malkiel, 1965). Having a single relationship gives a data monopoly to the informed bank that might exploit its
bargaining power over the company and extract rents (Greenbaum et al. 1989; Sharpe, 1990; Rajan, 1992). As pointed out by Sharpe (1990), the possibility of extracting these rents encourages banks to compete with one another and lend funds with little information about the quality of borrowers. If an inefficient allocation of resources the benefits that bank losses will be paid for by the clients who have maintained their relationships with a bank (D’Auria et al. 1999; Lehmann and Newberger, 2001). These studies conclude that the problems of information monopolies are serious for borrowers, especially for the smallest, youngest companies due to the lack of credit history, the impossibility to credibly disclose their quality and the lack of separation between ownership and management. Recent studies emphasize that the establishment of multiple lending relationships is a strategy to avoid extraction of rents from the banks (Bolton and Scharfstein, 1996; Boot and Thakor, 2000; Detragiache et al. 2000; Carletti et al. 2007).1 For example, Detragiache et al. (2000) and Farinha and Santos (2002) show that the borrower establishes multiple relationships with banks to reduce the likelihood of early liquidation.
2.2. Are Trade Creditors Relationship Lenders?
Commercial banks and suppliers are the largest providers of debt financing for U.S. firms (Berger and Udell, 1998). Similar evidence is found for European countries (Reid, 2003; Franks and Sussman, 2005). Many previous studies analyse theoretically the function of trade credit (e.g. Schwartz, 1974; Schwartz and Whitcomb, 1978, 1979; Ferris, 1981; Emery, 1987). Despite the abundance of studies of trade credit in the literature, there is very little agreement on the nature and motivation for use of trade credit. According to Frank and Maksimovic (2005) the theories of trade credit fit into two broad categories: real operations based theories and financial theories. Real operations based theories sustain a variety of motivations including transaction cost minimization, price details and quality guaranties (e.g. Ferris, 1981; Emery, 1987; Brennan et al. 1988; Long et al. 1993; Emery and Nayar 1998). Financial theories sustain that suppliers have informational and monitoring advantages over traditional lenders. Advantages related to product collateral value and superior liquidation ability
1
See Boot (2000) and Gorton and Winton (2003) for useful surveys of relationship lending and Ongena and Smith (2000) for empirical studies about multiple banking relationships.
are pointed out by Mian and Smith (1992), Frank and Maksimovic (2005), Santos and Longhoper (2003). Cunat (2007), emphasizes the repayment enforcement mechanism compared to banks because suppliers can strategically withhold suppliers; the creditor vulnerability to product diversification is sustained by Burkart and Ellingsen (2004), and Burkart et al. (2004).
Others, such Mian and Smith (1992), Biais and Gollier (1997), Cook (1997), Jain (2001), Cunat (2007), Miwa and Ramseyer (2005), and Fabri and Menichini (2006) argue that trade creditors acquire private information about their customers. Indeed, financial theories either explicitly or implicitly emphasize that trade creditors (i.e. product sellers) may have abilities to circumcise the traditional problems of informational asymmetry and moral hazard at least as well, if not better than banks. The main arguments that explain this advantage of suppliers vis-à-vis of banks are: i) the supplier is supposed to possess a better knowledge of the technology and of the markets of its customers and hence can appraise their quality with a greater percussion than banks do; ii) a supplier may also threaten to stop future supplies and may be in a better position to reload and resell goods in case of default than banks and iii) finally, in lending goods, not cash as the banks do, suppliers are less concerned with cash diversification by their customers. Biais and Gollier (1997) go one step further and suggest that trade credit may also act as a signal of a company’s quality. They show that trade credit reveals the private information of the suppliers to the bank which, in turn, can update its beliefs about customer default risk. Burkart and Ellingsen (2004) agency model’s reaches a similar result. More specifically, they show that additional trade credit increases the investment size and thereby the entrepreneur’s residual return and hence decreases the entrepreneur’s incentive to divert cash. As a consequence suppliers have a monitoring advantage over banks. Based on previous arguments, suppliers may possess some advantages over traditional financial intermediaries in collecting information on other non-financial companies, in assessing their creditworthiness and finally in controlling their actions2.
2
Despite the lack of an explicit model, the hypotheses of trade creditors are relationship lenders (in the pure sense of linking the accumulation of private information with the strength of the relationship) is well established in the literature (e.g. Mian and Smith, 1992; Cunat, 2007; Miwa and Ramseyer, 2005).
2.3. Monopoly Information – How Serious It Can Be?
In previous sections we argued that because SMEs usually do not have access to capital markets the two major sources of debt financing are bank loans and trade credit. In capital market-based financial systems (e.g. U.S. or U.K.) bank lending takes place at arm’s length. In contrast, in a bank-based financial system [the case of Portugal, according the taxonomy of LaPorta et al. (1998)], is generally exercised through close long-term relationships between banks and their customers. This way of providing companies with bank loans is widely known as the Hausbank principle (e.g. Elsas and Krahnen, 1998; Behr and Güttler, 2007).
A Hausbank may be defined as the premier lender to a company. By virtue of this special relationship, it has more detailed and timelier information about its customer than a comparable arm’s – length bank would. Nevertheless what kind of information the bank acquires over time as the strength of the relationship grows? Berger et al. (2005) argue that the informed bank acquires soft information of borrowers. Soft information is defined as information that is difficult to quantify and verify (for example, the information of character and reliability of the company’s owner). Hausbank can acquire soft information of borrowers over time, which cannot be transferred from or to other lenders. This places Hausbanks in a position to exert market power that can lead to hold-up problems for borrowers (Boot, 2000; Degryse and Van Cayseele, 2000). Changing a bank relationship is costly for the borrower because the new bank does not have the same amount and quality of information, and therefore will charge the debtor a risk premium to make up for this lack of information (switching costs)3.
Consequently, in accessing a new source of bank financing, the companies face an adverse selection problem, arising because new lenders have less information than relationship lenders (Detragiache et al. 2000). To reduce the hold-up effect companies can opt for multiple bank relationships (Howorth et al. 2003; Houston and James, 1996; Farinha and Santos, 2002; Rajan, 1992; Behr and Güttler, 2007). These results suggest
3
Switching costs incorporate not only the risk margin but also search costs for a new bank and other internal costs associated with a new bank relationship.
that the number of companies that have relationships with one or few banks is higher if the company’s size is small.
Sharpe (1990) and Rajan (1992) assume implicitly that only banks offer credit for borrowers. However, implicit borrowing in the form of trade credit constitutes also an important source of funding for companies with difficult access to financial markets (Fishman and Love, 2003)4. Indeed suppliers have incentives in offering credit to their customers. As pointed out by Petersen and Rajan (1997:689): “the supplier has an implicit equity stake in the company equivalent to the present value of the margins he makes on current and future sales of the product to the company. This may far exceed the implicit equity stake a financial institution may have because of the potential for future business…”. As sustained by financial theories, suppliers may be better able to evaluate and control the credit risk of their customers than specialized financial institutions, such as banks. For instance, suppliers may have an advantage in information acquisition: they can observe the size and timing of orders, the ability of companies to take advantage of early payment discounts (e.g. Smith, 1987; Biais and Gollier, 1997). Even though banks can collect similar information via transactions accounts, suppliers are likely to obtain the information in a faster and cheaper way (Petersen and Rajan, 1997; Cunat, 2007). In addition, because of the very short-term nature of trade credit, suppliers have the ability to react faster when adverse information emerges whereas banks may have to wait actual default. Suppliers also may be able to seize delivered goods from customers that not pay. When these goods subsequently can be resold to other customers, suppliers may have an advantage in extending credit to high-risk firms (Mian and Smith, 1992; Huyghebaert, 2006; Huyghebaert et al. 2007). For instance, Wilner (2000) documents that suppliers grant more concessions to distressed customers when they wish to maintain an enduring product market relationship, consequently, tend to be more lenient towards financially distressed companies than credit market lenders, such as banks.
4
Recent papers argue that borrowers use more trade credit when trade credit from banks is unavailable due the information asymmetry problem (Petersen and Rajan, 1997; McMillan and Woodruff, 1999; Ng et al. 1999; Fishman and Love, 2003; Wilner, 2000; Gama et al. 2008). However, as point out by Demirgüc-Kunt and Maksimovic (2001) trade credit use as a substitute to bank lending can depend on a country’s legal system. For instance, the negative relation between the size of trade credit and the efficiency of a country’s legal system is enforcing contracts, to the extent that this benefits financial intermediaries, i.e. natural suppliers of credit.
It is common that suppliers offer trade credit for buyers in Portugal (Demirgüc-Kunt and Maksimovic, 2001; Bardes, 2002; Marotta, 2005; Banco de Portugal, 2009). However, trade credit is considered to be an expensive source of financing (e.g. Smith, 1987; Petersen and Rajan, 1994, 1997; Cunat, 2007). The credit term most frequently adopted by suppliers is “2/10 net 30” (Ng et al. 1999). This term represents a 2% discount for payment within the 10-day discount period; the net periods ends on day 30. The implicit interest rate on the trade credit under this terms amounts to 40% (Wilner, 2000).
Although, recent criticism in the literature has emphasized that this approach may be too simplistic (Marotta, 2005; Miwa and Ramseyer, 2005). The trade credit own cost depends on the contractual clauses – implied interest rates in two part contracts allowing for discounts for faster payments and penalties for ex-post delays and on the extend they are enforced. Nevertheless the spread cannot be easily computed because it depends on how common is the two-part contract (Ng et al. 1999).
Additionally, and related how widespread are penalties for late payments, Wilner (2000) shows that a majority of U.S. companies did not implement rate payment penalty. Similar evidence is provided by Pike and Cheng (2001) for U.K.. But most problematic, however, is the fact that the price of underlying product is not observable to the empiricist (Miwa and Ramseyer, 2005). As a consequence, it is distinctly possible that trade credit is no more expensive than bank credit (Marotta, 2005; Miwa and Ramseyer, 2005).
3. Data and Methodology
3.1. Dataset
In order to test whether the informed non-financial firms can alleviate the problems of bank information monopolies by extend trade credit, we collect the data from the database AMADEUS, a dataset collected by Bureaus Van Djik (BVJ). This database includes standardised annual accounts (consolidated and unconsolidated) for approximately 9 millions of companies through Europe, including Eastern Europe. Due to the fact, that we have only had access to the Amadeus dataset since 1998, this
establishes 1998 the year as a starting point for our analysis. To be included in the dataset, the companies must have at least one employee and had fulfilled the requirements established in the European Commission Recommendation of 6 May 2003 (2003/361/EC)5. In order to control the survivor bias effect, we selected active and inactive companies. We restricted our sample to manufacturing companies because in this sector buying intermediate goods from a supplier represents an expressive part of the company’s inputs (Demirgüc-Kunt and Maksimovic, 2001; Marotta, 2005; Cunat, 2007). Because our main focus of analysis is small young companies, companies with more than 25 years were dropped. After eliminating companies with high levels of missing and inconsistent data (e.g. total assets are different from total shareholders funds plus liabilities), our final sample consists of an unbalanced panel data of 468 SMEs for the period of 1998-2006.
3.2. Variables and Methodology
To analyse the relation between bank information monopolies and trade credit we estimate the following regression:
Trade Creditit = X’itβ + ηi + λt + εit (1)
where Xit is the vector of independent variables for the company i in the year t, ηi are the companies’ non-observable individual effect, λt are temporary dummy variables and εit is the random error.
To obtain a measure of trade credit usage, we use the ratio of trade credit to total assets (TC1). This ratio gives the percentage of total assets that is financed by trade credit and therefore represents a company’s reliance on intercompany credit. We also use the ratio trade credit to total debt (TC2) to measure whether the company is bank or trade credit dependent (Cunat, 2007). Related to the independent variables, we focus on variables of credit terms with banks that include the variables collateral and interest rate, company’s characteristics and control variables.
5
According to the European Commission Recommendation (2003/61/CE) to be considered a small company, for at least two criteria need to be respected: i) having less than 250 employees and ii) having an annual business volume not exceeding € 50 million or assets not exceeding € 43 million.
The proportion of trade credit with respect to other forms of finance depends on the level of collateral that companies have. As pointed out by Petersen and Rajan (1997) and Cunat (2007) trade credit levels are forward looking because they depend on the future value of the relationship between supplier and customer (suppliers hold a large implicit equity stake in companies especially with favourable growth prospects), whereas bank credit is backward looking and depends on the collateral accumulated in previous periods. We expect that the higher the level of collateralized assets, the lower the expected proportion of trade credit. The ratio of company’s tangible assets to total debt is the proxy for collateral assets.
If the only bank as information of the borrower’s creditworthiness, it can set a higher interest rate and uses the threat of not refinancing its borrowers as a way to enforce debt repayment (Bolton and Scharfstein, 1990; Sharpe, 1990; Rajan, 1992). Thus the problem of an information monopoly is serious when a borrower has a long-term relationship with one or few banks (Detragiache et al. 2000). To investigate whether the problems of monopolies are serious to Portuguese SMEs we also introduce the variable DInteraction (DBank1xInterest) created by the interaction of the variables interest (the ratio of company´s interest expenses to the sum of its short-term debt and long-term debt) and the variable DBank1. DBank1 is a dummy that takes the value one if the company obtains funds from just one financial institution and zero otherwise. If suppliers have also information of the borrower’s creditworthiness, the borrower can be financed from non financial companies when the bank sets up the interest rate too high. Therefore, the coefficients of the interest rate must be statically and economically positive if the problems of information monopolies are alleviated by trade creditors.
We include three proxies of the company’s characteristics: demand for short term credit, sales growth and profitability. According the transaction theory, the primary benefit of trade credit is a cash management tool (Schwartz, 1974). By delaying the payment for purchases, a company may be able to match the timing of cash receipts from sales with the cash outlays for the cost of goods sold. However, as Ferris (1981) argues trade credit becomes less an instrument of trade credit and more an instrument of finance as the length of credit period increases, with the seller acting as a financial intermediary. Trade credit extension then becomes a type of short-term loan between seller and buyer that is tied to the exchange goods in terms of value and timing (Franks et al. 1985).
Consequently, companies that demand short-term credit use more trade credit. We use the ratio of current assets excluding cast to total assets as a proxy for the demand for short term credit. The general demand for funds depends on the expected future growth. We expect that companies are growing more quickly to have a higher proportion of their assets financed with short-term credit in general and trade credit in particular. To capture this effect we use the variable sales growth. In the presence of asymmetric information, Myers and Majluf (1984) claim that companies establish a hierarchy of sources to be used for financing, preferring those carrying a lower cost (and also a lower risk). Therefore, the company’s ability to generate cash internally will decrease its demand for trade credit. We use the ratio of earnings before interest and taxes to total assets as a proxy for the company’s reliance on internally generated funds. Two control variables are included: age and size6.
The variable age has been used in the literature to identify new financing constrains and negative shocks to firm prospects (e.g. Fazzari et al. 1998; Cleary, 1999; Cunat, 2007). The size of the borrower is an inverse measure of its information opaqueness, as smaller companies use to be in poorer financial conditions and have less experience and public information7. It is important to reinforce that many factors affect the amount of trade credit, but we cannot obtain all variables that affect the determinants of trade credit (e.g. the characteristics of the company’s owner, the company’s management policy and the characteristics of supplier’s owner). By using panel data, the problems of omitted variables and endogenous are mitigated.
When using panel data, one of the elements that involve the higher problem is the non-observable heterogeneity (ηi) which occurs because of the existence of a series of non-observable individual effects. As the name indicates, such effects are associated with the individual companies making up the panel, but in addition have the peculiarity of being constant in time. The main drawback arises due the impossibility of measuring these effects in any way, as they are non observable.
6
See appendix I for a detailed definition of variables. 7
See Beck et al. (2003) for an interpretation of the determinants of the company size and Berger and Udell (1998) for a discussion about sources of financing firms can access according to their age.
Nevertheless, the method of estimation to be used will depend on whether this non-observable is considered as fixed or random. They are fixed when they are correlated with the independent variables of the model. If, on the contrary, it is accepted that the non-observable effects are not correlated with the variables, they will be considered as random.
To contrast the correlation between the individual effects and the independent variables, we use the Hausman test (Hausman, 1978). According the Hausman test, if the effects are uncorrelated with the variables, the fixed-effects and random-effects estimators should not be significantly different. Following this procedure the Hausman test shows that the independent variables are not correlated with non-observable heterogeneity. We estimate a random-effect unbalanced panel data, using the Generalized Method of Moments (GMM) (Arellano, 2003), which allows us to control for endogenous by using instruments. Specifically, we follow the strategy proposed by Arellano and Bond (1991), which consists of using all the right-hand side variables lagged twice or more as instruments. This methodology assumes that that there is no second-serial correlation in the errors in first differences. For this reason, in order to test the consistency of the estimations, we use the test for the absence of second-serial correlation proposed by Arellano and Bond (1991). To test for the over-identifying restrictions, we employ the Sargan test, which tests for the absence of correlation between instruments and error term.
4. Empirical Results
In this section, we analyze the relationship between bank information monopoly and trade credit. First, we compare the average ratio of trade credit, bank credit, interest and the number of banking relationships by age and by size. Afterward, we test whether the informed non-financial companies can alleviate the problems of bank information monopolies by extend trade credit if the interest rate the bank sets is too severe or worsened, by analyzing companies that obtain funds from just one bank and those who obtain funds from several banks. Finally, we restrict our analysis to profitable companies, to investigate if the interest rate set by the banks is not only a consequence of information monopoly but due to a higher default risk.
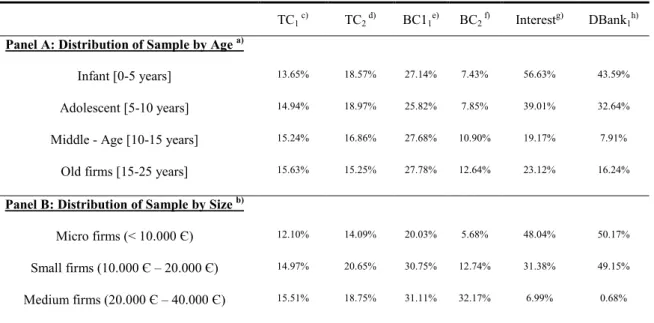
Table I shows the average ratio of trade credit, bank credit, interest and the number of banking relationships, compared by age (panel A) and by size (panel B).
TABLE I: Average ratio of trade credit, bank credit, interest and the number of banking relationships by age and size
TC1 c) TC2 d) BC11e) BC2 f) Interestg) DBank1h)
Panel A: Distribution of Sample by Age a)
Infant [0-5 years] 13.65% 18.57% 27.14% 7.43% 56.63% 43.59% Adolescent [5-10 years] 14.94% 18.97% 25.82% 7.85% 39.01% 32.64% Middle - Age [10-15 years] 15.24% 16.86% 27.68% 10.90% 19.17% 7.91%
Old firms [15-25 years] 15.63% 15.25% 27.78% 12.64% 23.12% 16.24%
Panel B: Distribution of Sample by Size b)
Micro firms (< 10.000 Є) 12.10% 14.09% 20.03% 5.68% 48.04% 50.17% Small firms (10.000 Є – 20.000 Є) 14.97% 20.65% 30.75% 12.74% 31.38% 49.15% Medium firms (20.000 Є – 40.000 Є) 15.51% 18.75% 31.11% 32.17% 6.99% 0.68%
a)
We classify firms according to the age in line with Berger and Udell (2002); b)
Size is measured by total assets (thousands of Euros); c)
TC1 is the ratio of trade credit to total assets;
d)
TC2 is the ratio of trade credit to total debt;
e)
BC1 is the ratio of total debt to total assets;
f)
BC2 is the ratio of long – term debt to total liabilities;
g)
Interest is the ratio of interest expenses to the sum of short and large–term debt; h)
DBank1 is a dummy variable that takes the value one if the company obtains funds from just one
financial substitution, zero otherwise.
Both ratio of trade credit (TC1 and TC2) report a similar value for Portuguese SME when analysed by age and size. When compared with bank credit (BC1), we could conclude trade credit represents a substantial component of both assets and liabilities. It accounts for roughly fifteen percent of total assets and twenty percent of total debt. Related to the ratio of bank credit, the medium and older companies show a higher financial leverage, particularly long-term debt (BC2). This result could be due to the result of the consolidation of the company’s reputation. Older and larger companies tend to be more diversified, less prone to bankruptcy, have better track record, and therefore should suffer less severe agency costs (Petersen and Rajan, 1997). Indeed, the variable DBank1 shows that the older and larger companies work with more lenders. It would seem logical that the complexities deriving from size may encourage large
companies to divide their business across several banks. In addition, lenders likely want to maintain their connections with large companies because they can be overseen more easily. In fact, the youngest and smaller companies report higher interest rate. These preliminary results provide empirical evidence to the financing motive of trade credit, i.e., trade credit becomes less an instrument of trade and more an instrument of finance, despite the existence of a competitive banking sector (Nilsen, 2002; Berger and Udell, 1998; Cunat, 2007)8. The descriptive statistics and correlations are presented in appendix II and III.
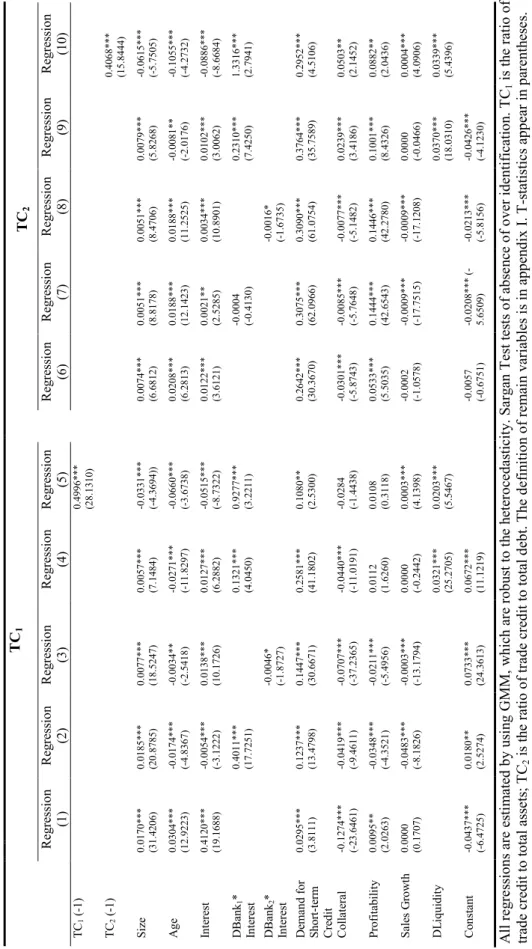
Next, we focus on trade credit and we test whether the informed non-financial companies can alleviate the problems of bank information monopolies by analysing if borrowers extend trade credit when the bank sets higher interest rate. The results are reported in Table II.
In table II we use the ratio of a company’s trade credit to its total assets (regressions 1 – 5) and trade credit to total debt (regressions 6 – 10) as dependent variables. We first analyse the determinants of trade credit (regression 1 and 6). The coefficients of the variable demand for short-term credit are positive and statistically significant at 1% level. Thus, companies that demand short-term credit use more trade credit. This result is reinforced when analysing the variable interest. The coefficient of this variable in both regressions (1 and 6) is positive and statistically significant at 1% level, which indicates that when banks set a higher interest rate, the borrower extend trade credit from other non-financial companies. The coefficient of the tangible asset ratio is negative and statistically significant at 1% level (regression 1). The result remains unchanged if the dependent variable is the ratio trade credit to total debt (regression 6). Consistent with previous studies (e.g. Cunat, 2007; Atanasova, 2007), these results show that firms that hold less collateral assets use more trade credit than those with more collateral assets9.
8
Jaffee and Russel (1976) claim that banks have incentives to elevate the interest rate as the borrower increases the demand for funds, in order to put the market in a rationing situation.
9
Many small companies also pledge their owner’s real estates as collateral. Because of lack of data, we cannot investigate the effect owner’s assets.
1 6 T A B L E I I: T h e R el a ti o n sh ip b et w ee n B a n k I n fo r m a ti o n M o n o p o ly a n d T ra d e C re d it T C1 T C2 R eg re ss io n (1 ) R eg re ss io n (2 ) R eg re ss io n (3 ) R eg re ss io n (4 ) R eg re ss io n (5 ) R eg re ss io n (6 ) R eg re ss io n (7 ) R eg re ss io n (8 ) R eg re ss io n (9 ) R eg re ss io n (1 0 ) T C1 ( -1 ) 0 .4 9 9 6 * * * (2 8 .1 3 1 0 ) T C2 ( -1 ) 0 .4 0 6 8 * * * (1 5 .8 4 4 4 ) S iz e 0 .0 1 7 0 * * * (3 1 .4 2 0 6 ) 0 .0 1 8 5 * * * (2 0 .8 7 8 5 ) 0 .0 0 7 7 * * * (1 8 .5 2 4 7 ) 0 .0 0 5 7 * * * (7 .1 4 8 4 ) -0 .0 3 3 1 * * * (-4 .3 6 9 4 )) 0 .0 0 7 4 * * * (6 .6 8 1 2 ) 0 .0 0 5 1 * * * (8 .8 1 7 8 ) 0 .0 0 5 1 * * * (8 .4 7 0 6 ) 0 .0 0 7 9 * * * (5 .8 2 6 8 ) -0 .0 6 1 5 * * * (-5 .7 5 0 5 ) A g e 0 .0 3 0 4 * * * (1 2 .9 2 2 3 ) -0 .0 1 7 4 * * * (-4 .8 3 6 7 ) -0 .0 0 3 4 * * (-2 .5 4 1 8 ) -0 .0 2 7 1 * * * (-1 1 .8 2 9 7 ) -0 .0 6 6 0 * * * (-3 .6 7 3 8 ) 0 .0 2 0 8 * * * (6 .2 8 1 3 ) 0 .0 1 8 8 * * * (1 2 .1 4 2 3 ) 0 .0 1 8 8 * * * (1 1 .2 5 2 5 ) -0 .0 0 8 1 * * (-2 .0 1 7 6 ) -0 .1 0 5 5 * * * (-4 .2 7 3 2 ) In te re st 0 .4 1 2 0 * * * (1 9 .1 6 8 8 ) -0 .0 0 5 4 * * * (-3 .1 2 2 2 ) 0 .0 1 3 8 * * * (1 0 .1 7 2 6 ) 0 .0 1 2 7 * * * (6 .2 8 8 2 ) -0 .0 5 1 5 * * * (-8 .7 3 2 2 ) 0 .0 1 2 2 * * * (3 .6 1 2 1 ) 0 .0 0 2 1 * * (2 .5 2 8 5 ) 0 .0 0 3 4 * * * (1 0 .8 9 0 1 ) 0 .0 1 0 2 * * * (3 .0 0 6 2 ) -0 .0 8 8 6 * * * (-8 .6 6 8 4 ) D B an k1 * In te re st 0 .4 0 1 1 * * * (1 7 .7 2 5 1 ) 0 .1 3 2 1 * * * (4 .0 4 5 0 ) 0 .9 2 7 7 * * * (3 .2 2 1 1 ) -0 .0 0 0 4 (-0 .4 1 3 0 ) 0 .2 3 1 0 * * * (7 .4 2 5 0 ) 1 .3 3 1 6 * * * (2 .7 9 4 1 ) D B an k2 * In te re st -0 .0 0 4 6 * (-1 .8 7 2 7 ) -0 .0 0 1 6 * (-1 .6 7 3 5 ) D em an d f o r S h o rt -t er m C re d it 0 .0 2 9 5 * * * (3 .8 1 1 1 ) 0 .1 2 3 7 * * * (1 3 .4 7 9 8 ) 0 .1 4 4 7 * * * (3 0 .6 6 7 1 ) 0 .2 5 8 1 * * * (4 1 .1 8 0 2 ) 0 .1 0 8 0 * * (2 .5 3 0 0 ) 0 .2 6 4 2 * * * (3 0 .3 6 7 0 ) 0 .3 0 7 5 * * * (6 2 .0 9 6 6 ) 0 .3 0 9 0 * * * (6 1 .0 7 5 4 ) 0 .3 7 6 4 * * * (3 5 .7 5 8 9 ) 0 .2 9 5 2 * * * (4 .5 1 0 6 ) C o ll at er al -0 .1 2 7 4 * * * (-2 3 .6 4 6 1 ) -0 .0 4 1 9 * * * (-9 .4 6 1 1 ) -0 .0 7 0 7 * * * (-3 7 .2 3 6 5 ) -0 .0 4 4 0 * * * (-1 1 .0 1 9 1 ) -0 .0 2 8 4 (-1 .4 4 3 8 ) -0 .0 3 0 1 * * * (-5 .8 7 4 3 ) -0 .0 0 8 5 * * * (-5 .7 6 4 8 ) -0 .0 0 7 7 * * * (-5 .1 4 8 2 ) 0 .0 2 3 9 * * * (3 .4 1 8 6 ) 0 .0 5 0 3 * * (2 .1 4 5 2 ) P ro fi ta b il it y 0 .0 0 9 5 * * (2 .0 2 6 3 ) -0 .0 3 4 8 * * * (-4 .3 5 2 1 ) -0 .0 2 1 1 * * * (-5 .4 9 5 6 ) 0 .0 1 1 2 (1 .6 2 6 0 ) 0 .0 1 0 8 (0 .3 1 1 8 ) 0 .0 5 3 3 * * * (5 .5 0 3 5 ) 0 .1 4 4 4 * * * (4 2 .6 5 4 3 ) 0 .1 4 4 6 * * * (4 2 .2 7 8 0 ) 0 .1 0 0 1 * * * (8 .4 3 2 6 ) 0 .0 8 8 2 * * (2 .0 4 3 6 ) S al es G ro w th 0 .0 0 0 0 (0 .1 7 0 7 ) -0 .0 4 8 3 * * * (-8 .1 8 2 6 ) -0 .0 0 0 3 * * * (-1 3 .1 7 9 4 ) 0 .0 0 0 0 (-0 .2 4 4 2 ) 0 .0 0 0 3 * * * (4 .1 3 9 8 ) -0 .0 0 0 2 (-1 .0 5 7 8 ) -0 .0 0 0 9 * * * (-1 7 .7 5 1 5 ) -0 .0 0 0 9 * * * (-1 7 .1 2 0 8 ) 0 .0 0 0 0 (-0 .0 4 6 6 ) 0 .0 0 0 4 * * * (4 .0 9 0 6 ) D L iq u id it y 0 .0 3 2 1 * * * (2 5 .2 7 0 5 ) 0 .0 2 0 3 * * * (5 .5 4 6 7 ) 0 .0 3 7 0 * * * (1 8 .0 3 1 0 ) 0 .0 3 3 9 * * * (5 .4 3 9 6 ) C o n st an t -0 .0 4 3 7 * * * (-6 .4 7 2 5 ) 0 .0 1 8 0 * * (2 .5 2 7 4 ) 0 .0 7 3 3 * * * (2 4 .3 6 1 3 ) 0 .0 6 7 2 * * * (1 1 .1 2 1 9 ) -0 .0 0 5 7 (-0 .6 7 5 1 ) -0 .0 2 0 8 * * * ( -5 .6 5 0 9 ) -0 .0 2 1 3 * * * (-5 .8 1 5 6 ) -0 .0 4 2 6 * * * (-4 .1 2 3 0 ) A ll r eg re ss io n s ar e e st im at ed b y u si n g G M M , w h ic h a re r o b u st t o t h e h et er o ce d as ti ci ty . S a rg an T es t te st s o f ab se n ce o f o v er i d en ti fi ca ti o n . T C1 i s th e r at io o f tr ad e cr ed it t o t o ta l as se ts ; T C2 i s th e ra ti o o f tr ad e cr ed it t o t o ta l d eb t. T h e d ef in it io n o f re m ai n v ar ia b le s is i n ap p en d ix I . T -s ta ti st ic s ap p ea r in p ar en th es e s. (* * * ) S ig n if ic a n t at 1 % ; (* * ) S ig n if ic a n t at 5 % ; (* ) S ig n if ic an t 1 0 % .
Opposed to our expectation, the coefficient of the variable profitability is positive and statistically significant at 1% level, especially in regressions 6 to 10. This result is in line with empirical evidence providing by Marotta (2005). By using a sample of Italian companies, which are the top user of trade credit, Marotta (2005) shows that trade credit is not always more expensive than bank loans. Recall, that the evolution of the variable trade credit to total debt shows the relative changes in trade credit regarding to other debt sources of financing. The coefficient of the variables size and age are positive and statistically significant at 1% level (regressions 1 and 6) which are consistent with transaction costs theories (e.g. Schwartz, 1974; Ferris, 1981; Smith, 1987). Since large companies purchase more goods than smaller companies do, instead of paying bills every time goods are delivered, companies may centralize payments at the end of each month or quarter and use trade credit to bridge the period between purchase and payment. However, as pointed out by (Cunat, 2007:494) the relationship between age of the company and the levels of trade credit used is nonlinear. In fact, in regressions 2 to 5 and 9 and 10, the coefficient of the variable age is negative and statistically significant at 1% level. This result can be explained due to the fact that new born companies start with low levels of trade credit that built very quickly in the early years of the company’s life. This reinforces the hypothesis that trade credit is related to the existence of a link between suppliers and customers. If this link takes time to build, then trade credit should grow as the relationship evolves (e.g. Mian and Smith, 1992; Miwa and Ramseyer, 2005; Cunat, 2007). Indeed, when we introduce in the regression (1) and (6) the variables DAge1 (infant firms), DAge2 (adolescent firms) and Dage3 (middle-age firms), dummy variables that take values one if the age of the company is between 0 and 5 years, 5 to 10 years and 10 to 15 years, respectively and 0 otherwise, the coefficients of the variables Dage1 and Dage2 are negative and statistically significant while the coefficient of the variable Dage3 is positive (the results are available upon request from authors)10.
As we discuss in an earlier section, Sharpe (1990), Rajan (1992) and Detragiache et al. (2000) among others, claim that the problem of an information monopoly is serious when a borrower has a long-term relationship with one or few banks. Data from table I
10
Following Stiglitz and Weiss (1981) we have also included the variable age in quadric form. The variable appears non significant and was eliminated from the models.
shows that smaller and younger companies establish relationships with one bank. To investigate whether the problems of information monopolies are serious, we introduce in regression (2) and (7) the variable DBank1*Interest. As we expected, the coefficient of the variable DBank1*Interest is positive and statistically significant at 1% level (regression 2). In regression 7, although negative, the coefficient is not statistically significant. This result confirms that the proprietary borrower information that Hausbank obtained as an integral part of their relationships result in an information monopoly, which, in turn, materializes in charging interest rate that are, ex-post, too high. Furthermore when we introduce the variable DBank2 (a dummy variable that takes value 1 if the company works with two or more banks and 0 otherwise) in regressions (3) and (8), the coefficient of the variable DBank2*Interest reserve the signal, i.e. is negative and statistically significant which confirm that borrowers with higher dependency of Hausbank pay a higher interest rate. These results are consistent with recent studies (e.g. Angelini et al. 1998; Degryse and Van Cayseele, 2000; Detragiache et al. 2000; Farinha and Santos, 2002) that find that borrowers tend to have relationships with multiple banks to avoid extraction of the rent from the banks11. In this context, borrowers increase the level of trade credit, since non-financial companies also have information about their creditworthiness.
Although granting trade credit exposes the company to financial risks, the supplier may be willing to offer financing to constrained borrowers because the companies have broader interests than the financial transaction12. Contact from the selling process can facilitate the monitoring of customers on an ongoing basis, and suppliers can also use two-part terms to obtain information on creditworthiness (Smith, 1987). Thus, the supplier may benefit in the long run by helping a struggling customer stay in business and therefore make future sales13. Indeed, in regressions 2, 3, 7 and 8 the level of trade credit increases even when companies face low levels of sales growth and profitability is low. Thus, suppliers may act also as liquidity providers, supporting their customers,
11
If the company borrows from multiple informed banks, the Bertrand Competition with informed banks occurs and extracting the rent is impossible (Rajan, 1992).
12
Indeed, Frank and Maksimovic (1999), Biais and Gollier (1997), Burkart and Elligsen (2004) and Cunat (2007) present models in which bank credit and trade credit are mixed optimally, i.e. in equilibrium companies use both trade credit and bank credit.
13
The problems of information monopoly by suppliers are not serious (Cunat, 2007:494). For instance, Burkart and Ellingsen (2004) argued that the relative illiquidity of intermediate goods as compared cash makes trade credit useful in solving agency problems between creditors and borrowers.
especially when they experience temporary liquidity shocks14. According Cunat (2007:491), the necessary condition for this element exists is the presence of a surplus that is divided between suppliers and customers if they continue to do business15.
In order to test the reaction of trade credit to unexpected changes in liquidity16, we introduce a dummy variable DLiquidity which that takes a value of 1 if liquidity drops more than 10% from the previous year and 0 otherwise. The variable liquidity can be seen as a proxy of borrower’s risk. A lower liquidity ratio implies that borrowers have fewer assets for immediate repayment of their loans. Generally, banks offer a higher interest rate if a company’s liquidity ratio is low because risk is higher and other misinformed banks do not make a loan to the borrower. The results are reported in columns (4) and (9). As we expected, the coefficients of the variable DLiquidity is positive and statistically significant at 1% level, indicating that the trade credit used is higher in company’s with low levels of liquidity and low levels of collateral assets17. The results related to the variables Interest and DBank1*Interest remains unchanged. These results confirm that trade credit grows more than other forms of credit whenever companies faced credit constrains and liquidity shocks.
As suggested by Petersen and Rajan (1997) the most important challenge is to examine the determinants of trade credit over time. To capture a more dynamic relationship between trade credit and changes in interest rate, we use dynamic estimators. We follow Arellano-Bond (GMM) method to get a consistent estimator. This estimator correct for any contemporaneous endogenous problems, not just for these associated with the inclusion of a lagged dependent variable18
14
For example, Nielsen (2002) show how large healthy companies borrow in downturns as a way to extend more finance to their liquidity constrained customers.
15
The idea of suppliers as liquidity providers is related to a stream of literature that concentrates the role of trade credit in liquidation default or renegotiation (e.g. Frank and Maksicmovic, 1999; Santos and Longhfer, 2003; Wilner, 2000; Huygherbaert et al. 2007; Huygherbaert, 2006).
16
Liquidity is defined as the ratio of current assets minus inventories to total liabilities (see appendix I). This variable has been used in the literature to identify new financing constraints and negative shocks to firm prospects (e.g. Fazarri et al. 1998; Cleary, 1999).
17
In regressions 9 and 10 the variable collateral change the signal to positive and statistically significant at 5% level and 10% level, respectively. One possible explanation for these results is due the fact that the
evolution of the dependent variable (TC2 – trade credit to total debt) measures the change in trade credit
with respect to debt. 18
By taking first differences and using several lagged dependent variables (in first differences also) as instruments, the Arellano-Bond estimator allows for unbiased and consistent estimation of the
Regressions 5 and 10 report the results. As we expected the coefficient on the lagged dependent variables is positive and statistically significant at 1% level. Indeed, this result provides empirical evidence that suppliers might also act as relationship lenders. The level of trade credit increases with the increase of demand for short term credit, particularly when companies face temporary liquidity constraints. The coefficient of the variable DBank1*Interest (positive and statistically significant in both regressions 5 and 10) provides empirical evidence that borrowers with longer banking relationships pay a higher interest rate. Furthermore, smaller companies face information monopolies more serious (the coefficients of the variables size and age are negative and statistically significant). The sign of other variables are consistent with what we argued.
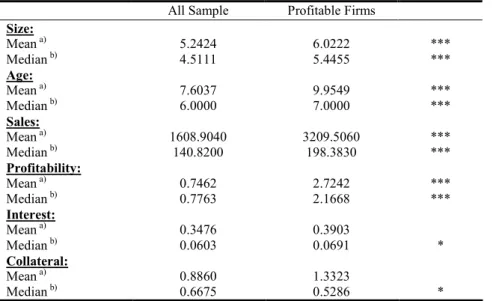
The previous results indicate that the problems of information monopoly are serious for the small companies that have relationships with only one bank. The results reported in table II show that when the interest rate the bank sets is too severe or worsened for the borrower, the ratio of trade payables increases. However, the causes of higher interest rates by banks are unknown. This is not only information monopoly but also a consequence of higher default risk. If default risk of the borrower becomes higher, the bank sets higher interest rates, which is not caused by acquiring monopoly rent. To exclude such case, we restrict our analyses to the sample of profitable companies. We define profitable companies, companies whose profit rate (profitability) is superior to median of such ratio (see appendix II). In table III, we compare some variables between the two samples.
coefficients of a model of the type yit =δyi,t−1+βxit+ηi+λt +εit, where ηi is an individual error
Table III: Comparison of descriptive statistics between two samples
All Sample Profitable Firms Size: Mean a) Median b) 5.2424 4.5111 6.0222 5.4455 *** *** Age: Mean a) Median b) 7.6037 6.0000 9.9549 7.0000 *** *** Sales: Mean a) Median b) 1608.9040 140.8200 3209.5060 198.3830 *** *** Profitability: Mean a) Median b) 0.7462 0.7763 2.7242 2.1668 *** *** Interest: Mean a) Median b) 0.3476 0.0603 0.3903 0.0691 * Collateral: Mean a) Median b) 0.8860 0.6675 1.3323 0.5286 * a)
Satterthwaite-Welch t-test tests for differences in means, assumed unequal variance; b)
Wilcoxon/Mann-Whitney test tests for differences in medians;
(***) Significant at 1% level; (**) significant at 5% level; (*) significant at 10% level.
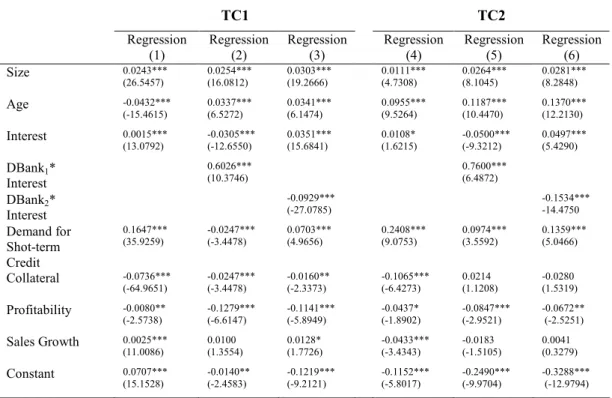
The profitable companies are bigger and older. As we expected the differences related to mean and median of the variables sales and profitability are statistically significant at 1% level. However, for the variables interest and collateral the differences (only for median value) are statistically significant at 10% level. Thus, profitable companies are not hit by negative shocks and their default risk is low, and therefore the interest rate for such companies is over competitive level. By limiting our analysis to the profitable companies, the cause of an increasing interest rate might be limited to acquire monopoly rent. In table IV, we present the regression results for profitable companies19.
19
Due to the lack number of observations, we are not able to estimate the dynamic model for profitable companies.
Table IV: The Relationship between Bank Information Monopoly and Trade Credit – Profitable Companies
TC1 TC2 Regression (1) Regression (2) Regression (3) Regression (4) Regression (5) Regression (6) Size 0.0243*** (26.5457) 0.0254*** (16.0812) 0.0303*** (19.2666) 0.0111*** (4.7308) 0.0264*** (8.1045) 0.0281*** (8.2848) Age -0.0432*** (-15.4615) 0.0337*** (6.5272) 0.0341*** (6.1474) 0.0955*** (9.5264) 0.1187*** (10.4470) 0.1370*** (12.2130) Interest 0.0015*** (13.0792) -0.0305*** (-12.6550) 0.0351*** (15.6841) 0.0108* (1.6215) -0.0500*** (-9.3212) 0.0497*** (5.4290) DBank1* Interest 0.6026*** (10.3746) 0.7600*** (6.4872) DBank2* Interest -0.0929*** (-27.0785) -0.1534*** -14.4750 Demand for Shot-term Credit 0.1647*** (35.9259) -0.0247*** (-3.4478) 0.0703*** (4.9656) 0.2408*** (9.0753) 0.0974*** (3.5592) 0.1359*** (5.0466) Collateral -0.0736*** (-64.9651) -0.0247*** (-3.4478) -0.0160** (-2.3373) -0.1065*** (-6.4273) 0.0214 (1.1208) -0.0280 (1.5319) Profitability -0.0080** (-2.5738) -0.1279*** (-6.6147) -0.1141*** (-5.8949) -0.0437* (-1.8902) -0.0847*** (-2.9521) -0.0672** (-2.5251) Sales Growth 0.0025*** (11.0086) 0.0100 (1.3554) 0.0128* (1.7726) -0.0433*** (-3.4343) -0.0183 (-1.5105) 0.0041 (0.3279) Constant 0.0707*** (15.1528) -0.0140** (-2.4583) -0.1219*** (-9.2121) -0.1152*** (-5.8017) -0.2490*** (-9.9704) -0.3288*** (-12.9794) All regressions are estimated by using GMM, which are robust to the heterocedasticity. Sargan Test
tests of absence of over identification. TC1 is the ratio of trade credit to total assets; TC2 is the ratio
of trade credit to total debt. The definition of remain variables is in appendix I. T-statistics appear in parentheses.
(***) Significant at 1%; (**) Significant at 5%; (*) Significant 10%.
The coefficient of the variable interest is positive and statistically significant (regression 1 and 4). When introducing the variable Dbank1*Interest, the coefficient is positive and statistically significant at 1% level (regressions 2 and 5). This conclusion supports the results of two period models proposed by Sharpe (1990) and Rajan (1992). In their two period models, a bank that makes a loan to a borrower in period 1 acquires more accurate information about characteristics of the borrower. Since banks that do not make a loan to the borrower in period 1 face the problem of asymmetric information in period 2, the informed bank acquires an information monopoly over the borrower. Thus, the informed bank can set a higher interest rate level to extract monopoly rent. Indeed, when we replace the variable Dbank1*Interest by the variable Dbank2*Interest (regressions 3 and 6), the coefficient changes the signal and remains statistically significant at 1% level. Hence, to avoid the hold-up problem the borrowers make relationships with multiple banks (e.g. Detragiache et al. 2000; Farinha and Santos, 2002). For remain variables the results are qualitatively similar.
5. Conclusion
In this paper we investigate how serious is monopoly information for Portuguese small medium size companies (SMEs). We test if informed non-financial companies can extend trade credit in order to decrease the monopolist power of lenders that might lead to hold-up problems, by analysing companies that obtain funds from just one bank and those who obtain funds from several banks.
By using a panel data of 468 Portuguese small companies for the period of 1998-2006, the empirical evidence strongly suggests that the problems of information monopolies are serious for the small companies that have relationships with only one or few banks. Thus, the proprietary borrowers information that Hausbanks obtain as an integral part of their relationships result in an information monopoly, which, in turn, lead to hold-up problems that materialize in Hausbank charging interest rates that are, ex post, too high. Since suppliers may be able and have incentives to evaluate and control the credit risk of their customers (if buyers default, suppliers lose their sales and must revise their business strategy), they are able to provide additional lending to their customers. Thus, the provision of trade credit lightens the problem of information’s monopolies.
Indeed, the results of our model confirm that companies that have less collateral assets cannot easily borrow from banks (i.e. bank credit is backward looking and depends on the collateral accumulated in previous periods), so they faced the problem of credit rationing. Due to the advantage of suppliers in salvaging value from existing assets, high interest rates are associated to an increase in the use of trade credit, which confirm the finance motive of trade credit (e.g. Ferris, 1981; Franks et al. 1985; Biais and Gollier, 1997; Burkart and Ellingsen, 2004). Furthermore, the results support the existence of a link between suppliers and customers that takes time to build and leads to suppliers help their customers who experience temporary liquidity shocks. Hence trade creditors act as relationship lenders. Due to the positive relationship found between trade credit and profitability, and as pointed out by Marotta (2005), the evidence that trade credit is more expensive than bank loans still is an open issue. These results are robust to dynamic estimators. Furthermore the monopolistic power of the Hausbank is confirmed when we restrict our empirical formulation to profitable companies.
This paper focuses on trade credit and test whether the informed non-financial firms can alleviate the problems of bank information monopolies. So an important aspect of trade credit is the two-way nature of the transaction. Many companies, particularly those at time points in the value chain, use trade credit as customers and provide are as suppliers. Thus, trade credit represents a substantial component of both corporate liabilities and assets. Alongside this obvious importance, further research should investigate how trade credit, by generating a chain of bankruptcies can have a feedback on the economic development, to provide recommendations to policy makers. For instance, the credit channel of monetary policy transmission predicts that when monetary policy tightens the reduction of institutional loans induces companies to increase their use of trade credit (e.g. Blasio, 2005; Mateut et al. 2006; Atsanova, 2007).
Appendix I: Definition of Variables Trade Credit: Assets Total Credit Trade TC = 1 Debt Total Credit Trade TC = 2
Credit Terms with Banks:
Debt Total Assets Tangible Collateral = ns Institutio Financial with Debt Term Large and Short Expenses Interest Interest =
DBank1 = Dummy that takes value 1 if the company works with just one bank and 0 otherwise
DBank2 = Dummy that takes value 1 if the company works with more than two banks and 0 otherwise
DInteraction1 = DBank1 * Interest Rate DInteraction 2 = DBank2 * Interest Rate
Firm Characteristics Variables:
Assets Total Cash Assets Current credit term short for Demand = − 1 1 − + = t Sales t Sales Growth Sales Assets Total EBIT ity Profitabil * =
Control Variables:
Age = Ln (time elapsed between the company’s founding date and the year of measurement)
Size = Ln (Total Assets)
s Liabilitie Total s Inventorie Assets Current Liquidity = −
DLiquidity = Dummy that takes the value 1 if the variable liquidity drops more than 10% from the previous year and 0 otherwise
Other Variables: Assets Total Debt Total BC = 1 s Liabilitie Total Debt Term Long BC = − 2
2 7 A P E N D IX I I: D es cr ip ti v e S ta ti st ic s TC 1 TC 2 BC 1 BC 2 In ter est Dem an d f or Sh ort -te rm Cre dit To tal A sse ts Siz e Pro fit ab ili ty Sal es Sal es Gro wth Co lla ter al AG E Liq uid ity M ea n 0 .1 4 6 3 0 .1 9 0 1 0 .3 8 3 3 0 .1 4 9 8 0 .3 1 5 7 0 .4 4 5 1 3 2 7 1 .0 4 4 0 6 .6 8 6 8 0 .0 0 7 6 4 4 0 3 .3 3 3 0 0 .8 7 0 8 0 .6 2 1 1 8 .0 0 0 0 0 .9 3 2 3 M ed ia n 0 .1 0 5 4 0 .1 3 3 7 0 .3 3 0 0 0 .0 8 0 3 0 .0 6 4 8 0 .4 5 0 6 1 .5 5 2 .4 5 6 0 7 .3 4 7 6 O .0 2 8 3 1 0 0 1 .3 1 6 0 0 .0 6 1 7 0 .5 7 0 7 6 .0 0 0 0 0 .6 5 5 8 M ax im u m 1 .3 2 6 2 0 .9 8 0 2 3 .6 4 8 9 2 .1 8 9 6 2 8 .2 0 0 0 0 .9 9 7 6 3 6 9 2 5 .2 7 0 0 1 0 .5 1 6 7 0 .6 4 4 6 4 0 9 5 2 .3 7 0 0 1 0 3 .5 7 6 1 4 .0 7 1 8 2 5 .0 0 0 0 3 5 .5 8 3 4 M in im u m 0 .0 0 0 0 0 .0 0 0 0 0 .0 0 0 2 0 .0 0 0 0 0 .0 0 0 0 0 .0 0 3 0 1 4 .3 4 2 0 2 .6 6 3 2 -1 .1 2 5 6 3 .9 2 0 0 -0 .9 7 4 0 0 .0 0 0 0 1 .0 0 0 0 0 .0 1 3 4 7 S td . D ev 0 .1 5 8 1 0 .1 9 0 6 0 .3 2 3 4 0 .1 9 5 6 1 .9 5 6 6 0 .2 3 3 6 5 1 6 7 .9 7 1 0 1 .9 8 9 1 0 .1 4 9 7 6 8 4 3 .7 2 3 0 7 .1 9 0 7 0 .4 2 6 4 5 .9 0 0 5 1 .8 1 9 2 S k ew n es s 2 .1 2 1 2 1 .1 9 1 3 3 .1 7 9 3 3 .0 5 5 3 1 1 .6 6 4 4 0 .0 7 3 2 3 .1 2 3 4 -0 .1 6 0 2 -1 .6 9 8 6 2 .3 9 6 1 1 1 .4 9 2 7 2 .6 1 8 1 1 .3 0 0 5 1 3 .3 0 0 8 K u rt o si s 1 1 .1 0 0 6 4 .0 7 9 9 2 5 .0 0 6 0 2 3 .7 1 4 7 1 5 0 .4 7 2 1 2 .1 8 5 7 1 5 .8 1 3 6 1 .6 8 4 5 1 2 .9 2 8 1 9 .6 9 0 0 1 4 2 .2 5 3 8 1 7 .6 6 7 0 3 .6 1 7 5 2 3 3 .3 6 8 5 S ee a p p en d ix I f o r a d ef in it io n o f v ar ia b le s. A ll v ar ia b le s ar e m ea su re d i n t h o u sa n d s o f e u ro s, e x cep t ra ti o s.
2 8 A P E N D IX I II : M a tr ix o f C o rr el a ti o n s TC 1 TC 2 Siz e Ag e Dem an d f or Sh ort -te rm Cre dit Co lla ter al In ter est Pro fit ab ili ty Sal es Gro wth Liq uid ity C1 1 .0 0 0 0 C2 0 .8 4 6 9 * * * 1 .0 0 0 0 iz e 0 .1 8 7 2 * * * 0 .2 2 9 3 * * * 1 .0 0 0 0 g e 0 .1 6 7 0 * * * 0 .2 1 4 5 * * * 0 .3 8 1 9 * * * 1 .0 0 0 0 em an d f o r S h o rt -rm C re d it 0 .2 3 2 9 * * * 0 .2 5 4 1 * * * 0 .2 9 6 2 * * * 0 .2 2 0 6 * * * 1 .0 0 0 0 o ll at er al -0 .1 5 9 0 * * * -0 .0 9 2 1 * * * -0 .0 3 6 1 0 .0 3 9 9 -0 .4 4 8 8 * * * 1 .0 0 0 0 te re st 0 .1 1 6 1 * * * 0 .1 3 1 5 * * * 0 .0 4 2 4 0 .0 2 3 6 0 .0 4 4 2 0 .0 1 4 5 1 .0 0 0 0 ro fi ta b il it y 0 .0 8 0 1 * * * 0 .1 4 3 3 * * * 0 .0 7 6 4 * * * 0 .0 3 1 2 0 .1 1 3 6 * * * -0 .0 2 5 4 0 .1 6 6 1 * * * 1 .0 0 0 0 al es G ro w th -0 .0 0 2 7 -0 .0 0 8 1 0 .0 1 2 0 -0 .1 2 6 8 * * * -0 .0 4 4 1 0 .0 4 7 8 * 0 .0 2 8 1 0 .1 2 6 5 * * * 1 .0 0 0 0 iq u id it y 0 .2 4 5 1 * * * 0 .2 7 9 1 * * * 0 .4 3 2 2 * * * 0 .4 3 4 3 * * * 0 .4 1 7 7 * * * 0 .3 6 3 4 * * * 0 .0 6 5 1 0 .0 9 7 5 * * 0 .0 9 6 8 * * 1 .0 0 0 0 ee a p p en d ix I f o r a d ef in it io n o f v ar ia b le s. A ll v ar ia b le s ar e m ea su re d i n t h o u sa n d s o f e u ro s, e x cep t ra ti o s. * * * ) S ig n if ic a n t at 1 % ; (* * ) S ig n if ic an t at 5 % ; (* ) S ig n if ic a n t at 1 0 % .
REFERENCES
ANGELINI, P.; DiSALVO, R. and FERRI, G. (1998) “Availability and Cost of Credit for Small Business: Customer Relationships and Credit Cooperatives”, Journal of Banking and
Finance, 22:925-954.
ARELLANO, M. (2003): “Panel Data Econometric”, Oxford University Press.
ARELLANO, M. and BOND, S. (1991): “Some Tests of Specification for Panel Data: Monte Carlo Evidence and an Application to Employment Equations”, Review of Economic
Studies, 58 (2):277-297.
ATANASOVA, C. (2007): “Access to Institutional Finance and the Use of Trade Credit”,
Financial Management, 36 (1): 49-67.
BANCO de PORTUGAL (2009): “Boletim Estatístico de Março de 2009”, http://www.bp.pt.
BARDES, B. (2002): “Délais de payment et solde du crédit interentreprises de 1989 à 2001”,
Bulletin de la Banque de France, 108: 103-21.
BECK, T.; DEMIRGÜÇ-KUNT, A. and MAKSIMOVIC, V. (2003) “Financial and Legal Institutions and Firm Size”, Working Paper, World Bank.
BEHR, P. and GUTTLER, A. (2007): “Credit Risk Assessment and Relationship Lending: An Empirical Analysis of German Small and Medium-Sized Enterprises”, Journal of Small
Business Management, 45 (2): 194-213.
BERGER, A. N. and UDELL, G. F. (1995): “Relationship lending and lines of credit in small firm finance”, Journal of Business, 68 (3): 351-381.
BERGER, A. N. and UDELL, G. F. (1998): “The economics of small business finance: The roles of private equity and debt markets in the financial growth cycle”, Journal of
Banking & Finance, 22 (8): 613-673.
BERGER, A. N. and UDELL, G. F. (2002): “Small Business Credit Availability and Relationship Lending: The Importance of Bank Organisational Structure”, The
Economics Journal, 112: 32–53.
BERGER, A. N.; MILLER, N. H.; PETERSEN, M. A.; RAJAN, R. G. and STEIN, J. C. (2005): “Does function follow organizational form? Evidence from the lending practices of large and small banks”, The Journal of Finance Economics, 76: 237-269.
BHATTACHARAYA, S. and CHISEA G. (1995): “Proprietary Information, Financial Intermediation, and Research Incentives”, Journal of Financial Intermediation, 4: 328-357.
BHATTACHARAYA, S. and THAKOR A. (1993): “Contemporany Banking Theory”, Journal
of Financial Intermediation, 3: 2-50.
BIAIS, B. and GOLLIER, C. (1997): “Trade Credit and Credit Rationing”, The Review of
Financial Studies, 10 (4): 903-937.
BLACKWELL, R. and SANTOMERO, A. (1982): “Bank Credit Rationing and Customer Relation”, Journal of Monetary Economics, 9: 121-129.