THE INFLUENCE OF DIVERSITY ON BOARDS ON
PROFITABILITY: AN OVERVIEW ACROSS
IBERIAN NON-FINANCIAL LISTED COMPANIES
!" # " $ % & ' " ( ) & * + , - . / 01 2 300. 4 1 / / . 5 * * + 6 . / 3. 6 . 7 - 1 8. 6 . / 037 9 * * * +
: ;< =>?>@ >A B < ?C D E=?>FE?A G D H ?=I A J K;L M N O PQR S TU V WX PQX YU S Z[\ ] ^U _ ] W`X ab Y : : c ] d b e f g ] ] Y ] h V X [Z^ i[[ b ^ j k f ]^ ] l Zf [U S Z[\ ] ^ U_ ] W`X a b Y :: : ;< =>?>@ >A B < ?CD E=?>FE?A G D H ?=I A J K;L M N O PQR S TU V WX PQX YU S Z[\ ] ^ U _ ] W`X ab Y
In modern economies, the corporate governance principles have been understood as drivers that mitigate the risk derived from the existing gap between managerial practices and ownership structure. This research contributes to the literature review, analyzing the relationship between the board characteristics, audit firms, and a set of indicators taken as proxies of performance. Based on a dataset of 124 non-financial companies, a linear model was regressed. We found that some characteristics of board of directors significantly influence the companies’ performance. These new insights can also provide new guidelines for policy makers towards the establishment of new common rules and principles that accurately grant the efficiency of corporate governance mechanisms and ensure the desired international comparability.
Corporate Governance, Diversity on Boards, Profitability, Portugal, Spain, Iberian Countries
The topic of corporate governance has been developed over the last decades in two different approaches: firstly, the way how firms are managed towards performance, efficiency, growth, structure, and relations with stakeholders; secondly, focusing on rules and regulations which influence the firm activity (Yacoob and Basiuni, 2014; Vintila and Gherghina, 2012; Dahya and McConnel, 2007; Coles et al., 2001). As a driver of corporate performance and profitability (Sachdeva, 2014), it relates to the way how the risk between ownership and management can be mitigated and diluted, the reason why agency theory assumptions have been used to highlight the corporate governance practices (Ahrens and Khalifa, 2013). Those practices can curb firm’s failures due to fraudulent activities, collusion schemes and mismanagement (Yaacob and Basiuni, 2014) and act as a driver of sustainability (Latteman, 2014).
Empirical research appears to demonstrate that companies with inefficient corporate governance deliver inferior returns to shareholders (Von Nandelstadh and Rosenberg, 2003), and that they tend to deliver lower profits and pay lower dividends. Bhagat et al. (2013) advocate that boards can improve performance by increasing attention to risk and embedding issues of risk into processes throughout the organization (Yaacob and Basiuni, 2014). Bhagat et al. (2013) also advocate learning from peers sitting on higher impact boards by leveraging financial metrics, reviewing major projects, and using systematic processes to create competitive advantage. Corporate governance not only deals with providers of financing and assures their investment return (Shleifer and Vishny, 1997), it also creates a
system that directs and controls companies (Sheikh et al., 2013).
This research aims to identify whether diversity on boards and type of audit firms can be used as predictors of company’s performance. It also aims to identify whether corporate governance indicators, such as board size, board composition, number of women in the boards, proportion of nonexecutive members, proportion of members participating in other internal and external committees, differ between Portugal and Spain.
Diversity of attributes on boards includes a mix of backgrounds and genders to ensure that the board is not built up solely of like-minded individuals. These attributes are seen as key drivers for the effectiveness of boards, because they generate different perspectives among board members and incentivize “group thinking” (FRC, 2011). In addition, board performance improves with a better mix of skills and/or backgrounds, as a diversity of perspectives among individuals can be a relevant strength on boards. Regardless, in order for an organization to leverage the diversity of perspectives, those businesses should accept that no single structure fits all cases George (2013), a reason that alone may influence the contradictory results of the research that has been performed mainly among different cultures in different countries. Corporate governance is an analytical mechanism that is used to establish objectives, determine the resources needed to achieve them, and to monitor performance (OECD, 2004); it is an evolving area driven by the need
to restore investor confidence (Sheikh et al., 2013). The monitoring of the board encompasses the monitoring of performance, which is not restricted to financial measures (Galbreath, 2012). The requirements also stipulate that companies, investors, and society in general will benefit from transparency because this will improve both competitiveness and job creation (Barnier, 2014; Yaacob and Basiuni, 2014; Mishra and Mohanty, 2013).
Long-term decision-making requires companies to adopt best practice by reporting financial and non-financial performance to stakeholders (Barnier, 2014; OECD, 2004). Areas that may fall within the important area of best practice include maintenance of an excellent reputation, lowering financing costs, corporate social responsibility, attracting and retaining talent. The adherence to principles of good governance is an important factor in investment decisions, applicable independent of size, ownership structure, or whether an unlisted firm (OECD, 2004), not least because these principles are aimed at protecting stakeholders (Mollah et al., 2012) from opportunistic behaviour by management and/or controlling shareholders (von Nandelstadh and Rosenberg, 2003). The correlation between the characteristics of boards (e.g. composition, size, independence, and diversity) and the performance of companies continues to be an inconclusive topic within the financial literature, despite the attention of practitioners, academics, and regulators (Anderson and Reeb, 2004; Ferrero-Ferrero et al., 2012; Dharmadasa et al., 2014). Furthermore, authors such as Bhagat and Bolton (2008) argue that the lack of an appropriately weighty system may result in the non-robust results. However, considering this weakness, empirical research concludes that good governance has a positive impact on performance (Gompers et al., 2003; Bebchuk and Cohen, 2009).
In relation to the size of boards, empirical research concludes that the size of the board relates positively to the return on assets, earnings per share, and market-to-book ratio, and that the effectiveness of the board is sensitive to different economic periods (Sheikh et al., 2013). A different perspective could be to leverage the characteristics of board members in terms of their expertise in order to overcome this barrier. According to Pfeffer and Salanick (1978), the greater the need for effective external linkage, the larger the board should be. On this aspect, Sheikh et al. (2013) concluded that while larger size boards reveal problems relating to co-ordination, and that the effectiveness of the board can deteriorate as a result, the larger size board might facilitate supervision due to the availability of greater human capital. Other research has concluded that larger boards are associated with negative performance as they reflect weaker control (Mashayekhi and Bazaz, 2008), and are less effective (Jensen, 1993). Van den Berghe and Levrau (2004) suggest that a larger board should increase the pool of expertise, as it is likely it will have more knowledge and skills than a smaller one.
Another important driver to board diversity is the percentage of women members on the board, because this relates to barriers and/or lack of awareness to the issue. Diversity and inclusiveness represent a cultural transformation, reflecting the measurable long-term objectives for the
accountability of management that cascades throughout the organization. Devillard et al. (2014) concluded that measures to increase diversity in the gender mix at senior executive level was not successful and that a key reason for this was the corporate culture, doubts among male members relating to the value of such measures, as well as a divergence of views between executives of different genders. All of these authors recommend that the CEO of the company should consider these barriers in order to achieve diversity objectives. Another barrier that diversity of genre could face, relates to quotas of female members on Boards. In Norway, Ahern and Dittmar (2012) point to that fact that the usual criteria, where board members are selected based on their skills in order to raise shareholder value, may be restricted if the pool of females, displaying the skills and levels of experience of their potential peers on boards, is small.
Governance also relates to the percentage of members on other boards among group companies. The full disclosure of the experience and background (Devillard et al., 2014; Dharmadasa, et al., 2014) for board nomination is central to improving the suitability of candidates (OECD, 2004). The monitoring role is linked to the personal values of board members—executive and non-executive—as well as stakeholders and their attitudes to society (Galbreath, 2012), a criterion that should influence the choice and suitability (the fit) for the job among candidates.
Regards the percentage of members on boards of external companies, both directors and boards can benefit from holding different positions on a number of boards (George, 2013). Governance mechanisms, board size, with robust links to the external environment, facilitates access to various resources— resource dependence theory—affecting performance positively (Sheikh et al., 2013). Another aspect to consider relates to the fact that social capital may emerge from director interlocks. As NEDs generally serve on multiple boards (Kor and Sundaramurthy, 2009), this is an argument that supports their social capital in becoming a relevant source of innovation and motivation for change (Galbreath, 2012; Scott, 1990).
Relating the proportion of independent board members, Dharmadasa et al. (2014) advocate that the performance of an enterprise is strongly linked to its characteristics, namely its independence; while Bhagat et al. (2013) conclude that boards became more effective after the financial crisis of 2008, due to better collaboration between executives and more active or skilled independent directors. On the other hand, the quality of a Non-Executive Director (NED) requires that the individual has neither had nor does have a previous relationship with the company (e.g. an employment contract) (Galbreath, 2012). This characteristic may include someone who has had a close relationship with the company at some time in the past, which must not affect the independent judgment of the NED (Kor and Sundaramurthy, 2009; Fama and Jensen, 1983). Independence and experience are usually the result of different managerial backgrounds and industry exposure among NEDs. As Fama and Jensen (1983) advocate, NEDs of this calibre tend to display greater motivation to monitor executives, and generally offer a higher level of criticism of that which is being done
Corporate Ownership & Control / Volume 13, Issue 2, Winter 2016, Continued – 2
as well as an informed vision for that which could be done.
Auditing serves as a boding and monitoring mechanism towards the reduction of agency costs derived from information asymmetry among ownership and management, and other third parties (Myers et al., 2014; Lin and Lin, 2014; Lee and Lee, 2013; Chen et al., 2013; Watts and Zimmerman, 1986; Jensen and Meckling, 1976). As an external mechanism of corporate governance, the audit firms can improve the value relevance of performance indicators, namely earnings and equity (Lee and Lee, 2013). De Angelo (1981) and Brown et al. (1999) argue that audit quality is positively associated to the size of the audit firm. However, the audit quality is also related to audit firm’s reputation, brand effects, and prior services outcomes (Healy and Lys, 1986). Thus, a Big 4 audit firm can serve a driver of value relevance by using the scale effects. The results achieved by Lee and Lee (2013) suggest the effectiveness of quality audits provided by Big 4 audit firms. Furthermore, those audits can better explain the changes in stock return, being more useful in predicting future value of the firm. Chen et al. (2013) corroborate these findings, evidencing a positive association between audit firm size and financial performance in national, regional, and local audit firms.
Size of the company (measured as total assets) together with financial leverage (proportion of debt relative to equity used to finance the business) can serve as control variables and are widely supported by the literature. The same references support the
predicted economic signals shown in Table 1, where Ordinary Least Squares (OLS) and multiple regressions (using a 5% Stepwise approach) have been employed to test the relationships between the dependent and independent variables.
This research is based on 124 non-financial listed companies, all of them integrating the Iberian stock exchange (Portugal: 37 companies; Spain: 87 companies). These companies were aggregated in nine activity sectors: 1. Oil and Gas; 2. Basic materials; 3. Industrials; 4. Consumer goods; 5. Health care; 6. Consumer services; 7. Telecommunications; 8. Utilities; and 9. Technology. Data relates to the economic year 2013 for the independent variables (performance indicators) and to 2014 for all the dependent variables. Data was extracted from the companies’ annual management reports, including corporate governance reports.
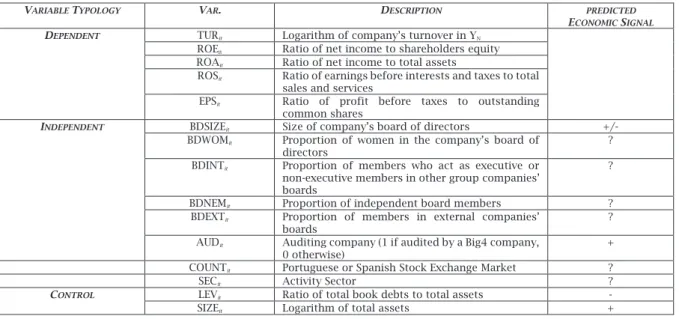
Based on the assumptions that diversity on boards and audit firms can influence companies’ performance indicators (Lattemann, 2014; Mishra and Mohanty, 2014; Myears et al., 2014; Lee and Lee, 2013; Chen et al. 2013; Galbreath, 2012; Bebchuk and Cohen, 2009; Kor and Sundaramurthy, 2009; Gompers et al., 2003; Scott, 1990), table 1 evidences the dependent and control variables, the corresponding predictors and expected signals. Table 1. Variables description and framework
VARIABLE TYPOLOGY VAR. DESCRIPTION PREDICTED
ECONOMIC SIGNAL
DEPENDENT TURit Logarithm of company’s turnover in YN
ROEit Ratio of net income to shareholders equity
ROAit Ratio of net income to total assets
ROSit Ratio of earnings before interests and taxes to total
sales and services
EPSit Ratio of profit before taxes to outstanding
common shares
INDEPENDENT BDSIZEit Size of company’s board of directors +/-
BDWOMit Proportion of women in the company’s board of
directors
? BDINTit Proportion of members who act as executive or
non-executive members in other group companies’ boards
?
BDNEMit Proportion of independent board members ?
BDEXTit Proportion of members in external companies’
boards
? AUDit Auditing company (1 if audited by a Big4 company,
0 otherwise)
+ COUNTit Portuguese or Spanish Stock Exchange Market ?
SECit Activity Sector ?
CONTROL LEVit Ratio of total book debts to total assets -
SIZEit Logarithm of total assets + In order to identify which variables (Xi; i=1,…k)
best contribute to explain the variance of
dependent variable, we have regressed the model as follows:
(
m)
n o p q r s s t u v w q xy r z r { | u } ~ } r w ~ } v r ~ } xv w ~ } t ~ } q xy r =
=
+
+
+
+
+
+
+
+
+
+
+
+
=
e
b
b
b
b
b
b
b
b
b
b
b
All variables were simultaneously introduced in the model in order to identify which ones can predict the companies’ performance (rejection of H0:
³
1=
³
2=…=
³
10=0; p<´ ). Thus, based on the literature theoretical background, we formulate the following two hypotheses:
Hypothesis 1: Performance indicators are influenced by the internal mechanism of corporate governance - diversity on boards.
Hypothesis 2: Performance indicators are influenced by the external mechanism of corporate governance – type of Audit firm.
Hypothesis 3: The distribution of boards’ characteristics and type of audit firm are the same for Portugal and Spain.
Companies were aggregated in nine activity sectors. The main representative is the sector “Industrials” (27.4%) which includes construction and materials, aerospace and defense, electronic, electrical equipment, and transportation. “Consumer goods” is the second most representative sector (21.0 %) and includes automobile and parts, beverages, food producers, household goods, home construction, leisure goods, tobacco. Relating auditing, 107 (96.3%) companies were audited by a Big 4 audit firm and 17 (13.7%) by a non-Big 4 audit firm. The main descriptive measures for other variables are evidenced in table 2.
Table 2. Descriptive measures
Variable N Minimum Maximum Mean Std. Deviation Skeweness Kurtosis
TURit 124 16.054 25.156 20.408 2.072 0.162 -0.389 ROEit 124 -387.700 514.800 -11.685 87.512 -0.238 15.701 ROAit 124 -117.700 141.300 -0.486 20.132 0.688 29.399 ROSit 124 -279.800 83.400 3.957 35.082 -5,154 38.619 EPSit 124 -34.550 78.050 0.478 8.466 5.816 60.785 BDSIZEit 124 3 30 10.22 4.151 1.212 3.256 BDWOMit 124 0 40 9.69 10.84 0.958 0.041 BDINTit 124 0 100 37.79 33.00 0.832 -0.526 BDNEMit 124 0 77 34.48 19.80 -0.009 -0.651 BDEXTit 124 0 100 37.00 34.60 0.746 -0.762 LEVit 124 0.730 342.589 70.632 39.188 0.199 -0.427 SIZEit 124 16.469 25.590 20.998 2.048 3.664 22.222 Table 3. Persons correlation coefficients
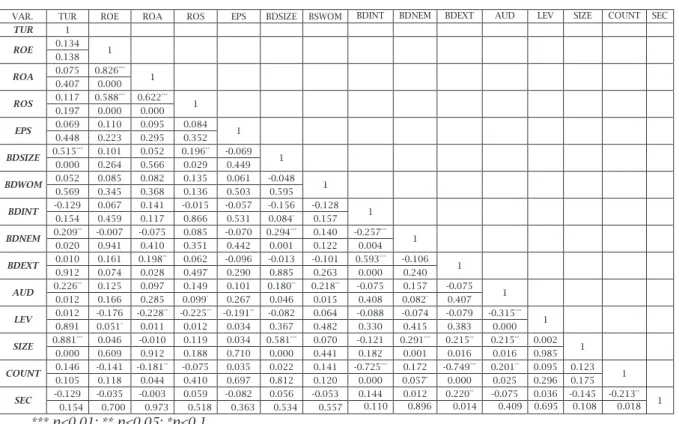
VAR. TUR ROE ROA ROS EPS BDSIZE BSWOM BDINT BDNEM BDEXT AUD LEV SIZE COUNT SEC
TUR 1 ROE 0.134 1 0.138 ROA 0.075 0.826 *** 1 0.407 0.000 ROS 0.117 0.588 *** 0.622*** 1 0.197 0.000 0.000 EPS 0.069 0.110 0.095 0.084 1 0.448 0.223 0.295 0.352 BDSIZE 0.515 *** 0.101 0.052 0.196** -0.069 1 0.000 0.264 0.566 0.029 0.449 BDWOM 0.052 0.085 0.082 0.135 0.061 -0.048 1 0.569 0.345 0.368 0.136 0.503 0.595 BDINT -0.129 0.067 0.141 -0.015 -0.057 -0.156 -0.128 1 0.154 0.459 0.117 0.866 0.531 0.084* 0.157 BDNEM 0.209 ** -0.007 -0.075 0.085 -0.070 0.294*** 0.140 -0.257*** 1 0.020 0.941 0.410 0.351 0.442 0.001 0.122 0.004 BDEXT 0.010 0.161 0.198 ** 0.062 -0.096 -0.013 -0.101 0.593*** -0.106 1 0.912 0.074 0.028 0.497 0.290 0.885 0.263 0.000 0.240 AUD 0.226 ** 0.125 0.097 0.149 0.101 0.180** 0.218** -0.075 0.157 -0.075 1 0.012 0.166 0.285 0.099* 0.267 0.046 0.015 0.408 0.082* 0.407 LEV 0.012 -0.176 -0.228 ** -0.225** -0.191** -0.082 0.064 -0.088 -0.074 -0.079 -0.315*** 1 0.891 0.051* 0.011 0.012 0.034 0.367 0.482 0.330 0.415 0.383 0.000 SIZE 0.881 *** 0.046 -0.010 0.119 0.034 0.581*** 0.070 -0.121 0.291*** 0.215** 0.215** 0.002 1 0.000 0.609 0.912 0.188 0.710 0.000 0.441 0.182 0.001 0.016 0.016 0.985 COUNT 0.146 -0.141 -0.181 ** -0.075 0.035 0.022 0.141 -0.725*** 0.172 -0.749*** 0.201** 0.095 0.123 1 0.105 0.118 0.044 0.410 0.697 0.812 0.120 0.000 0.057* 0.000 0.025 0.296 0.175 SEC -0.129 -0.035 -0.003 0.059 -0.082 0.056 -0.053 0.144 0.012 0.220 ** -0.075 0.036 -0.145 -0.213** 1 0.154 0.700 0.973 0.518 0.363 0.534 0.557 0.110 0.896 0.014 0.409 0.695 0.108 0.018 *** p<0.01; ** p<0.05; *p<0.1
Corporate Ownership & Control / Volume 13, Issue 2, Winter 2016, Continued – 2
Bivariate correlations analysis evidences several statistically significant associations between diversity on boards characteristics and the performance indicators. BDSIZE is associated with TUR (r=0.515;p=0.000) and ROS (r=0.196;p=0.029) while TUR is also associated with AUD (r=0.226;p=0.012).Thus, these results confirm the evidences achieved by Von den Berghe and Levrau (2004) about the influence of the size of boards of directors on performance. Thus, a larger board increases the pool of expertise, as it is likely it will have more knowledge and skills than a smaller one. However these results contradict the achievements of Mashayekhi and Bazaz, (2008) and Jensen (1993). Larger boards are associated with negative performance as they reflect weaker control and are less effective. Corroborating the evidences stated on Chen et al. (2013), the size of audit firm also
influences the companies’ key performance indicators.
In this section we present the effect of explanatory variables on performance and the differences between the countries under analysis. Only the model evidencing the relationship between independent variables and TUR could be validated. When we tested the relationship between performance (measured by ROE, ROA, ROS, and EPS), and internal and external corporate governance drivers introduced in the regression model, we could not validate the models, considering the significance achieved for F- test.
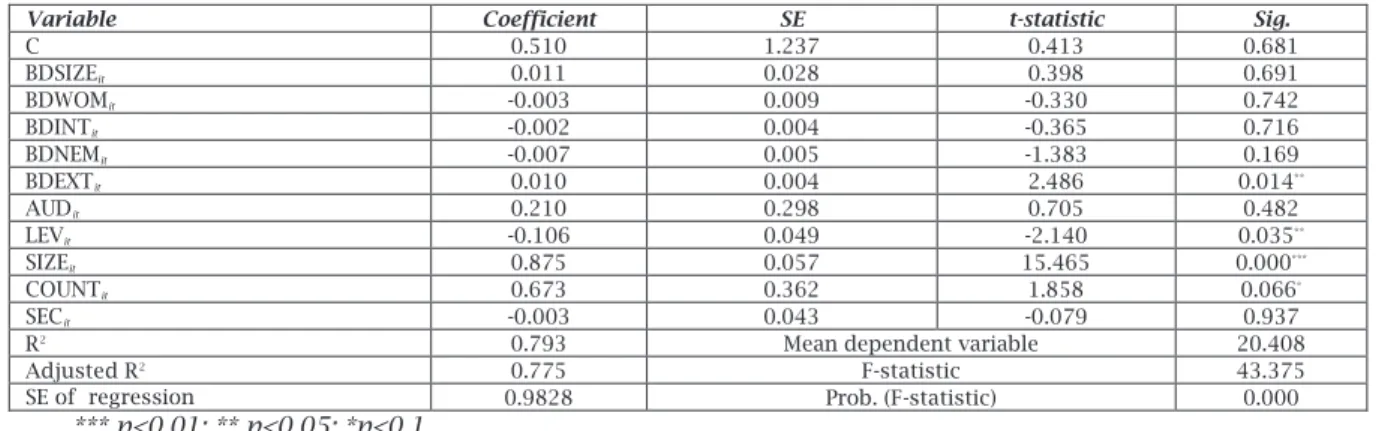
Table 4. The effect of explanatory variables on TUR
Variable Coefficient SE t-statistic Sig.
C 0.510 1.237 0.413 0.681 BDSIZEit 0.011 0.028 0.398 0.691 BDWOMit -0.003 0.009 -0.330 0.742 BDINTit -0.002 0.004 -0.365 0.716 BDNEMit -0.007 0.005 -1.383 0.169 BDEXTit 0.010 0.004 2.486 0.014** AUDit 0.210 0.298 0.705 0.482 LEVit -0.106 0.049 -2.140 0.035** SIZEit 0.875 0.057 15.465 0.000*** COUNTit 0.673 0.362 1.858 0.066* SECit -0.003 0.043 -0.079 0.937
R2 0.793 Mean dependent variable 20.408
Adjusted R2 0.775 F-statistic 43.375
SE of regression 0.9828 Prob. (F-statistic) 0.000
*** p<0.01; ** p<0.05; *p<0.1
Based on our theoretical regression model, it can only be used to predict companies’ turnover (Adj. R2=0.775; F=43.3757;p=0.000). Dependent variable is
significantly influenced by then proportion of board members participating in other external group committees (t=2.486;p=0.014), from firm size (t=15.465;p=0.000), from leverage (t=-2.140;p=0.035), and from the country (t=1.858;p=0.066). The expected signals for these variables confirm the literature (Jensen, 1986; Sheikh et al., 2013). Thus, they confirm the assumptions of Jensen (1986) that debts reduces the agency costs of free cash flow and larger firms have greater variety of capabilities, leveraging the economies of scale which positively influence firm turnover (Ehikioya, 2009). Relating the other dependent variables, diversity on boards and audit firm cannot act as significant predictors of performance. Thus, they cannot be used to predict ROE (Adj. R2=0.008; F=1.101;p=0.368), ROA (Adj.
R2=0.037; F=1.467;p=0.161), ROS (Adj. R2=0.045;
F=1.579;p=0.122)), and EPS (Adj. R2=0.009;
F=1.116;p=0.356). These results do not corroborate the evidence achieved by Shikh et al. (2013) for Pakistani firms. However, they are partially consistent with the results achieved by Vintila and Gherghina (2012). When using the indicators ROA and ROE, these authors could not validate the models, considering the significance of F-test. Thus, our hypothesis 1 is not confirmed, except for the impact of BDEXT on TUR. Hypothesis 2 is not confirmed either, which means that the type of audit firm (Big 4 or non-Big 4) does not influence the company’s performance. This result is not aligned with Lee and Lee (2013) findings that results audited by Big 4 audit
firms are generally more relevant than those audited by non-Big 4 audit firms.
In respect to model validity, Variance Inflation Factor (VIF) assesses the degree of multicollinearity in the model. Thus, we found that none of our independent variables has a VIF value close to 10 (it varies between 1.116 and 3.526), concluding that our analysis does not observe a multicollinearity severe problem. Towards the analysis of residuals independence, we used the Durbin-Watson (DW). Based on our DW statistics, we notice that null hypothesis cannot be rejected (DW=2.031). Thus, residuals can describe a normal distribution, confirming its independence. All other model assumptions, such as heteroscedasticity were also confirmed towards the robustness model validly.
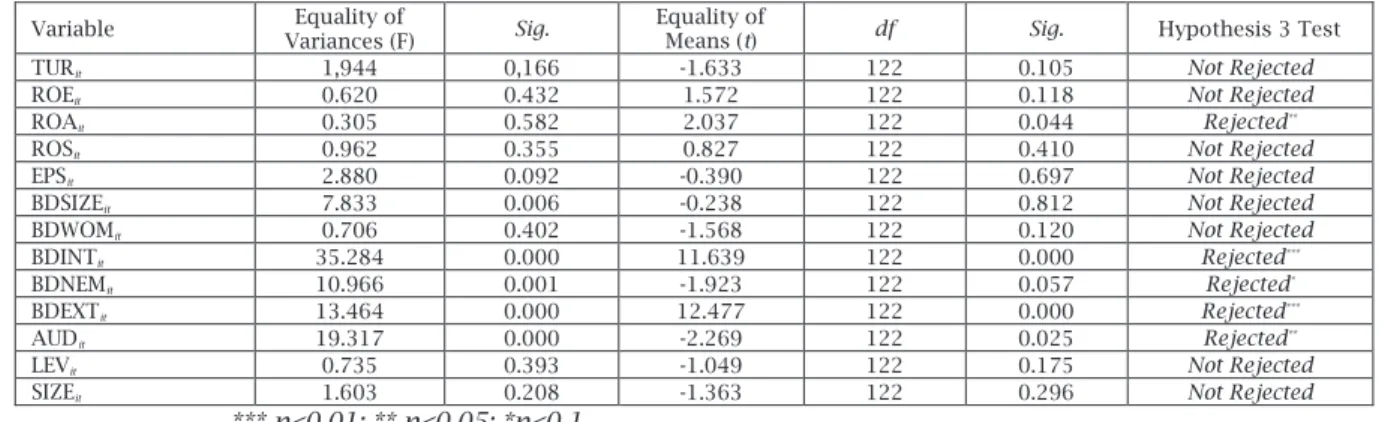
Null hypothesis states that the distribution between variables is the same across both countries (Portugal and Spain). This hypothesis cannot be rejected for TUR, ROE, ROS, EPS, BDSIZE, BD WOM, LEV, and SIZE, which means that the performance level and those boards’ characteristics do not differ across countries. We consider it as an expected result because firms are integrated in a globalized market, with diversified corporate governance structures, and affected by macroeconomic externalities, such as sovereign debts effects. However, the null hypothesis is rejected for ROS (internal efficiency measure), BDINT, BDNEM, BDEXT, and Aud. These results can be supported by cultural issues (e.g. impact of Big 4 audit firms), and differences in the requirements stated in the national corporate governance codes (e.g. limitations in the participation in other boards and committees).
Table 5. Comparison between Portugal and Spain
Variable Equality of
Variances (F) Sig.
Equality of
Means (t) df Sig. Hypothesis 3 Test TURit 1,944 0,166 -1.633 122 0.105 Not Rejected
ROEit 0.620 0.432 1.572 122 0.118 Not Rejected
ROAit 0.305 0.582 2.037 122 0.044 Rejected**
ROSit 0.962 0.355 0.827 122 0.410 Not Rejected
EPSit 2.880 0.092 -0.390 122 0.697 Not Rejected
BDSIZEit 7.833 0.006 -0.238 122 0.812 Not Rejected
BDWOMit 0.706 0.402 -1.568 122 0.120 Not Rejected
BDINTit 35.284 0.000 11.639 122 0.000 Rejected***
BDNEMit 10.966 0.001 -1.923 122 0.057 Rejected*
BDEXTit 13.464 0.000 12.477 122 0.000 Rejected***
AUDit 19.317 0.000 -2.269 122 0.025 Rejected**
LEVit 0.735 0.393 -1.049 122 0.175 Not Rejected
SIZEit 1.603 0.208 -1.363 122 0.296 Not Rejected *** p<0.01; ** p<0.05; *p<0.1
Over the last decade, nations have introduced new rules and procedures towards the risk mitigation derived from the information asymmetry. The codes of corporate governance introduced the need to implement, comply, and report to stakeholders, a wide set of internal and external mechanisms. Two important mechanisms of corporate governance are diversity on boards and audit firms. From an economic point of view, these mechanisms can serve as drivers of performance, embodying expertise, technical and human skills, knowledge, driving companies into sustainable levels of profitability. However, our approach, applicable for Iberian listed companies listed, only supports the relationship between diversity on boards, audit firms, and performance measured by turnover. We could not support a relationship between performance (measured by ROE, ROA, ROS, and EPS) and independent variables, considering the significance level achieved in F- tests. The second remark relates to the existing differences in the distribution of some variables when we compare both countries. When considering the proportion of independent members in the board, the proportion of members participating in other internal and external boards, and the audit firm (Big 4 or non-Big 4), the null hypothesis is rejected. These findings can contribute for the literature with practical insights about the Iberian listed companies. Regarding the limitations, this research was conducted only for one year and for non-financial listed companies in two countries. To extend the range of time and the number of listed companies and countries under analysis, can corroborate or refute the evidences achieved in the current research. As future research directions, we could research the relationship between corporate governance and firm performance, measured through other metrics (e.g. Tobin’s Q, Market-to-Book ratio) and using other approaches as simultaneous equations model or generalized method of moments.
Performance and profitability, as an economic outcome of management, are key signals towards sustainability over the years to come. Thus, the dynamic changes in the corporate governance models
are used to increase growth, profitability, and to mitigate financial and economic risk. The current research provides both an understanding of how internal governance mechanisms tested in aggregate positively affect the performance of firms and offer some explanation as to the relationship between internal governance mechanisms and the performance of firms. It adds value to the current literature by exploring the effects of governance mechanisms on the performance of Iberian firms.
1. Ahern, R., K. and Dittmar, A., K. (2012), “The Changing of the Boards: The impact on firm valuation of mandated female board representation”, The Quarterly Journal of Economics (2012), pp. 137–97.
2. Ahrens, T. and Khalifa, R. (2013), “Researching the lived experience of corporate governance”, Qualitative Research in Accounting & Management, Vol. 10, No. 1, pp. 4-30.
3. Anderson, R. C. and Reeb, D. M. (2004), “Board Composition: Balancing Family Influence in S&P 500 Firms”, Administrative Science Quarterly, Vol. 49, No. 2, pp. 209µ 37.
4. Barnier, M. (2014), “Disclosure of Non-Financial Information: Europe’s largest companies to be more transparent on social and environmental issues”, European Commission Statement/14/291, online at: http://europa.eu/rapid/press-release_STATEMENT-14-291_en.htm (accessed on 15 November 2015).
5. Bebchuk, L. and Cohen, A. (2009), “What matters in corporate governance?”, Review of Financial Studies, Vol. 22, No. 2, pp. 783–827.
6. Bhagat, S. and Bolton, B. (2008), “Corporate Governance and Firm Performance“, Journal of Corporate Finance, Vol. 14, pp. 257–73.
7. Bhagat, C., Hirt, M. and Kehoe, C. (2013), “Improving board governance: McKinsey Global Survey Results”, McKinsey Quarterly, pp. 91µ 98, online at http://www.mckinsey.com/insights (accessed 20 October 2015).
8. Brown, S., Lo, K. and Lys, T. (1999), “Use of R2 in
accounting research: measuring changes in value relevance over the last four decades”, Journal of Accounting and Economics, Vol. 28, pp. 83-135. 9. Chen, Y., Hsu, J., Huang, M. and Yang P. (2013),
“Quality, size, and performance of audit firms”, The International Journal of Business and Finance Research, Vol. 7, No. 2, pp. 89-105.
10. Coles, J. W., McWilliams, V. B. and Sen, N. (2001), “An examination of the relationship of governance
Corporate Ownership & Control / Volume 13, Issue 2, Winter 2016, Continued – 2
mechanisms to performance”, Working paper, Rufgers Business School, Newark, NJ.
11. Dahya, J. and McConnell, J. J. (2007). “Board composition, corporate performance, and the Cadbury committee recommendation”, Journal of Financial and Quantitative Analysis, Vol. 42, No. 3, pp. 535-564.
12. Devillard, S., Sancier-Sultan, S. and Werner, C. (2014), “Why gender diversity at the top remains a challenge”, McKinsey Quarterly, online at http://www.mckinsey.com/insights (accessed 04 May 2015)
13. Ehikioya, K. (2009), “Corporate governance structure and firm performance in developing economies: evidence from Nigeria”, Corporate Governance, Vol. 9, No. 3, pp. 231-243.
14. Fama, E. and Jensen, M. C. (1983), “Separation of ownership and control”, Journal of Law and Economics, Vol. 26, No. 2, pp. 301¶ 49.
15. FRC (2011), Guidance on Board Effectiveness. Financial Reporting Council, online at:
https://www.frc.org.uk/Our-Work/Codes- Standards/Corporate-governance/UK-Corporate- Governance-Code/Guidance-for-boards-and-board-committees.aspx (accessed 06 September 2015). 16. Galbreath, J. (2012), “Are boards on board? A model
of corporate board influence on sustainability performance”, Journal of Management & Organization, Vol. 18, No. 4, pp. 445–60.
17. George, W. (2013), “Board governance depends on where you sit”, McKinsey Quarterly, 1, pp. 80¶ 90. 18. Gompers P. A., Ishii J. L. and Metrick A. (2003),
“Corporate governance and equity prices”, Quarterly Journal of Economics, Vol. 118, No. 1, pp. 107–55.
19. Healy, P. and Lys, T. (1986), “Auditor changes following Big eight takeovers of non-Big eight audit firms”, Journal of Accounting and Public Policy, Vol. 5, No. 4, pp. 251-265.
20. Jensen, M. C. (1986), “Agency costs of free cash flow, corporate finance, and takeovers”, The American Economic Review, Vol. 76, No. 2, pp. 831-880.
21. Jensen, M. C. (1993), “The modern industrial revolution, exit, and failure of internal control systems”, Journal of Finance, Vol. 48, No. 3, pp. 831–80.
22. Jensen, M. and Meckling, W. (1976), “Theory of the firm: managerial behaviour, agency costs, and ownership structure”, Journal of Financial Economics, Vol. 3, No. 4, pp. 305-360.
23. Kor, Y. Y. and Sundaramurthy, C. (2009), “Experience based human capital and social capital of outside directors”, Journal of Management, Vol. 35, No. 4, pp. 981–1006.
24. Lattemann, C. (2014), “On the convergence of corporate governance practices in emerging markets”, International Journal of Emerging Markets, Vol. 9, No. 2, pp. 316-332.
25. Mashayekhi, B. and Bazaz, M. S. (2008), “Corporate governance and firm performance in Iran”, Journal
of Contemporary Accounting & Economics, Vol. 4, No. 2, pp. 156¶ 72.
26. Myears, L. a., Schmidt, J. and Wilkins, M. (2014), “An investigation of recent changes in going concern reporting decisions among Big N and non-Big N auditors”, Review of Quantitative Finance, Vol. 43, pp. 155-172.
27. Lee, H. and Lee, H. (2013), “Do Big 4 audit firms improve the value relevance of earnings and equity?”, Managerial Auditing Journal, Vol. 28, No. 7, pp. 628-646.
28. Mishra, S. and Mohanty, P. (2013), “Corporate governance as a value driver for firm performance: evidence from India”, Corporate Governance, Vol. 14, No. 2, pp. 265-280.
29. Mollah, S., Farooque, O. and Karim, W. (2012), “Ownership structure, corporate governance and firm performance: Evidence from an African emerging market”, Studies in Economics and Finance, Vol. 29, No. 4, pp. 301¶ 19.
30. OECD (2004), OECD Principles of Corporate
Governance, online at:
http://www.oecd.org/corporate/principles-corporate-governance.htm (accessed 03 May 2015). 31. Pfeffer, J. and Salanick, G. R. (1978), The External
Control of Organizations: A Resource Dependence Perspective, New York, NY: Harper & Row.
32. Sachdeva, G. (2014), “Corporate Governance, Concepts and Practices: A Survey”, The International Journal of Business & Management, Vol. 2, No. 2, pp. 51-60.
33. Sheikh, N. A., Wang, Z., and Khan, S. (2013), “The impact of internal attributes of corporate governance on firm performance: Evidence from Pakistan”, International Journal of Commerce and Management, Vol. 23, No. 1, pp. 38¶ 55.
34. Shleifer, A. and Vishny, R. W. (1997), “A survey of corporate governance”, Journal of Finance, Vol. 52, No. 2, pp. 737¶ 83.
35. Van den Berghe, L. A. A. and Levrau, A. (2004), “Evaluating boards of directors: What constitutes a good corporate board?” Corporate Governance: An International Review, Vol. 12, pp. 461¶ 78.
36. Von Nandelstadh, A. and Rosenberg, M. (2003), “Corporate governance mechanisms and firm performance: Evidence from Finland”, Working Papers 497, Helsinki: Hanken School of Economics. 37. Vintila, G. and Gherghina, C. (2012). “an Empirical Examination of the Relationship between Corporate Governance Ratings and Listed Companies’ Performance”, International Journal of Business and Management, Vol. 7, No. 22, pp. 46-61.
38. Watts, R. L. and Zimmerman, J. L. (1983). “Agency problems, auditing, and the theory of the firm: some evidence”, Journal of Law and Economics, Vol. 26, pp. 613-634.
39. Yaacob, H. and Basiuni, J. (2014). “Corporate governance model of a state-owned enterprise: evidence from an Asian emerging market”, Corporate Governance, Vol. 14, No. 4, pp. 504-514.