Universidade do Minho
Escola de Engenharia
Ana Luísa da Silva Carmo
outubro de 2015
Flow Cytometry Analyses of
Calcification Propensity
Ana Luísa da Silva Carmo
Flow Cytome
tr
y Anal
yses of Calcification Propensity
UMinho|20
Ana Luísa da Silva Carmo
outubro de 2015
Flow Cytometry Analyses of
Calcification Propensity
Universidade do Minho
Escola de Engenharia
Trabalho efetuado sob a orientação do
Professor Doutor Wilhelm Jahnen-Dechent
RWTH Aachen
e do
Professor Doutor Miguel Gama
Universidade do Minho
Dissertação de Mestrado
Mestrado Integrado em Engenharia Biomédica
Ramo de Engenharia Clínica
iii
Acknowledgments
Apart from my efforts, the success of this thesis depends largely of several people who contributed to the realization of it. I take this opportunity to express my gratitude to the people who have been instrumental in the successful completion of this project.
First of all, I would like to express my gratitude to Dr. Wilhelm Jahnen-Dechent, to accept me at his institute and for his expertise, constant support and encouragement that contributed greatly to my dissertation work.
To Dr. Miguel Gama for being my supervisor in my university and for his attention and availability.
To Steffen for the time he dedicated to me, for the experience and knowledge he shared with me, for the sympathy and availability demonstrated which proved to be important in all the time of my research.
To Philipp for his teaching and support to make the microfluidic devices and the availability to help me during my dissertation work.
To all lab members for the warm reception. They were always available to help and contributed to a nice atmosphere in the lab.
To my friends who always told me to believe in myself and gave me support when I most needed it. I am especially grateful to Joana and Rita, my Erasmus roommates, for being my second family when I was away from home.
And last but not least, to my family, especially to my parents and brothers, who were extremely important. They always gave me the emotional support, understanding, affection, and constant encouragement to successfully achieve everything in my life.
iv
Flow Cytometry Analyses of Calcification Propensity
Abstract
Vascular and soft tissue calcification is a major health problem, contributing to cardiovascular morbidity and mortality in both the general population and chronical kidney disease (CKD) patients. The presence of fetuin-A in serum inhibits calcification by binding to calcium phosphate. This complex is called calciprotein particles (CPPs). There is a test, using the nephelometer, to measure the overall calcification propensity (T50) of serum, analysing the CPPs ripening process.
The present dissertation aimed to determine the calcification risk using a flow cytometer. For that, fetal calf serum and human serum were tested on the nephelometer and on the flow cytometer. The CPPs formation was achieved adding calcium and phosphate to serum. In addition, for flow cytometry analysis, it was also added calcein (fluorochrome) to the mixture. Furthermore, the influence of temperature on the transition time from primary to secondary CPPs was tested. Finally, the possibility to determine the calcification propensity on microfluidic devices, using two different channels - with 0,5 mm height or with 1 mm was tested.
It was observed that FACS can determine the transition time from primary to secondary CPPs and calcein has no influence on the crystals formations. Higher temperatures decreased the transition time, but had no influence on the CPPs properties. The trials carried out on the microfluidic devices showed that it is possible to measure the T50 and the volume does not seems to influence the estimated value.
Taken together, this study demonstrate that it is possible to use flow cytometry to analyse calcification propensity, but only using the side scatter results. Also it shows that increasing the temperature accelerates the CPPs ripening. Finally, it has been shown that a microfluidic device allows the estimation of the T50 value.
vi
Resumo
A Calcificação vascular e dos tecidos moles é um importante problema de saúde que, contribui para a morbidade e mortalidade cardiovascular, tanto na população em geral como em doentes crónicos renais. A presença de fetuína-A no soro inibe a calcificação, ligando-se ao fosfato de cálcio. O complexo formado é chamado de calciproteinas. Para medir a propensão global de calcificação, existe um teste usando o nefelómetro através da análise do processo de amadurecimento das calciproteinas.
A presente dissertação teve como objetivo determinar o risco de calcificação usando a citometria de fluxo. Para isso, foram testados soro fetal bovino e soro humano usando o nefelómetro e o citómetro de fluxo. A formação das calciproteinas foi conseguida adicionando cálcio e fosfato ao soro. Além disso, para a citometria de fluxo, também foi adicionada calceína (fluorocromo) à mistura. Foi ainda testada a influência da temperatura sobre o tempo de transição de calciproteinas primárias para secundárias. Finalmente, testou-se a possibilidade de determinar a propensão calcificação em microdispositivos, utilizando dois dispositivos diferentes, com 0,5 mm de altura e com 1 mm.
Observou-se que a citometria de fluxo pode ser usada para determinar o tempo de transição de calciproteinas primárias para secundárias e a calceína não tem influência na formação de cristais. O aumento da temperatura mostrou uma diminuição no tempo de transição, mas sem influência nas propriedades das calciproteinas. Os resultados obtidos a partir dos microdispositivos mostraram que é possível medir o tempo (T50) nestes e o
volume não parece influenciar o T50.
Concluindo, este estudo demonstra que é possível a utilização de citometria de fluxo para analisar o risco de calcificação, mas apenas utilizando os resultados do laser de dispersão lateral. Também mostra que com o aumento da temperatura a maturação das calciproteinas é mais rápida. Relativamente ao microdispositivo, é possível medir o risco de calcificação.
viii
Table of Contents
Acknowledgments ... iii
Abstract ... iv
Resumo ... vi
Table of Contents ... viii
List of Abbreviations ... x
List of Figures ... xii
Chapter 1 Introduction ... 1
1.1 Calcification ... 3
1.1.1 Physiologic Calcification ... 3
1.1.2 Pathologic Calcification ... 4
1.3 Fetuin-A functions ... 6
1.3.1 Fetuin-A: A calcification inhibitor ... 7
1.4 Test to measure overall calcification propensity (T50-test) ... 9
1.5 Flow Cytometry ... 10
1.6 Aims of the work ... 12
Chapter 2 Methods ... 13
2.1 Human Serum Samples ... 15
2.2 Measurement of Calcification Propensity ... 15
2.2.1 Nephelometer ... 15
2.2.2 Flow Cytometry... 16
2.3 Transmission Electron Microscopy ... 16
2.4 Ultrasonic hot embossing ... 16
2.5 Statistical Analyses ... 17
Chapter 3 Results ... 19
3.1 Calcification analysis on Nephelometer ... 20
ix
3.3 Calcification propensity analysis on FACS Calibur ... 24
3.3.1 Sheath Fluid... 26
3.4 Calcification propensity analysis ... 29
3.4.1 Nephelometer Analyses... 29
3.4.2 FACS Calibur Analyses ... 30
3.4.3 FACS Canto Analyses ... 33
3.5 Influence of Calcein ... 35 3.6 Influence of temperature ... 36 3.6.1 FCS ... 36 3.6.2 Human Serum ... 39 3.7 T50 on microfluidic devices ... 45 Chapter 4 Discussion ... 47
4.1 Flow cytometry analyses of calcification propensity ... 49
4.2 Influence of Calcein ... 51
4.3 Influence of Temperature ... 51
4.4 T50 on a microfluidic device ... 53
Chapter 5 Conclusion and future perspectives ... 55
x
List of Abbreviations
˚C - Degree Celsius % - Percent µL – Microliter mL - Milliliter µm – Micrometer mm – MillimeterEDTA - – Ethylenediaminetetraacetic acid FCS – Fetal calf serum
s - Second min – Minutes
NaCl – Sodium chloride CaCl2 – Calcium chloride
NaOH - Sodium hydroxide Na2HPO4 - Disodium phosphate
pH - Negative decadic logarithm of H3O+ concentration
M - Molar
mM – Millimolar
FACS - Fluorescence-activated cell sorting TEM – Transmission Electron Microscopy T50 – One-half maximal transition time
CPPs – Calciprotein particles SSC – Side scattering FSC – Forward scattering Ca – Calcium PO4 – Phosphate Calc – Calcein Ser – Serum HS – Human serum FCS – Fetal Calf Serum vs – versus
PC – Polycarbonate N – Newton
xi Pa – Pascal
CKD – Chronical Kidney Disease CUA – Calcific uremic arteriopathy BMP – Bone morphogenetic protein TGF-β – Transforming growth factor beta PTH – Parathyroid hormone
FGF23 – Fibroblast growth factor 23 HAP – Hydroxyapatite
OPN – Osteopontin
MGP – Matrix γ-carboxyglutamic acid protein VSMC – Vascular smooth muscle cells
CPM - Calciprotein monomers ANOVA – Analysis of Variance P – Significance value
xii
List of Figures
Figure 1 - Cartoon of human protein fetuin-A showing cystatin-like domains 1 (green) and 2 (yellow) and a third unrelated domain (blue). Figure 1 taken from [9]. ... 6 Figure 2 – Formation of primary and secondary calciproteins CPPs from fetuin-A monomer and mineral percursors. A: Hydroxyapatite, the circle represents a Ca9(PO4)6 Posner cluster as a building block of the apatite structure; B: primary CPPs, spherical and unstructured agglomerates of mineral and fetuin-A and C: secondary CPP consist of a crystalline mineral core covered by fetuin-A. Figure 2 adapted from [9]. ... 8 Figure 3 - BD FACSCalibur Optical Path Configuration. Taken from [76] ... 11 Figure 4 – Calcification propensity analyses on nephelometer: T50 test for FCS (diluted 1:8) and human serum A, B, C, D, E and F. Error bars represent standard deviation.... 20 Figure 5 - Flow cytometry analyses: Calcification propensity for FCS and controls analysed after the CPPs sample: – without PO4; without Ca; without Calcein. ... 21 Figure 6 - Flow cytometry analyses: Calcification propensity for HS A and controls analysed after the CPPs sample: without PO4; without Ca; without Calcein. ... 22 Figure 7 - Flow cytometry analyses: Calcification propensity for HS B and controls analysed after the CPPs sample: without PO4; without Ca; without Calcein and only Serum. ... 23 Figure 8 – Flow cytometry analyses: Controls analysed before the CPP sample (a); Calcification propensity for HS C (b); Controls analysed after the CPP sample (c)... 25 Figure 9 - Flow cytometry analyses: Calcification propensity for HS D (a); Controls analysed after the CPP sample (b). ... 26 Figure 10 - Flow cytometry analyses: Controls analysed before the CPPs sample (a); Calcification propensity for HS E (b); Controls analysed after the CPPs sample (c). ... 27 Figure 11 - Flow cytometry analyses: Controls analysed before the CPPs sample (a); Calcification propensity for HS F (b); Controls analysed after the CPPs sample (c). ... 28
xiii
Figure 12 – Calcification propensity analyses on Nephelometer: T50 test for human serum A on 3 days. Error bars represent standard deviation. One way ANOVA was used to test statistical significance. ... 29 Figure 13 - Flow cytometry analyses: Controls analysed before the CPPs sample (a); Calcification propensity for HS A (b); Controls analysed after the CPPs sample (c). ... 30 Figure 14 - Flow cytometry analyses: Controls analysed before the CPPs sample (a); Calcification propensity for HS A (b); Controls analysed after the CPPs sample (c). ... 31 Figure 15 - Flow cytometry analyses: Controls analysed before the CPPs sample (a); Calcification propensity for HS A (b); Controls analysed after the CPPs sample (c). ... 32 Figure 16 - Flow cytometry analyses: Controls analysed before the CPPs sample (a); Calcification propensity for HS A (b); Controls analysed after the CPPs sample (c). ... 33 Figure 17 - Flow cytometry analyses: Controls analysed before the CPPs sample (a); Calcification propensity for HS A (b); Controls analysed after the CPPs sample (c). ... 34 Figure 18 – Calcification propensity analyses on nephelometer (T50 test): Influence of
calcein on the calcification propensity of human serum C, D, E, F, G and H. Error bars represent standard deviation. Student’s t-test was used to test for statistical significance. ... 35 Figure 19 - Flow cytometry analyses at 37 ºC: Controls analysed in the beginning of the assay (a); Calcification propensity for FCS (b); Controls analysed in the end of the assay (c). ... 36 Figure 20 - Calcification propensity analyses on nephelometer: for FCS at 50 ºC. ... 37 Figure 21 - Flow cytometry analyses at 50 ºC: Controls analysed before the CPPs sample (a); Calcification propensity for FCS (b); Controls analysed after the CPPs sample (c). ... 38 Figure 22 - Calcification propensity analyses on nephelometer: HS G at 37 ºC. ... 39
xiv
Figure 23 - Flow cytometry analyses at 37 ºC: Controls analysed in the beginning of the assay (a); Calcification propensity for HS G (b) Controls analysed in the end of the assay (c). ... 40 Figure 24 – Representative scanning electronic microscopy photographs of CPP Sample at 37 ºC: 1 min (a); 150 min (b); 180 min (c); and 270 min (d). All images were viewed at 100000 magnification. ... 41 Figure 25 - Calcification propensity analyses on nephelometer: HS G at 45 ºC. ... 41 Figure 26 - Flow cytometry analyses at 45 ºC: Controls analysed in the beginning of the assay (a); Calcification propensity for HS G (b) Controls analysed in the end of the assay (c). ... 42 Figure 27 - Representative scanning electronic microscopy photographs of CPP Sample at 45 ºC: 1 min (A); 80 min (B); and 200 min (C). All images were viewed at 35970 magnification. ... 43 Figure 28 - Calcification propensity analyses on nephelometer: HS G at 55 ºC. ... 43 Figure 29 - Flow cytometry analyses at 55 ºC: Controls analysed in the beginning of the assay (a); Calcification propensity for HS G (b); Controls analysed in the end of the assay (c). ... 44 Figure 30 - Representative scanning electronic microscopy photographs of CPP Sample at 45 ºC: 1 min (A); 10 min (B); 20 min (C); and 80 min (D). All images were viewed at 100000 magnification. ... 45 Figure 31 – Microfluidic device made using hot embossing technique (A); Adapted 96 well plate with the microfluidic devices implanted (B). ... 45 Figure 32 - Calcification propensity analyses on nephelometer: HS I analysed on a normal 96 well plate and on an adapted 96 well plate: on intact wells and on 0,5 mm height and 1mm height microfluidic devices. Error bars represent standard deviation. One way ANOVA was used to test statistical significance. ... 46
1
3
1.1 Calcification
Calcium (Ca) and phosphate (PO4) are indispensable to the correct function of the
organism, however their concentration in human serum exceeds the soluble ion concentrations making calcification possible throughout our body by forming highly insoluble salts. William Neuman declared that our body is on danger of turning into a pillar of salt, “Lot’s wife’s problem” [1]. So, it is necessary to maintain mineral homeostasis. This is achieved with a tight metabolic control of minerals and the presence of calcification inhibitors in serum. In a healthy human being total calcium ranges from 2.1 to 2.6 mM. It is tightly regulated through a concerted effort of the gut, kidney and bone, with the parathyroid gland being the master regulator. When the serum calcium levels are low, parathyroid hormone (PTH) is secreted by the parathyroid gland, stimulating mobilization of calcium from the bone, retention in the kidney and increased uptake through the gut [2], [3]. Also, PTH leads to increased phosphate secretion via the kidneys to guarantee homeostasis of the calcium x phosphate product. After extended hypocalcaemia PTH stimulates calcitriol synthesis, the physiologically active form of vitamin D3. Calcitriol induces calcium and phosphate reabsorption in the gut and also activate bone resorption [2], [4]. Serum phosphate regulation has been shown to be mediated by fibroblast growth factor 23 (FGF23) [5]. FGF23 is predominantly expressed by osteocytes and osteoblasts, its synthesis is regulated by phosphate levels and calcitriol. It acts mainly on the kidney, inhibiting phosphate re-uptake and calcitriol synthesis by binding to its receptor complex composed of FGFR and klotho. Binding of klotho induces transformation of FGFR into a specific receptor for FGF23 [6]. Mice lacking FGF23 or klotho suffer from hypophosphatemia, elevated calcitriol and soft tissue calcification [7].
1.1.1 Physiologic Calcification
Under physiological conditions, calcium and phosphate only mineralize in bones and teeth. These ions form a stable product, hydroxyapatite (HAP), which may form in the circulation when nucleation inhibitors are missing [2]. This is a highly regulated process that involves the synthesis and excretion of proteins by bone cells, osteoblasts and odontoblasts respectively, that enriched from plasma form a matrix which is subsequently mineralized by HAP deposition [2]. Fetuin-A is a serum-derived major protein representing about 25% of the noncollagenous protein in bone mineralized matrix [8].
4
1.1.2 Pathologic Calcification
Calcification, a progressive disease of deregulated mineral metabolism, has been observed in the cardiovascular system for many decades. Ectopic calcification of the cardiovascular system predominantly affects the aorta, coronary arteries, peripheral arteries, and the aortic valve. [9] When mineral homeostasis is broken, HAP is deposited in vasculature and soft tissue. This happens when the regulation of calcium and phosphate concentration is disturbed and the crystal precipitation is no longer inhibited. Some molecular compounds, like pyrophosphate, bisphosphonates and magnesium can inhibit HAP formation through competitive crystallization inhibition [10]–[13]. Additionally, proteins like osteopontin (OPN), matrix γ-carboxyglutamic acid protein (MGP) and fetuin-A can regulate ectopic calcification. Deposition of HAP can occur in all soft tissues although some organs e.g. kidneys and cardiovascular tissue seem to be more calcification-prone than others. Many diseases are associated to calcified lesions. These can be genetically induced like fibrodysplasia ossificans progressive or pseudoxanthoma
elasticum; autoimmune, systemic lupus erythematosus; infectious like
tuberculosis [38], [40]–[42]. Also described to be associated with ectopic calcification are cancer – different kinds of tumors and metastasis have been found to develop calcified lesions –, chronical kidney disease (CKD) and cardiovascular diseases like atherosclerosis [17]–[19]. Additionally, calcification is associated with prostheses implantation. In particular biologic heart valve implants have been described to bear the risk of calcification [20]. Here, inflammation as well as mechanical stress and additional treatment with anticoagulants have been shown to be the main reasons for the development of calcified lesions [21].
1.1.2.1 Ectopic Calcification in CKD
Calcification is prevalent in patients with chronic kidney disease (CKD), in the skin or in the cardiovascular system, which is a significant risk factor for cardiovascular (CV) mortality [22]. Calciphylaxis, or calcific uremic arteriopathy (CUA), is a rare complication characterized by diffuse calcification of the media of small to medium arteries and arterioles with intimal proliferation and thrombosis that results in skin ulcers. [23], [24]. CUA involves inflammation, endovascular fibrosis and vascular smooth muscle cell apoptosis leading to calcification of small blood vessels [25]. Low
5
serum calcitriol levels as a consequence of kidney damage induce increased PTH secretion. PTH promotes bone turnover as well as calcium and phosphate release from bone tissue [49], [52]. Also, in CKD patients, inhibitors like fetuin-A are decreased. Thus, spontaneous HAP nucleation cannot be prevented and crystals are deposited in vascular walls of small arterioles of the skin and subcutaneous fat tissue [27]. Vascular calcification occurs as intimal calcification of atherosclerotic plaques or within the medial arteries. Medial calcification, also known as Mönckeberg sclerosis is most common in patients with CKD [28]. Here, vascular smooth muscle cells (VSMC) undergo a phenotypic change into the osteochondrocytic lineage contributing to HAP deposition [29]. It was demonstrated that under different cell stressing conditions occurring in atherosclerosis and CKD, including oxidative stress, elevated inflammation markers, hypophosphatemia and elastin degradation, Cbfa-1 expression is induced [30]. Cbfa-1, also known as Runx2, is described to be major osteoblastic transcription factor and thus the main factor in osteochondrogenic transdifferentiation of vascular smooth muscle cells [31]. In addition to the mechanisms described above, the lack of inhibitory proteins plays a crucial role and leads to formation and deposition of HAP crystals. Namely the most important proteins are OPN, MGP and fetuin-A [32].
1.2 Fetuin-A
Fetuin-A was first described by Pederson in 1944[33] as the major globular plasma protein in fetal calf serum. In humans, the homolog protein, was only detected in 1961 by Heremans, Schmid and Bürgi, being named α2-Heremans-Schmid-glycoprotein (Ahsg), in honor to the two discovers and because it belongs to the electrophoretic α2-fraction of serum [34], [35]. Homologues have been described in many vertebrates and most recently in snake. Fetuin-A is highly expressed during embryogenesis decreasing fast after birth. In adult it is mostly synthetized by hepatocytes and quite abundant in extracellular fluids with physiological concentrations in the range of 0,4 to 1 g/L [36], [37]. Fetuin-A along with fetuin-B, histidine-rich glycoprotein, and kininogen is a member of the cystatin superfamily of cysteine protease inhibitors [38]. Members of this family share cystatin-like protein domains (D1 and D2), and have a third domain (D3) specific for each protein. Fetuin-A D1 is strongly negatively charged with a high affinity for calcium rich minerals [39]. This protein bears posttranslational modifications including glycosylation, phosphorylation and sulfation [40]. In humans, a single chain precursor is cleaved into
6
the circulating two-chain form, which is connected by a disulfide bond. Human mature fetuin-A has 350 amino acids and an apparent molecular weight of 60 kDa [8].
Figure 1 - Cartoon of human protein fetuin-A showing cystatin-like domains 1 (green) and 2 (yellow) and a third unrelated domain (blue). Figure 1 taken from [8].
1.3 Fetuin-A functions
Fetuin-A is a protein with several biological functions associated in fields such as: mineralization biology; metabolism; cardiovascular system and Central Nervous System. These functions include proteinase interaction, lipid binding, lectin binding, a role in opsonization, endocytosis and serine protease inhibition [41]–[45]. Furthermore, a sequence homology between TGF-β receptor type II and fetuin-A was discovered, indicating antagonist properties for TGF-β and bone morphogenetic protein signaling. Accordingly, studies of fetuin-A deficient mice showed altered bone growth as a result of impaired TGF-β/BMP signaling in osteoblasts [46]. Further studies related to fetuin-A as an antagonist of TGF-β showed an inhibitory progression of intestinal tumor [8]. On the other hand, Ochieng et al reported that fetuin-A facilitates tumor growth [47]. Additionally, fetuin-A was identified as a negative acute phase reactant once its values decrease during inflammation [48]. Le Cam et al showed that a protein pp63, later identified as rat fetuin-A, inhibited insulin receptor tyrosine kinase signaling, thus reducing insulin sensitivity [49]. These led to several clinical studies to investigate the
7
role of fetuin-A in diabetes and metabolic syndrome. Recently, Wang et al. have shown that fetuin-A reduces early cerebral ischemic injury in rats and has a protective role in lethal systemic inflammation in mice [50], [51]. Also, fetuin-A was described to be associated with rheumatoid arthritis, intrauterine growth restriction and Alzheimer’s disease. Elevated fetuin-A levels were shown to be associated with preeclampsia and non-alcoholic steatohepatitis, whereas fetuin-A levels are reduced in chronic obstructive pulmonary disease. Besides, fetuin-A was reported to serve as a biomarker in multiple sclerosis [52]–[58]. Despite all this functions, the inhibitory calcification capacity is the primary function of this protein and will be explained in detail on chapter 1.2.1.1.
1.3.1 Fetuin-A: A calcification inhibitor
Until now, fetuin-A is the only protein that acts as a systemic inhibitor of ectopic calcification [59]. In contrast, MGP and other intrinsic calcification inhibitors, all act locally. It was discovered that fetuin-A binds calcium phosphate and calcium carbonate with high affinity, which explains its enrichment in bone [8], [60]. This inhibitory capacity only function for the de novo formation of calcium phosphate and does not dissolve mineral already formed. The inhibitory effect is mediated by acidic amino acids clustering in cystatin-like domain D1 [8]. In full accord with this biochemical finding, genetic work using fetuin-A–deficient mice likewise showed a stable phenotype of severe ectopic calcification affecting various organs and tissues [59], [61]. To explain these findings, Heiss et al. proposed the fetuin-A dependent formation of soluble, colloidal particles consisting mostly of calcium, phosphate and fetuin-A. Those particles were named calciprotein particles (CPPs) and range from 50 to 200 nm in size depending on their particular state. Fetuin-A has been shown to bind HAP via negative charges in its domain D1. The ripening of CPPs is a multistep process (Figure 2) [62]. As a first step, fetuin-A by its aspartic and glutamic acid side chains in D1 binds spontaneously formed pre-nucleation clusters of calcium and phosphate resulting in calciprotein monomers (CPM), inhibiting mineral precipitation and crystal growth. CPMs aggregate to form transiently stable, spherical CPPs with a size lower than 100 nm in diameter called primary CPPs. After a lag period, primary CPPs transform into elongated-shape and more crystalline particles, called secondary CPPs with a diameter up to 200 nm. Secondary calciprotein particles are stabilized by a compact outer fetuin-A monolayer against further growth for up to 30 hours at body temperature, which is ample time for clearing of
8
calciprotein particles from circulation [8]. Fetuin-A was reported to be essential for the formation and stabilization of primary CPPs. Albumin and other acidic plasma proteins were found to subsequently contribute to the protein shell of CPPs. Heiss et al. proposed that formation of CPPs enables transport and clearance of calcium phosphate mineral in the body, to confirm an animal study was made by Herrmann et al [63], [64]. CPPs were found in the ascites fluid of a peritoneal dialysis patient suffering from sclerosing calcifying peritonitis, revealing their existence in vivo [65]. Transmission electron microscopy confirmed the similarity of these particles with synthetic CPPs. Most recently, protein-mineral complexes containing fetuin-A have been found in dialysis patients with CKD [66]. Smith and colleagues described the accumulation of CPPs in serum of CKD patients, but not in serum of healthy individuals [60], [67]. All these findings suggest that CPP formation occurs whenever mineral concentrations in blood exceed a critical threshold and homeostasis is disturbed. To prevent ectopic precipitation, CPPs must be cleared from circulation. In 2012, the underlying mechanism could be clarified by Herrmann and colleagues [63]. It was demonstrated that CPPs injected in mice were rapidly cleared by phagocytes of the monocytic phagocyte system and were found to accumulate in liver Kupffer cells and MARCO positive macrophages in the spleen. Binding and uptake assays with inhibitors and scavenger receptor A (SR-A) deficient bone marrow-derived macrophages revealed that SR-A is the receptor responsible for CPP uptake and clearance [63]. It was also demonstrated that hemodialysis can reduce CPP% during the dialysis procedure [60].
C
B
Figure 2 – Formation of primary and secondary calciproteins CPPs from fetuin-A monomer and mineral
percursors. A: Hydroxyapatite, the circle represents a Ca9(PO4)6 Posner cluster as a building block of the
apatite structure; B: primary CPPs, spherical and unstructured agglomerates of mineral and fetuin-A and C: secondary CPP consist of a crystalline mineral core covered by fetuin-A. Figure 2 adapted from [8].
9
1.4 Test to measure overall calcification propensity (T
50-test)
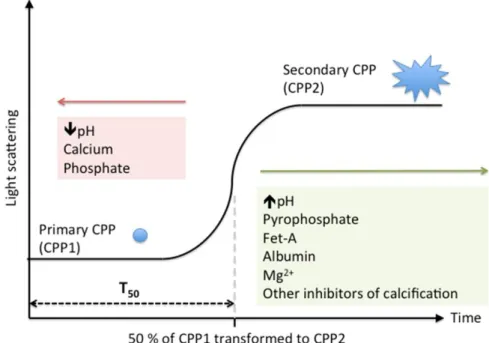
With calcification being a major problem for human health it is important to have a diagnostic method to determine the overall calcification propensity of biological fluids. Pasch et al. discovered that the kinetics of CPP formation can be used to assess overall calcification propensity in biological fluids. The transition from primary to secondary CPPs can be analysed using the nephelometry. The nephelometer quantifies the amount of laser light scatter in turbid solutions. Figure 3 shows the formation and transformation of CPPs in a supersaturated solution. To the serum, Ca and PO4 is add increasing the
serum supersaturation. T50 measures the time taken for light scattering intensity to reach
its half-maximal read out. The specific effect of supersaturation depends on the intrinsic concentrations of Ca, PO4 - higher the concentration, faster the transition (Figure 3 - red)
and calcification inhibitors - higher the concentration, slower the transition (Figure 3 – red) - in a given serum. The test takes 10 hours to complete and indicates the half maximal transition time (T50), a predictor of calcification propensity, for each person [68]. This
finding was applied in a cohort study with stages 3 and 4 CKD patients [69].
Figure 3 – T50 test: Formation and transition from primary CPPs (CPP1) to secondary CPPs (CPP2).
The process can be delayed by calcification inhibitors (green) or accelerated by substrates of apatite formation and acidosis (red). Taken from [77]
10
1.5 Flow Cytometry
Flow cytometry is technology that simultaneously measures and analyses the multiple physical characteristics of single particles as they flow in a liquid stream trough a beam of light [70]. It allows particle analysis, cell sorting, and the study of cell function/dynamics [71]. Cells are most commonly analysed but, other particles, such as nuclei, chromosomes, molecules or small beads, can also be studied [72]. The properties measured include a particle’s relative size, relative granularity or internal complexity, and relative fluorescence intensity. A flow cytometer is made up of three main systems: mechanics, optics, and electronics [70], [72]. The mechanical system is related to the suspension of the particles and the particles flow. The optical consists of lasers to illuminate the particles in the sample stream and optical filters to direct the resulting light signals to the appropriate detectors. The electronic is involved in the transformation of the signals into analogic-digital and the acquisition, processing, analysis and data backup in computer [72]. In the flow chamber, the particles in suspension are collected by a needle and immersed in a liquid, sheath fluid that flows at a higher velocity. The sample core remains separate but coaxial within the sheath fluid. The flow of sheath fluid accelerates the particles and restricts them to the center of the sample core. This process is known as hydrodynamic focusing [70]. The optical system consists of excitation optics, laser and lenses that are used to shape and focus the laser beam, and collections optics. This consists of collection lens to collect light emitted from the particle–laser beam interaction and a system of optical mirrors and filters to route specified wavelengths of the collected light to designated optical detectors. An optical bench in a flow cytometer provides a stable surface that holds the light source and the excitation and collection optics in fixed positions [70].The particles flow intersect the light beam one by one. Light is scattered in several directions, namely in the forward direction, being collected by a detector of frontal dispersion, and in lateral directions being collected, at approximately 90 degrees to the laser beam, by a collection of lens and then redirected by a beam splitter to the appropriate detector. This is a case of lateral dispersion. Fluorescence is emitted in all directions, but follows the same optical path as lateral light scatter [71], [73]. Information is collected about the relative size of the cell (forward scattering), the shape or complexity (side scattering) and of autofluorescence or, if the sample has been stained with a fluorochrome, of fluorescence specific to cellular structures or dynamic functions [70], [73].
11
12
1.6 Aims of the work
Vascular and soft tissue calcification is a serious medical problem that contributes to cardiovascular morbidity and mortality in both the general population and CKD. It is of great importance to understand its causes and find suitable therapies. It is also a necessity to create an efficient and quick method to evaluate the propensity of calcification in every patient.
The existing method to determine the calcification propensity (T50) is based on the
transition from primary to secondary CPPs. Along with this process the CPPs alter their form and shape. Since flow cytometry allows cell sorting by means of cell shape and morphology analysis, this method was applied to the study of calciproteins, as to determine the calcification propensity of biological fluids.
Another aim of this work was to test the influence of temperature on the transition time. In addition, a microfluidic device was used to estimate T50, aiming to developa fast
and efficient method, but also a small and portable equipment, easy to use for the screening of the calcification propensity.
13
Flow Cytometry Analyses of Calcification Propensity
15
2.1 Human Serum Samples
Serum samples from venous blood were obtained from lab workers. All blood samples were clotted at room temperature for 30 minutes and spun at 2000 x g for 10 minutes at room temperature to separate serum from blood cells. The serum was frozen and stored until further use.
2.2 Measurement of Calcification Propensity
Calcification propensity was measured using Nephelometer (BMG Labtech, Offenburg, Germany) and Flow Cytometry: FACS Canto and FACS Calibur (Both FACS from Becton Dickinson, Heidelberg, Germany)
The CPP’s for the test, were created mixing serum (bovine or human) plus 3 stock solutions: Calcium solution (40 mM CaCl2 + 100 mM Hepes + 140 mM NaCl, pH
adjusted with 10 M NaOH to 7.40 at 37 °C); Phosphate solution: (19.44 mM Na2HPO4 +
4.56 mM NaH2PO4 + 100 mM Hepes + 140 mM NaCl, pH adjusted with 10 M NaOH to
7.40 at 37°C) and Calcein (6,9 mg/L - diluted with NaCl). All chemicals were purchased from AppliChem (Darmstadt, Germany). Before the pipetting, all solutions were filtered with a membrane 0,1 µm and pre-warmed to 37 ºC on a water bath.
2.2.1 Nephelometer
The pipetting steps for the nephelometer analysis were performed in a thermoconstant room (37º C) using the Liquidator96 bench-top pipetting system (Mettler Toledo GmbH, Giessen, Germany). These pipetting steps were performed in the following order: (1) NaCl solution: 20 ml/well, (2) serum: 80 ml/well, (3) shaking for 1 minute, (4) phosphate solution: 50 ml/well, (5) shaking for 1 minute, and (6) calcium solution: 50 ml/well and shaking for 1 minute. Air bubbles in the wells were disintegrated with a needle, and the 96 wells were covered with a ThinSeal adhesive sealing film for microplates. The assay was performed for 200 cycles with 1.5-seconds measurement time per well and a position delay of 0.1 seconds in horizontal plate reading mode, adding up to a cycle time of 180 seconds per cycle for our standard assay. This assay adds up to a total assay run time of 10 hours per assay. The gain and laser adjustment was set at 90% required value, gain 50 with a laser beam focus of 1.5 mm, and laser intensity of 50%. After completion of the
Flow Cytometry Analyses of Calcification Propensity
16
run, data were transferred to Excel and transposed from lines into columns. Data columns were copied into the GraphPad Prism program to generate an XY graph. Data were then processed by calculating nonlinear regression in the log (agonist) vs. response–variable slope (four parameters) mode using the robust fit fitting method. The resulting values obtained for T50 were further processed as required.
2.2.2 Flow Cytometry
Due to the solutions used in the samples measured, it was necessary to substitute the original sheath fluid of FACS for 140 mM NaCl + 50 mM Hepes, pH adjusted with 10 M NaOH to 7,4. To make the CPP sample (3 mL) the solutions were added in the following order: (1) Serum (1,2 mL); (2) Calcein (300 µL); (3) Phosphate Solution (750 µL); (4) Calcium Solution (750 µL). The Calcium was added just before start the measurement. At each time point 300 µL were used on FACS. During the experience all the samples were on a water bath at 37 ºC until the time of measurement. For each assay the controls were measured after the last time point. The component(s) missing in the five controls of the mixture were substituted by NaCl. On FACS Calibur the scale used was logarithmic and the settings for FSC were E01, for SSC 643 and for FL-1 690. The threshold for FSC was set to 0. The results were obtained using Flowjo.
2.3 Transmission Electron Microscopy
The CPP samples were prepared as mentioned in 2.2. At the selected time points 100 µL were pipetted to eppendorf with a dialyses membrane and were dialyzed for 1 hour in a buffer solution, 15mM Ammoniumcarbonate. Then 1 drop of the dialyzed solution was applied to nickel grids. The grids were dried at room temperature, and the CPPs were visualized without staining.
2.4 Ultrasonic hot embossing
The T50 was also measured in microfluidic devices with double chambers. To build
these devices, first it was necessary to create a hard structure with the holes to fill the chambers. This part was made using a milling machine, MP 7 (DATRON AG, Darmstadt, Germany), the design was created on the computer using OTC Creo and then designed on the polycarbonate (PC (Rachow Kunststoff-Folien GmbH, Hamburg, Germany)). The other part, made also of PC, has the chambers. These were made recurring to ultrasonic
Flow Cytometry Analyses of Calcification Propensity
17
hot embossing technique. The tools, made of Aluminum (SCHMOLZ + BICKENBACH, Germany), were glued on the plate and heated to 80 ºC. Some foils of PC were placed and fixed laterally on the tool. Parameters as amplitude, force, pressure, time and hold time must be adjusted to each experience. For one of the tools (1 mm height) 8 foils of the polymer were used, the force was 2,5 N and about 200 Pa. Time and hold time were 1,4 s and 1,5 s, respectively. For the second tool (0,5 mm height) the parameters were similar, it was only used 7 foils and both times were 1 ms lower. To stick the foils of PC to the structure, ultrasonic hot embossing was used again. In this case the force was 1,5 N, pressure of 100 and the times 0,3 s and 1 s. Before used, the chips were rinsed with ultrapure water. To clean the chips and reuse them, they were rinsed with EDTA (0,5 M EDTA + 140 mM NaCl; pH 7,4), to get rid of molecules who could attach to the polymer, and with ultrapure water to clean the chips from EDTA. The chambers were filled with a syringe and then analysed on the nephelometer.
2.5 Statistical Analyses
Statistical analysis was performed using GraphPad Prism software for Windows. The two-way ANOVA with the Tukey’s test and t-test were used to determine statistical differences. All tests were performed with a 95% confidence level.
19
Flow Cytometry Analyses of Calcification Propensity
20
3.1 Calcification analysis on Nephelometer
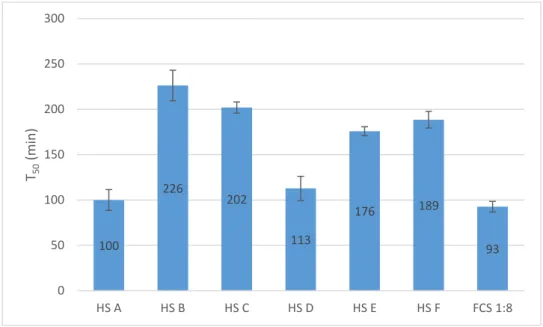
The T50 test was made using the nephelometer to determine the spontaneous
transition step from primary to secondary CPPs by adding calcium, and phosphate to serum. Figure 5 shows the T50 values obtained for fetal calf serum (FCS) (diluted 1:8)
and 6 human sera.
Observing the results obtained it is easily seen that FCS has the faster transition time while the human sera differ from person to person, being HS A the faster and HS B the slower.
3.2 Calcification analysis on FACS Canto flow cytometer
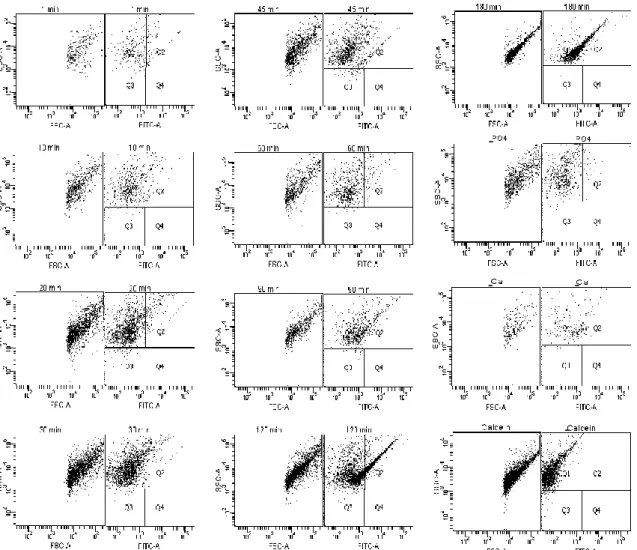
Having the transition time for each serum, the possibility of using flow cytometry to perform the same evaluation was tested. The first assays were done on a FACS Canto. Figures 2, 3 and 4 present the results obtained for FCS and human sera, A and B. Each figure shows forward scatter (FSC), side scatter (SSC) and fluorescence (FITC).
Figure 5 – Calcification propensity analyses on nephelometer: T50 test for FCS (diluted
1:8) and human serum A, B, C, D, E and F. Error bars represent standard deviation. 100 226 202 113 176 189 93 0 50 100 150 200 250 300 HS A HS B HS C HS D HS E HS F FCS 1:8 T50 (m in )
Flow Cytometry Analyses of Calcification Propensity
21
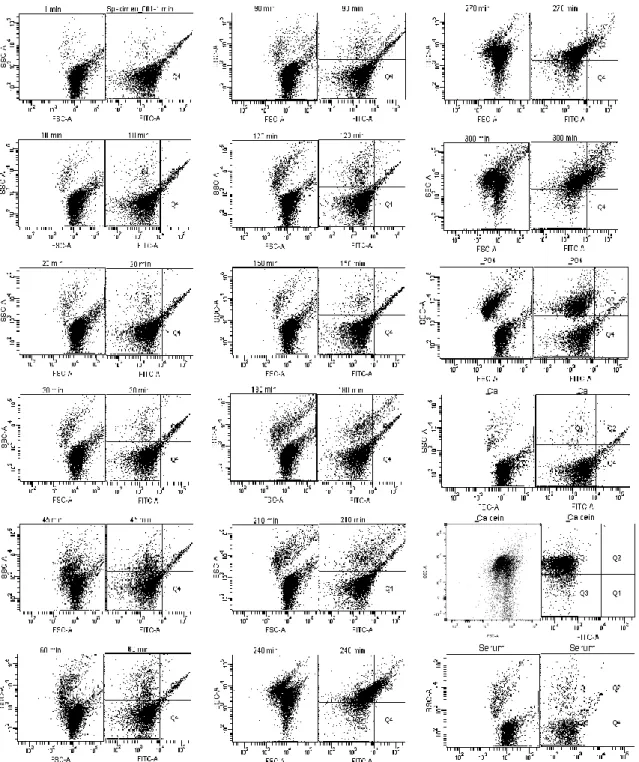
Observing the dot plots from Figure 6 it is easily seen that until minute 90 all samples look similar. From 90 to 120 min, one can see differences between these two dot plots, more events are noticed and they less disperse. With regard to fluorescence it is also possible to see an increase from 90 to 120 min. At 180 min the dot plot is similar to the one recorded at 120 min but the events are even more concentrate. These results could indicate that from 1 to 90 min primary CPPs are detected and from 120 to 180 min secondary CPPs are observable. Thus, the transition from primary to secondary CPPs happened between 90 and 120 minutes. Comparing these results with the ones from Figure 5 it is possible to say that the transition occurred at the same timeframe since, for FCS the T50 determined by nephelometry (Figure 5) was 93 min and on FACS (Figure
1Figure 6) the change occurred between 90 and 120 min. Observing the dot plots from the controls (without CPPs), it is possible to see that the sample without PO4 is similar to
the first ones (until 90 min), the one without Ca is also similar but present less events and
-
--
--
-Figure 6 - Flow cytometry analyses: Calcification propensity for FCS and controls analysed after the CPPs sample: – without PO4; without Ca; without Calcein.
Flow Cytometry Analyses of Calcification Propensity
22
the one without Calcein is similar to the dot plots after the transition except for fluorescence, since it does not have the fluorescence component.
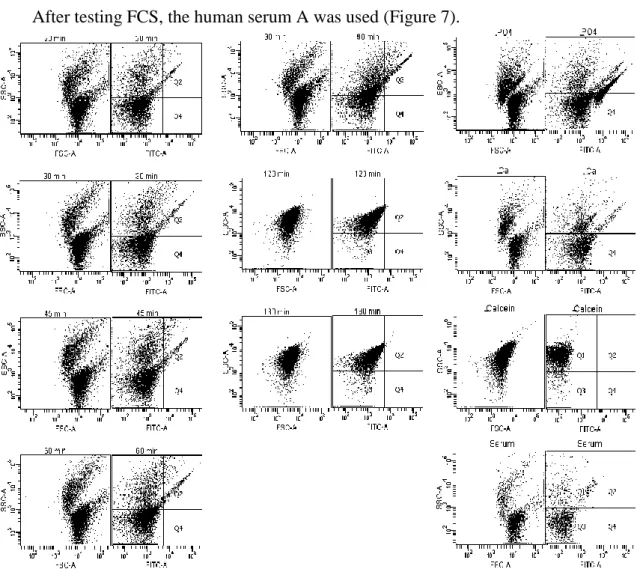
After testing FCS, the human serum A was used (Figure 7).
On this experience it was impossible to analyze the samples from 1 and 10 min. Analysing Figure 7, two different populations of particles were observed up to minute 90. These two populations vary mostly for SSC and FSC values. After 90 min, the two populations are no longer observed. The resultant dot plot has similar values to the higher population of the first time points, relatively to SSC, but higher fluorescence values. The differences observed between 90 and 120 min could indicate the transition from primary to secondary CPPs. These results are in agreement to the T50 from Figure 5. Noticing the
control dot plots, again the samples without PO4, without Ca and only with serum have
- -
- -
- -
Figure 7 - Flow cytometry analyses: Calcification propensity for HS A and controls analysed after the CPPs sample: without PO4; without Ca; without Calcein.
Flow Cytometry Analyses of Calcification Propensity
23
similar results to the ones from primary CPPs but with less events. The sample without Calcein is similar to the dot plots from secondary CPPs but without fluorescence.
Figure 8 summarizes the results for HS B.
Figure 8 - Flow cytometry analyses: Calcification propensity for HS B and controls analysed after the CPPs sample: without PO4; without Ca; without Calcein and only Serum.
- -
- -
Flow Cytometry Analyses of Calcification Propensity
24
Considering Figure 8, again it is observable two different population of particles until 210 min. These two populations differ mostly with regards to SSC values. For this serum, initially the population with higher SSC values have just a few events, which increase as the time advance. After 210 min the two populations seem to merge into one with values similar to the higher population of the first dot plots. The difference observed between 210 and 240 min could indicate the transition from primary to secondary CPPs. The transition at this time matches with the T50 results (Figure 5). Regarding the controls, the
one without PO4 is similar to the primary CPPs, the samples without Ca and with serum only are also similar but with less events. The sample without calcein again is similar to the dot plots after the transition except for the FITC dot plot.
3.3 Calcification propensity analysis on FACS Calibur
Once completed the first set of assays it was necessary to use another flow cytometer, the FACS Calibur (similar to FACS Canto). So for HS C and D the calcification propensity was measured on FACS Calibur. Figures 8 and 9 illustrates the results obtained for these two sera, respectively.
Flow Cytometry Analyses of Calcification Propensity
25
Observing the graphs from Figure 9 b the change associated to the transition of CPPs is well differentiated for SSC, while FSC there is no big difference and for FL the results were maintained. Comparing these results to the ones from the nephelometer, different T50 values are observed, on nephelometer (Figure 5) the transition occurred at 202 min
and on FACS between 90 and 120 min. Relatively to Figure 9 a the samples analysed have low values for FSC and SSC without big differences between the samples; however, for FL1, a difference between the samples with and without calcein is easily observed. On Figure 9 c the FSC does not show any differences with respect to the controls but SSC shows a clear difference between the complete samples and the ones with a component missing for the formation of CPPs. Relatively to fluorescence, samples with calcein have higher values than the one without.
Figure 9 – Flow cytometry analyses: Controls analysed before the CPP sample (a); Calcification propensity for HS C (b); Controls analysed after the CPP sample (c).
a
b
Flow Cytometry Analyses of Calcification Propensity
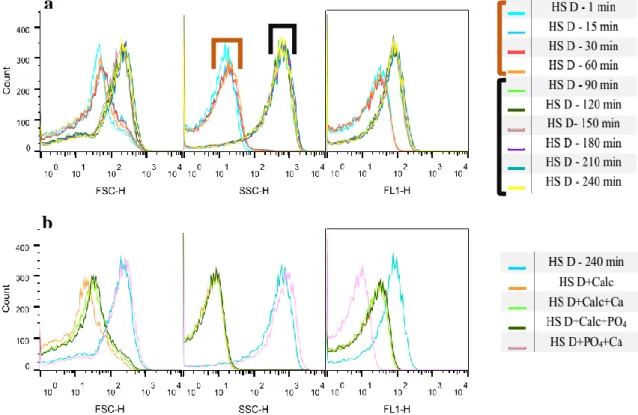
26
Analysing the figure above, in this case the transition point is well defined for the 3 detectors, contrary to the results from HS C, since for FSC, SSC and FL one can see that the transition point occurred between 60 and 90 minutes. The change on the turning point means that these results are slightly different to the ones from the nephelometer (T50 value
for HS D was 113 min (Figure 5)). On Figure 10 b) the samples with all the CPPs components have higher values than the ones without, for forward and side scatter, however in the case of fluorescence, differently from the serum above, has higher fluorescence than the other samples with calcein. The sample with CPPs but without calcein has the lowest value.
3.3.1 Sheath Fluid
During the first experiences it was observed that in some cases a second population of particles was counted on FACS. As the original sheath fluid of the machine had phosphate, this results might be assigned to some of the phosphate of the sheath fluid that reacts with the sample measured. In order to avoid this interference, a new sheath fluid
Figure 10 - Flow cytometry analyses: Calcification propensity for HS D (a); Controls analysed after the CPP sample (b).
a
Flow Cytometry Analyses of Calcification Propensity
27
was tested: 140 mM NaCl + 50 mM Hepes. All the results presented henceforward were obtained using this new fluid.
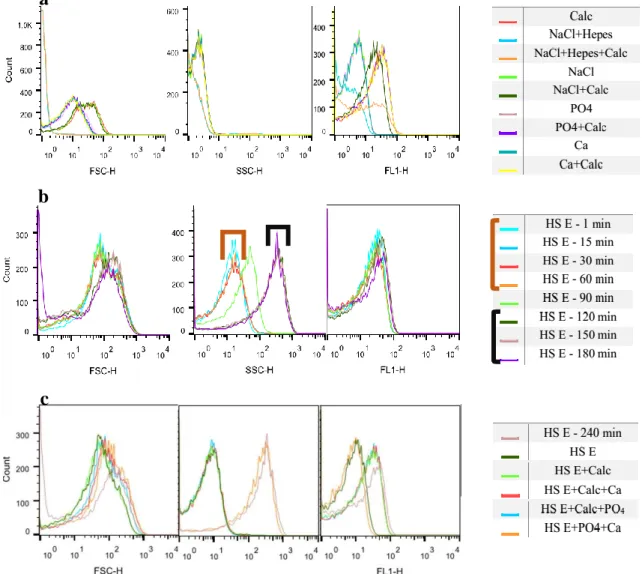
Figures 11 and 12 shows the histograms obtained for HS E and HS F: a) shows the controls measured before the CPP sample; b) the CPP sample and c) the controls measured after the CPPs.
Figure 11 - Flow cytometry analyses: Controls analysed before the CPPs sample (a); Calcification propensity for HS E (b); Controls analysed after the CPPs sample (c).
a
b
Flow Cytometry Analyses of Calcification Propensity
28
In this case, once more it is only possible to define the time were the change occurred for SSC (Figure 11 b). This transition happened 90 min after the mixing. Comparing to the T50 from Figure 5, the values obtained are different since on nephelometer the change
happened at 176 min. Analysing Figure 11 a) it is possible to say the values for forward and side scatter are different from those of the samples with CPPs. The fluorescence histogram again shows differences between samples with and without calcein. On Figure 11 c) forward scatter shows no differences between different samples, however SSC shows clearly a difference between samples with and without CPPs. FL 1 presents differences between samples with and without calcein.
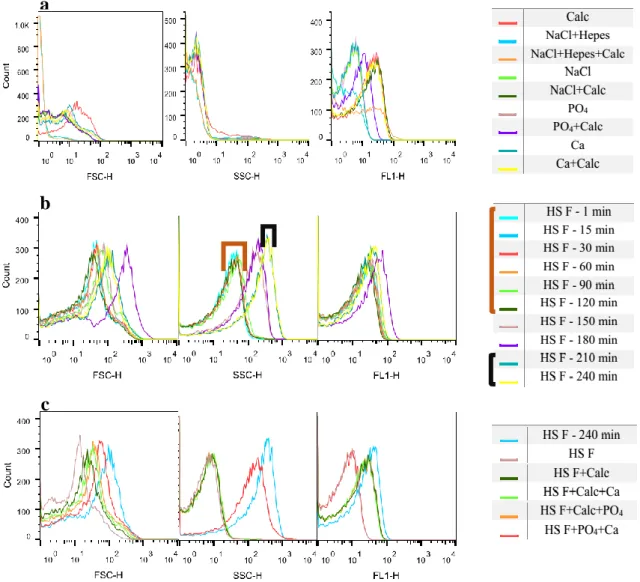
Analysing these results once again one can see a well defined change for side scatter. Observing the side scatter histogram (Figure 12 b), it seems the transition was longer,
Figure 12 - Flow cytometry analyses: Controls analyzed before the CPPs sample (a); Calcification propensity for HS F (b); Controls analyzed after the CPPs sample (c).
a
b
Flow Cytometry Analyses of Calcification Propensity
29
since until 120 minutes primary CPPs are observed and only after 180 minutes the sample is stabilized. The results from Figure 5 show that the transition to secondary CPPs happened at 189 min, similarly to these results. In Figure 12 a) for forward and side scatter there are no differences between the samples analysed, however for fluorescence again it is possible to differentiate samples with and without calcein. The forward scatter from Figure 12 c) does not allow to make conclusions, side scatter shows a difference between samples with and without CPPs. Fluorescence again is higher for the samples with the fluorescence component – calcein.
3.4 Calcification propensity analysis
As described above on some sera the results obtained on FACS weren’t according to the ones from the Nephelometer. To determine if the discrepancies observed on some sera could be associated to the FACS Calibur used in the trial, HS A was tested at same time on the Nephelometer and on both FACS. The results obtained are presented ahead.
3.4.1 Nephelometer Analyses
Figure 13 illustrates the T50 from Nephelometer for 3 different days.
Figure 13 – Calcification propensity analyses on Nephelometer: T50 test for human serum
A on 3 days. Error bars represent standard deviation. One way ANOVA was used to test statistical significance. 78 76 116 0 20 40 60 80 100 120 140
Flow Cytometry Analyses of Calcification Propensity
30
As is observable the first and second days have similar values – 78 and 76 min respectively - however on third day the T50 is higher – 116 min. In fact, the value from
the third day is significantly different from the other two days (p>0,05).
3.4.2 FACS Calibur Analyses
Figures 14, 15 and 16 shows the results from FACS Calibur for the three days. a) represents the controls analysed before the CPPs sample; b) the sample with CPPs for different time points and c) the controls analysed after the CPPs sample.
Observing Figure 14 a) it is possible to see that the results are similar those obtained with the controls measured on the previous assays. For FSC and SSC it is difficult to differentiate the samples and for FL-1 it is possible to distinguish those with
Figure 14 - Flow cytometry analyses: Controls analyzed before the CPPs sample (a); Calcification propensity for HS A (b); Controls analyzed after the CPPs sample (c).
a
b
Flow Cytometry Analyses of Calcification Propensity
31
calcein from the ones without. Figure 14 b) shows that the transition happened between 60 and 90 min, corroborating the results from the T50. This is easier to see on the side
scatter histogram. The controls measured at the end of the assay (Figure 14 c) show that, for FSC and SSC, there is a difference between samples containing CPPs and those with one component missing. In case of fluorescence the samples without calcein have the lowest values while the sample with CPPs and calcein has the higher one.
Figure 15 a) again present similar results. For FSC and SSC all the samples have similar values but for fluorescence it is possible to distinguish those with and without calcein. Figure 15 b shows, for side scatter, that the transition for HS A on the second day happened again between 60 and 90 min. FSC and FL1 does not present real differences
Figure 15 - Flow cytometry analyses: Controls analyzed before the CPPs sample (a);
Calcification propensity for HS A (b); Controls analyzed after the CPPs sample (c).
a
b
Flow Cytometry Analyses of Calcification Propensity
32
among the different samples. Analysing the histograms of Figure 15 c it is possible to see that samples with CPPs have higher values than the ones without (FSC and SSC). In case of the fluorescence laser it is possible to distinguish the samples who have calcein from the ones without.
Figure 16 a) maintained the results observed on the previous assays; FSC present some differences among samples but all the values are low. SSC does not present many differences and in case of FL1 it is possible to distinguish the samples with and without calcein. Relatively to the CPPs (Figure 16 b) on this day the T50 was different from the
previous. On this day happened between 120 and 150 minutes, these results are according to the ones from Figure 13. This transition is better seen for side scatter once for forward scatter the transition isn’t so clear and the fluorescence was maintained through time. On histograms from Figure 16 c), in case of FSC, the samples without CPPs have the lowest
Figure 16 - Flow cytometry analyses: Controls analyzed before the CPPs sample (a); Calcification propensity for HS A (b); Controls analyzed after the CPPs sample (c).
a
b
Flow Cytometry Analyses of Calcification Propensity
33
values, but contrary to the previous assays the sample with CPPs but without calcein is different from the one with everything. For SSC it is possible to see a separation between the samples with and without CPPs. For FL1 there is a difference between sample with and without the fluorescence component.
3.4.3 FACS Canto Analyses
Figure 17 and 18 shows the results from FACS Canto for days one and two, unfortunately on the third day the FACS had some mal function making impossible to analyse the sample on this equipment. Figure a) represents the controls analysed before the sample; b) the sample for different time points and c) the controls at the end of the assay.
Figure 17 - Flow cytometry analyses: Controls analysed before the CPPs sample (a); Calcification propensity for HS A (b); Controls analysed after the CPPs sample (c).
a
b
Flow Cytometry Analyses of Calcification Propensity
34
Figure 17 a) shows that for FSC and SSC all the samples have similar results except the samples with NaCl+Hepes and NaCl+Hepes+Calcein. For FSC these samples have less events than the others and for SSC have also less events but with higher values. In case of fluorescence the samples without calcein has lower values but more events. On Figure 17 b) it is only possible to observe the transition step for side scatter, and as on nephelometer and FACS Calibur it happened between 60 and 90 min. on Figure 17 c) for FSC there is no big differences between the samples, however for SSC it is possible to see differences between samples with and without CPPs. In case of fluorescence the samples with calcein have less events but have higher values.
Figure 18 - Flow cytometry analyses: Controls analysed before the CPPs sample (a); Calcification propensity for HS A (b); Controls analysed after the CPPs sample (c).
a
b
Flow Cytometry Analyses of Calcification Propensity
35
Figure 18 a) shows no big differences among the samples for FSC, in case of SSC the only samples that differ are the one with NaCl+Hepes and NaCl+Hepes+Calcein. On FITC the samples without calcein have the same values, the ones with have less events and NaCl+Hepes+Calcein and NaCl+Calcein have higher values. On Figure 18 b) it is only possible to observe the transition step for side scatter, which occurred after 60 min, the same as the T50 for the Nephelometer and the FACS Calibur. On Figure 18 c), for FSC
the samples have similar values but for SSC it is possible to differ the samples with CPPs from the ones without. In case of FITC it is seen differences between samples with calcein and without.
3.5 Influence of Calcein
Since different results were observed between the initial T50 test (Figure 5) and the
following experiences, a new T50 was determined as to compare samples with and without
calcein, since this was the only variable component in these experiences.
As it is possible to observe on Figure 19 calcein has no influence on the propensity calcification of all sera analysed (p>0,05), once the T50 for the samples with calcein or
with NaCl were similar.
126 93 70 84 225 293 131 99 71 85 223 296 0 50 100 150 200 250 300 350 HS F HS C HS D HS E HS H HS G NaCl Calcein
Figure 19 – Calcification propensity analyses on nephelometer (T50 test): Influence of
calcein on the calcification propensity of human serum C, D, E, F, G and H. Error bars represent standard deviation. Student’s t-test was used to test for statistical significance.
Flow Cytometry Analyses of Calcification Propensity
36
3.6 Influence of temperature
After measuring in FACS the propensity of calcification at body temperature, the influence of this parameter in the formation of Calciproteins was tested. For that purpose, FCS was tested at 37 ºC and 50 ºC and human serum G at 37 ºC, 45 ºC and 55 ºC. Besides FACS and Nephelometer, the samples from HS G were also observed on TEM.
3.6.1 FCS
Figures 20 and 22 presented the FACS results obtained for FCS at 37 ºC and 50 ºC respectively: a) shows the controls measured before the CPPs; b) shows the CPPs analysed for different time points and c) the controls measured after the CPPs. The T50
used to compare the results at 37 ºC was the one from Figure 5 (93 min). Figure 20 shows the T50 at 50 ºC.
Figure 20 - Flow cytometry analyses at 37 ºC: Controls analysed in the beginning of the assay (a); Calcification propensity for FCS (b); Controls analysed in the end of the assay (c).
a
b
Flow Cytometry Analyses of Calcification Propensity
37
On Figure 20 a), for FSC it is seen that the samples have different values, being Calcein and NaCl+ Hepes+Calcein the lowest. For SSC again the values are really low and there are not big differences among the samples. For FL1 it is possible to distinguish the samples with and without calcein, except for the one with calcein only - similar values to the samples without calcein - and the one with NaCl+Hepes - similar to the samples with calcein. Figure 20 b) only shows the transition from primary to secondary CPPs on side scatter, which happened after 60 min. FSC and FL1 does not present big alterations among the different samples. On Figure 20 c) the FSC histogram does not reveal big differences, however SSC shows a separation between the samples with and without CPPs. The fluorescence histogram presents differences between samples with and without calcein.
Figure 21 shows the result obtained overtime during the analysis of FCS on the nephelometer at 50 ºC
Figure 21 - Calcification propensity analyses on nephelometer: for FCS at 50 ºC.
Observing this result, we can see that for the initial thirty minutes the values are stable, between 30 and 40 min an increase of the signal is observed, reflecting the transition from primary to secondary CPPs. Afterwards the values stabilize again. The T50, one-half maximal transition time, – is therefore identified on Figure 20. Comparing
max ½ max
Flow Cytometry Analyses of Calcification Propensity
38
the T50 value at 50 ºC (34 min), with the one obtained at 37 ºC (93 min), using the same
FCS, one can see that the temperature decreased the T50 value.
Figure 22 illustrates the results obtained for FCS at 50 ºC.
Looking at Figure 22 a) SSC histogram shows that all the samples have similar low values. On FL1 it´s possible to differentiate the samples with and without calcein. Worth noticing on Figure 22 b), the values for FSC are in disagreement with SSC and FL1; in the late cases the transition happened after 10 min, but FSC shows higher values for the first 40 min. None of these values matches with the results from the nephelometer. Observing Figure 22 c), for SSC, the samples with CPPs have higher values than the ones
Figure 22 - Flow cytometry analyses at 50 ºC: Controls analysed before the CPPs sample (a); Calcification propensity for FCS (b); Controls analysed after the CPPs sample (c).
a
b
Flow Cytometry Analyses of Calcification Propensity
39
without. For FL1 it is possible to see a difference between samples with and without calcein, except the sample with FCS+Calc+PO4 that presents negative results for
fluorescence but has Calcein.
3.6.2 Human Serum
The influence of temperature was also tested for HS G. On Figures 23, 26 and 29 the results obtained on Nephelometer at 37 ºC, 45 ºC and 55 ºC respectively, are represented. Figure 24, 27 and 30 show the corresponding histograms obtained for the same temperatures. Finally, Figures 25Figure 25, 28 and 31 show the images from microscopy.
.
Observing Figure 23 it is possible to conclude that the T50 was approximately at 140
min.
Figure 24 a) illustrates the controls analysed before the CPPs; Figure 24 b shows the CPPs for the different time points and Figure 24 c represents the results obtained for the controls analysed after the CPPs.
Figure 23 - Calcification propensity analyses on nephelometer: HS G at 37 ºC.
max
½ max
Flow Cytometry Analyses of Calcification Propensity
40
Figure 24 a) does not present big differences between the samples except for fluorescence histogram where is possible to distinguish the samples with calcein from the ones without. On Figure 24 b) the transition step – between 120 and 150 min - is only perceptible for SSC once for FSC and FL1 the samples maintained the values. On Figure 24 c), the FSC histogram shows differences between the samples with and without CPPs. For SSC it is also possible to differ these samples however one of the samples without CPPs has an intermediate value. In case of fluorescence samples with and without calcein present different results.
Figure 24 - Flow cytometry analyses at 37 ºC: Controls analysed in the beginning of the assay (a); Calcification propensity for HS G (b) Controls analysed in the end of the assay (c).
a
b
Flow Cytometry Analyses of Calcification Propensity
41
Figure 25 shows the images from TEM for 1 min (a), 150 minutes (b), 180 minutes (c) and 270 minutes (d).
Figure 25 – Representative scanning electronic microscopy photographs of CPP Sample at 37 ºC: 1 min (a); 150 min (b); 180 min (c); and 270 min (d). All images were viewed at 100000 magnification.
Observing the images is possible to verify that initially we have primary CPPs, small and round. At 150 minutes, after the change occurred, the CPPs become bigger and have an elongated shape. For the last two pictures, despite in FACS and Nephelometer slight differences were observed, the shape of the CPPs was maintained.
Figure 26 illustrates human serum G CPP sample analysed on nephelometer, from 1 min until 200 min, at 45 ºC.
Analysing Figure 26 the transition from primary to secondary CPPs cans be identified around 71 min.
max
½ max
T50
A
B
C
D
Flow Cytometry Analyses of Calcification Propensity
42
Figure 27 a) represents the CPPs analysed for the time points and b) the controls measured after.
On Figure 27 a) the FSC histogram shows similarities for all the samples except for the 1 min sample, who has higher value. For SSC it is possible to determine the transition point, between 60 and 80 min, again the sample from 1 min had a strange curve, between the samples from primary and secondary CPPs. The fluorescence was maintained for all the samples. On Figure 27 b), for FSC and SSC, it is possible to distinguish samples with CPPs from the ones without. On case of SSC the sample without PO4 has an intermediate
value. The fluorescence histogram shows differences between the samples with and without calcein.
For 45 ºC it was observed on TEM (Figure 28) samples from the first time point (1 min) - A, the times were occurred the change (80 minutes) - B and from the last time point measured (200 minutes) - C. In this case the time immediately before the change, 60 minutes, it was also dialyzed but it was impossible to observe at TEM.
Figure 27 - Flow cytometry analyses at 45 ºC: Controls analysed in the beginning of the assay (a); Calcification propensity for HS G (b) Controls analysed in the end of the assay (c).
a
Flow Cytometry Analyses of Calcification Propensity
43
Observing the images is possible to verify that initially we have primary CPPs, the CPP’s are small and round. At 80 minutes, after the transition step, it is easy to see a difference from the first image. In this image the CPPs are bigger and have an elongated shape. For the last time point the CPPs were similar.
Figure 29 shows the results obtained on nephelometer at 55 ºC.
Noting Figure 29 it is possible to conclude the T50 is approximately 15 min. Figure 29 - Calcification propensity analyses on nephelometer: HS G at 55 ºC. Figure 28 - Representative scanning electronic microscopy photographs of CPP Sample at
45 ºC: 1 min (A); 80 min (B); and 200 min (C). All images were viewed at 35970 magnification.
A
B
C
T50
½ max max