UNIVERSIDADE DE LISBOA
FACULDADE DE CIÊNCIAS
DEPARTAMENTO DE BIOLOGIA ANIMAL
Combined effects of climate change and
methylmercury exposure on the
ecophysiology of juvenile meagre
Mestrado em Ecologia Marinha
Sofia dos Reis Alves e Dias Francisco
Dissertação orientada por:
Professor Doutor Rui Rosa
(Universidade de Lisboa, Faculdade de Ciências, Departamento de Biologia Animal)
Doutor António Marques
(IPMA – Instituto Português do Mar e da Atmosfera)
ii
This work was presented in the following scientific
meetings
Francisco, S.; Pimentel, M. S.; Paula, J.R; Rosa, I.; Madeira, V.; Repolho, T.; Marques, A.; Rosa, R.
Combined effects of climate change and methylmercury exposure on marine fish ecophysiology.
23-27th March 2015
Third International Symposium on Effects of Climate Change on the World's Oceans Santos City, Brazil
Francisco, S.; Maulvault, A.L.; Pimentel, M. S.; Lopes, A. R.; Paula, J.R.; Rosa, I; Madeira, V.; Repolho, T.; Marques, A.; Rosa R.
Impact of methylmercury exposure on marine fish ecophysiology under ocean warming and acidification.
3-7th May 2015
SETAC Europe 25th Annual Meeting Barcelona. Barcelona, Catalonia, Spain
iii
Acknowledgements
I owe my gratitude to all those people who have made this dissertation possible.
Firstly, I would like to express my sincere gratitude to Dr. Rui Rosa, for accepting me as his student and for believing in me, for all your supervision, support, enthusiasm, and immense knowledge that made this thesis possible.
I would like to thank to Dr. António Marques, for accepting to co-supervise this work and for all the help, support and encouragement provided.
I am thankful to Marta Pimentel for helping me through my first steps in this thesis, Ana Rita Lopes for all her teachings in the laboratory and support and José Paula for all the help and advices throughout this work. Their companionship, encouragement and support were very important for this dissertation. I also have to thank Tiago Repolho, Vanessa Madeira e Inês Rosa who also helped me during this work.
I would like to thank to all my colleagues from Laboratório Marítimo da Guia for the good moments, their sympathy and friendship, which made this work a better experience. I also want to thank IPMA’s team for receiving me so well, in particularly, Ana Luísa Maulvault for the companionship and Ricardo for all the help during my work there. I would like to thank to all of my dearest friends that helped me stay positive through this year, especially to Carolina, Inês, Vanessa and Steven, for listening, caring and always showing support.
I also want to thank to my family for all the support they provided me through my entire life, without them, I wouldn’t be here.
Lastly, I have to thank to Gonçalo, without his love, encouragement and support, I would not have finished this thesis.
iv
Resumo
Na época pré-industrial as concentrações de dióxido de carbono (CO₂) atmosférico eram aproximadamente 280 ppm e atualmente excedem os 390 ppm. É estimado que no ano 2100 as concentrações de CO₂ atmosférico cheguem aos 420 a 940 ppm. Este aumento tem provocado um aumento global da temperatura dos oceanos, que até 2100 é esperado aumentar entre 0,3 °C e 4,8 °C, especialmente nas zonas costeiras. Este aquecimento afetará a performance dos animais marinhos em diferentes estados do ciclo de vida através de mudanças na sua fisiologia.
Simultaneamente, os oceanos estão a absorver CO₂, alterando o seu balanço químico, causando uma diminuição no pH dos oceanos e provocando assim, a acidificação dos oceanos. Desde a época pré-industrial, o pH da superfície do oceano diminuiu cerca de 0,1 unidades e é esperado que diminua entre 0,13 a 0,42 unidades até 2100. No entanto, estes valores poderão ser mais elevados em zonas costeiras. Esta acidificação irá afetar diversos organismos como bivalves e peixes. Uma das alterações que este aumento de CO₂ poderá envolver nos peixes é um dispêndio energético acrescido para acomodar as necessárias adaptações fisiológicas.
Além do aquecimento e acidificação dos oceanos, os organismos marinhos têm ainda que lidar com outro fator de stress existente: a contaminação. Os ecossistemas marinhos estão a ser contaminados com diversos compostos tóxicos, como os metais. Um destes metais é o mercúrio que é libertado para o ambiente através de fontes naturais ou antropogénicas. Depois da revolução industrial, as emissões de mercúrio antropogénico aumentaram drasticamente e as previsões apontam para a continuação deste aumento. Atualmente as emissões de mercúrio são maioritariamente de origem antropogénica e parte das mesmas são depositadas no oceano. A transformação de mercúrio em metilmercúrio ocorre através de bactérias existentes nos sedimentos. O metilmercúrio bioacumula em organismos aquáticos e biomagnifica ao atravessar os diferentes níveis tróficos, aumentando assim a sua toxicidade e chegando a níveis muito elevados nos organismos que ocupam o topo da teia trófica. Para além disso, pode causar efeitos adversos nos peixes, como por exemplo, alterar a performance reprodutiva, aumentar o stress oxidativo e alterar a atividade enzimática do sistema nervoso central.
Os organismos marinhos terão de lidar com os efeitos do aquecimento, acidificação e contaminação dos oceanos simultaneamente. No entanto, pouco se sabe sobre as interações entre estes fatores nos seres vivos. Alguns estudos mostram que os impactos das alterações climáticas nas espécies marinhas podem ser agravados pela
v poluição e que as interações entre a temperatura e a poluição por metais influencia a tolerância fisiológica de animais aquáticos ectotérmicos. Além disso, a acidificação do oceano também pode intensificar a toxicidade dos metais.
Com o objetivo de avaliar as respostas biológicas de corvinas juvenis (Argyrosomus regius), em relação à exposição ao aquecimento dos oceanos (+ 4 ºC) e acidificação (ΔpH = 0,5 unidades) e ao MeHg (8.02 mg kg⁻¹ dw), foi determinado o impacto combinado destes fatores sobre o índice de condição de Fulton, grau de encefalização, níveis de acetilcolinesterase, resposta ao choque térmico, peroxidação lipídica e atividade das enzimas antioxidantes. É importante referir que A. regius é um peixe resistente e pode facilmente adaptar-se às alterações ambientais, no entanto, esta espécie é encontrada em zonas costeiras e estuários, especialmente na fase juvenil, onde é expectável que as alterações climáticas irão ter maior impacto no futuro. Sendo a corvina um peixe de elevado valor comercial, é importante avaliar os efeitos futuros que estes fatores de stress terão sobre esta espécie.
Os resultados indicam que o aquecimento, a acidificação e a contaminação de mercúrio promovem diversas alterações fisiológicas. A bioacumulação de mercúrio foi afectada principalmente pelo aumento da temperatura, sendo o fígado o tecido que acumulou mais mercúrio. No entanto, não ocorreram diferenças na taxa de sobrevivência e na condição de Fulton. Relativamente à taxa de encefalização, apenas foram observadas alterações nos organismos sujeitos a aquecimento e hipercapnia, onde o tronco cerebral aumentou sob a condição de aquecimento e pH atual.
Foi observado um aumento em ambas as condições controlo de temperatura (18ºC) e pH (8.0) na resposta das proteínas de choque térmico. No entanto, ocorreu uma diminuição significativa destas proteínas, sob condições de aquecimento e hipercapnia. Em oposição, os níveis de malondialdeído observados não mostraram diferenças significativas entre os tratamentos. Relativamente às enzimas de stress oxidativo, a atividade da glutationa S-transferase (GST) não se alterou com a contaminação, mas o aquecimento provocou um aumento na atividade de GST. Sob contaminação, a GST apresentou níveis mais elevados nos organismos provenientes do tratamento controlo (temperatura e pH) quando comparado com os organismos do tratamento de aquecimento e hipercapnia. A atividade da catalase não apresentou diferenças significativas nos organismos dos tratamentos não contaminados, mas com a contaminação a enzima aumentou nos peixes sujeitos à temperatura controlo e hipercapnia. Por último, a atividade da superóxido dismutase (SOD) não apresentou diferenças nos peixes dos tratamentos não contaminados, mas apresentando níveis mais elevados nos organismos sujeitos a contaminação no tratamento de temperatura controlo e hipercapnia.
vi Este estudo parece indicar que a corvina conseguirá adaptar-se às condições climáticas expectáveis no futuro em ambientes contaminados com MeHg. O aquecimento será o fator que mais afetará a acumulação de mercúrio na corvina e algumas variáveis irão ser afetadas pela contaminação. Embora a corvina tenha sofrido algumas alterações a nível fisiológico, estas não foram nocivas para o peixe. Em conclusão, estes resultados indicam, que a corvina poderá adaptar-se às futuras condições climáticas mesmo sob contaminação de mercúrio.
Palavras-chave:
Corvina, alterações climáticas, mercúrio, bioacumulação, encefalização, neurotransmissão colinérgica, stress oxidativo.
vii
Abstract
The increase in anthropogenic carbon dioxide (CO₂) in the atmosphere is leading to higher ocean temperature and lower pH. At the same time, mercury released into the environment is also a fact, being deposited in the ocean. Thus, marine animals are being challenged by ocean warming, acidification and contamination simultaneously. However, their biological and physiological responses to these environmental changes still remain unknown. This study evaluated meagre (Argyrosomus regius) responses to the effects of ocean warming (+4ºC), acidification (ΔpH = 0.5 units) and MeHg exposure (8.02 mg kg⁻¹ dw), on Fulton condition index, degree of encephalization, acetylcholinesterase (AChE) levels, heat shock response (HSR), lipid peroxidation [malondialdehyde (MDA) concentration] and antioxidant enzyme activities [glutathione S-transferase (GST), catalase and superoxide dismutase (SOD)]. Temperature was the factor leading to an increase of MeHg accumulation in meagre. Survival and Fulton condition were not affected by any of the factors. Encephalizaton coefficient was only affected under the warming and hypercapnia non-contaminated treatment and only brain stem increased in response to warming. Moreover, AChE was only influenced under contaminated treatments. HSR only varied in muscle tissue and was mostly affected by warming treatments (non-contaminated and contaminated). In contrast, MDA levels were not influenced by warming, hypercapnia or contamination. GST increased under the warming non-contaminated treatment. Catalase was higher in samples from the contaminated hypercapnia treatment compared to the corresponding non-contaminated treatment, whereas SOD reached higher levels under the hypercapnia contaminated treatment. The present study shows that meagre will not suffer major consequences under predicted future ocean contaminated conditions. Although meagre suffered physiological alterations under these conditions, these responses were not harmful for the fish. These results suggest that meagre will be able to adapt to the predicted future ocean conditions even under mercury contamination. However, future studies will be necessary to comprehensively understand how marine biota will respond to the combined effects of future warming, acidification and pollution
Keywords:
Meagre, climate change, mercury, bioaccumulation, encephalization, cholinergic neurotransmission, oxidative stress
viii
Table of contents
Acknowledgements ... iii Resumo ...iv Palavras-chave: ...vi Abstract ... vii Keywords: ... viiList of figures and tables ... x
1. Introduction ... 1 1.1. Global warming ... 1 1.2 Ocean acidification ... 2 1.3 Mercury contamination ... 3 1.4 Synergisms ... 4 1.5 Stress biomarkers ... 5 2. Objectives ... 7
3. Material and methods ... 8
3.1. Collection of specimen and incubation ... 8
3.2. Diet ... 9
3.3. Total mercury and methylmercury accumulation ... 10
3.4. Survival and Fulton condition ... 11
3.5. Brain sampling ... 11
3.6. Acetylcholinesterase (AChE) activity ... 12
3.7. Heat shock response, lipid peroxidation and antioxidant enzyme activities .... 12
3.7.1. Preparation of tissue extracts: ... 12
3.7.2. Heat shock proteins ... 13
3.7.3. Lipid peroxides assay (malondialdehyde concentration)... 13
3.7.4. Glutathione S-Transferase (GST) activity ... 14
3.7.5. Catalase (CAT) activity ... 15
3.7.6. Superoxide dismutase (SOD) activity ... 15
3.8. Statistical analyses ... 16
4. Results ... 17
4.1. Total mercury accumulation ... 17
ix
4.3. Macro areas coefficient... 20
4.4. Brain macro areas acetylcholinesterase activity ... 22
4.5. Heat shock response and lipid peroxidation... 25
4.6. Antioxidant enzymes activities ... 27
5. Discussion ... 29
5.1. Total mercury accumulation ... 29
5.2. Fulton condition and survival ... 30
5.3. Encephalization ... 30
5.4. Brain macro areas ... 31
5.5. Acetylcholinesterase (AChE) activity ... 32
5.6. Oxidative stress ... 33
6. Final remarks ... 36
References ... 37
x
List of figures and tables
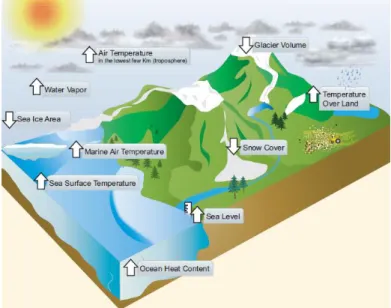
Figure 1. Components of the climate system that would be expected to change in a
warming world exhibit trends consistent with warming (arrow direction denotes the sign of the change) (IPCC, 2013). ... 1
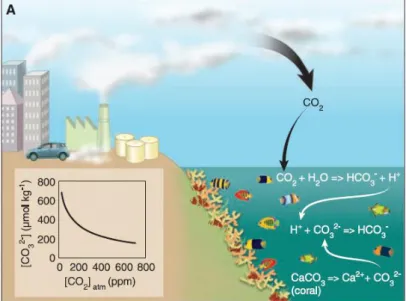
Figure 2. Linkages between the buildup of atmospheric CO₂ and the slowing of coral
calcification due to ocean acidification (Hoegh-Guldberg et al., 2007). ... 2
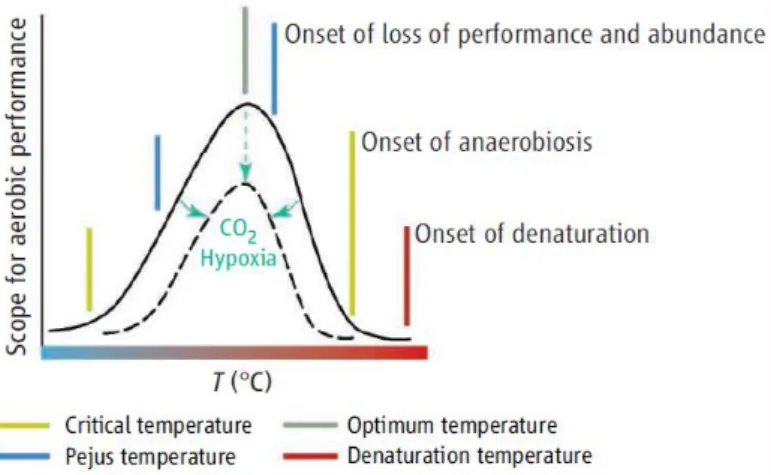
Figure 3. Temperature effects on the thermal windows of aerobic performance on
aquatic animals. Synergistic stressors like ocean acidification (by CO₂) narrow thermal windows (Pörtner and Farrell, 2008). ... 3
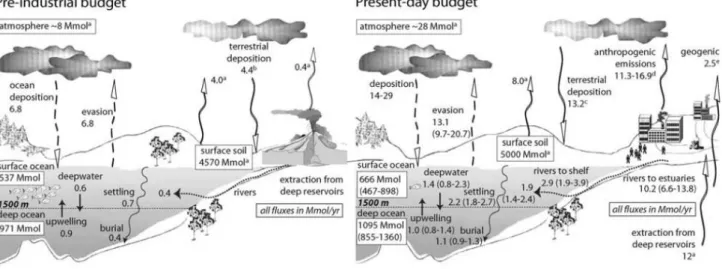
Figure 4. Global budgets for preindustrial and current mercury cycling in oceans
(Sunderland and Mason, 2007). ... 4
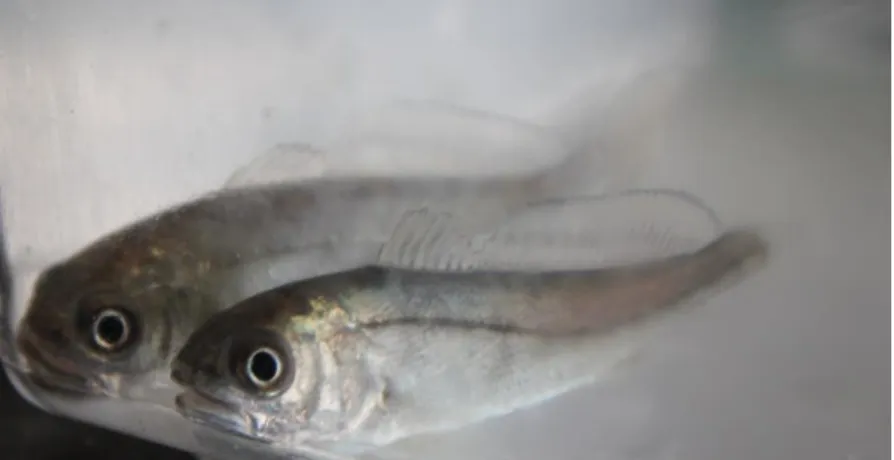
Figure 5. Meagre (Argyrosomus regius). ... 8
Figure 6. Fish brain macro areas: telencephalon, optic tectum, cerebellum,
diencephalon and brainstem (Gonçalves et al., 2008) ... 11
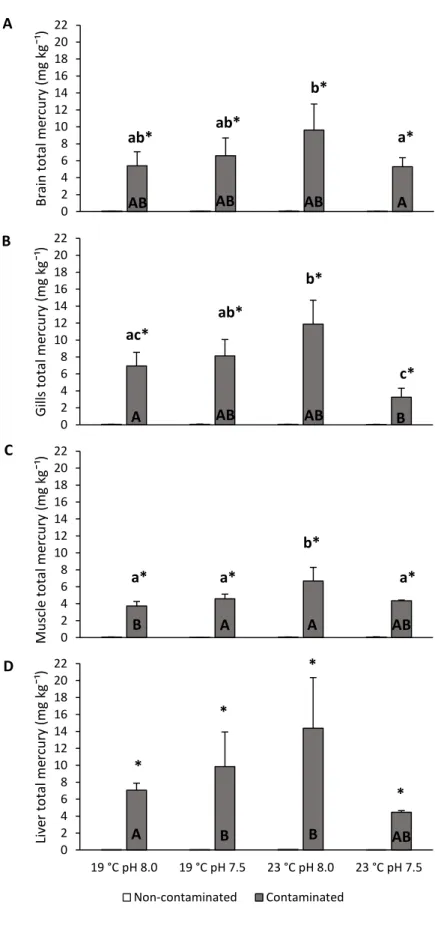
Figure 7. Impact of ocean acidification (∆pH 0.5) and warming (+4 °C) on total mercury
accumulation on A) brain B) gills, C) muscle and D) liver of juvenile meagre (Argyrosomus regius) exposed to methylmercury for 30 days. Values represent mean+s.d. Small letters represent statistical differences among treatments in the same contamination condition. Asterisk represents significant differences between contaminated and non-contaminated treatments in each temperature and pH condition. Capital letters represent significant differences between tissues in the same treatment. ... 18
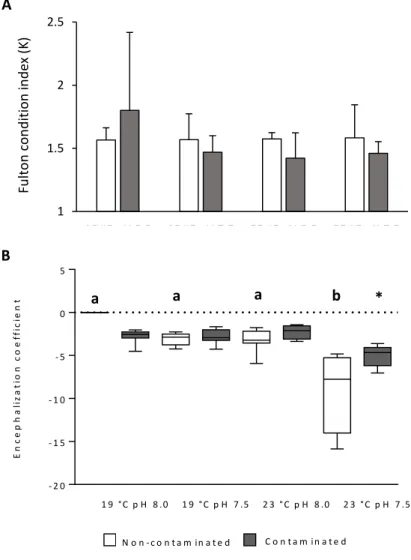
Figure 8. Impact of ocean acidification (∆pH 0.5), warming (+4 °C) and methylmercury
contamination on A) Fulton condition index and B) the encephalization coefficient of juvenile meagre (Argyrosomus regius). Values represent mean+s.d. Different letters represent statistical differences among treatments in the same contamination condition. Asterisk represents significant differences between contaminated and non-contaminated treatments in each temperature and pH condition. ... 19
Figure 9. Impact of ocean acidification (∆pH 0.5), warming (+4 °C) and methylmercury
contamination on macroareas coefficient between the five areas of the brain A) telencephalon, B) optic tectum, C) diencephalon, D) cerebellum and E) brain stem of juvenile meagre (Argyrosomus regius). Values represent mean+s.d. Small letters represent statistical differences among treatments in the same contamination condition.
xi Asterisk represents significant differences between contaminated and non-contaminated treatments in each temperature and pH condition. ... 21
Figure 10. Impact of ocean acidification (∆pH 0.5), warming (+4 °C) and methylmercury
contamination on the acetylcholinesterase activity on the five areas of the brain A) telencephalon, B) optic tectum, C) diencephalon, D) cerebellum and E) brain stem of juvenile meagre (Argyrosomus regius). Values represent mean+s.d. Small letters represent statistical differences among treatments in the same contamination condition. Asterisk represents significant differences between contaminated and non-contaminated treatments in each temperature and pH condition. Capital letters represent significant differences between tissues in the same treatment. ... 24
Figure 11. Impact of ocean acidification (∆pH 0.5), warming (+4 °C) and methylmercury
contamination on HSP in A) gills, B) muscle and C) liver and on D) muscle MDA concentration in juvenile meagre (Argyrosomus regius). Values represent mean+s.d. Small letters represent statistical differences among treatments in the same contamination condition. Capital letters represent significant differences in HSP between tissues in the same treatment... 26
Figure 12. Impact of ocean acidification (∆pH 0.5), warming (+4 °C) and methylmercury
contamination in the A) GST activity, B) Catalase activity and C) SOD activity in the muscle tissue of juvenile meagre (Argyrosomus regius). Values represent mean+s.d. Different small letters represent statistical differences among treatments in the same contamination condition. Asterisk represents significant differences between contaminated and non-contaminated treatments in each temperature and pH condition. ... 28
Table 1. Composition of the two diets (i.e. dry inert pellets) used for juvenile meagre
feeding... 9
Table 2. Total mercury and methylmercury concentrations in the non-contaminated and
contaminates feed ... 10
Table 3. Laboratory performance on standard reference materials for total mercury and
1
1. Introduction
1.1. Global warming
In the preindustrial era the atmospheric carbon dioxide (CO₂) concentrations were approximately 280 ppm (Caldeira and Wickett, 2003; IPCC, 2013) and are now exceeding 390 ppm (IPCC, 2013). By the year 2100, it is expected that atmospheric CO₂ concentrations reach values between 420 and 940 ppm, depending on the emissions scenario (IPCC, 2014). This increase in CO₂ (and other greenhouse gases) is causing a rise in temperature and therefore global warming (IPCC, 2013) (Fig. 1). Researchers predict a temperature rise between 0.3 °C to 4.8 °C by the year 2100 (IPCC, 2013). Sea surface temperature (SST) has significantly warmed during the past 30 years and it is predicted that will continue to increase, especially in coastlines (IPCC, 2014). Warming affects the performance of marine organisms at different stages in their life history through changes in physiology, morphology and behavior (Harley et al., 2006). Species with ample thermal windows, short generation times and a range of genotypes in populations will be favored under warming conditions (Pörtner and Farrell, 2008). Ultimately, species thermal tolerance and adaptability will determine the distribution and abundance of species under these conditions (Harley et al., 2006).
Figure 1. Components of the climate system that would be expected to change in a warming world exhibit trends consistent with warming (arrow direction denotes the sign of the change) (IPCC, 2013).
2
1.2 Ocean acidification
Simultaneously, oceans are absorbing CO₂, changing their chemical balance (IPCC, 2013). Dissolved CO₂ increases the bicarbonate ion (HCO₃⁻) and causes a decrease in carbonate ion (CO₃²⁻) (IPCC, 2013). Ocean CO₂uptake causes a decrease in ocean pH, resulting in ocean acidification (IPCC, 2013). Since the preindustrial time, ocean surface water pH has decreased 0.1 units and it is expected to decrease up to 0.13-0.42 units until 2100 (IPCC, 2014), however these values may be higher in coastal areas (IPCC, 2014). Ocean acidification will have impacts especially on calcifying organisms due to the reduction in seawater pH and carbonate ion concentrations which causes calcium carbonate (CaCO₃) saturation (Azevedo et al., 2015; Hoegh-Guldberg et al., 2007; Orr et al., 2005) (Fig 2). The reduction of carbonate-ions concentrations diminishes the rate of calcification of marine organisms weakening carbonate skeletal structures (Raven et al., 2005). Besides calcifying species, ocean acidification will also have an impact in other organisms, such as fish (Ishimatsu et al., 2008). High pCO₂ may involve an extra energy expenditure for physiological adaptations, especially in acid-base regulation (Ishimatsu et al., 2008). It has also been demonstrated that hypercapnia causes alterations in fish biological responses like aerobic scope (Munday et al., 2009; Rummer et al., 2013), decreases growth and thermal tolerance (Checkley et al., 2009; Pimentel et al., 2014b) and behavioral changes (Cripps et al., 2011; Munday et al., 2010; Pimentel et al., 2014a).
These global ocean changes are expected to cause negative responses in marine organisms, essentially because of the synergistic effects between these two factors.
Figure 2. Linkages between the buildup of atmospheric CO₂ and the slowing of coral calcification due to ocean acidification (Hoegh-Guldberg et al., 2007).
3 These effects have already been reported by various studies in diverse marine biota. Investigators demonstrated that in marine organisms, the synergism between warming and acidification has a higher negative effect on calcification, survival, and reproduction than when stressors act in isolation (Harvey et al., 2013). Predicted ocean warming and acidification caused shorter embryonic periods, lower survival rates and enhanced premature hatching in the cuttlefish and have drastic effects in survival rates of summer embryos of a coastal squid (Rosa et al., 2014b; Rosa et al., 2013). Pimentel et al., (2015) demonstrated that the effects on several physiological and biochemical variables in flatfish larvae change greatly under both ocean warming and acidification. Munday et al., (2009) also reported that aerobic scope and mortality in reef fish are affected by ocean warming and acidification. Pörtner and Farrell, (2008) presented a conceptual model of how synergistic stressors like ocean acidification (by CO₂) narrow thermal windows of aerobic performance according to species-specific sensitivities (Fig. 3).
1.3 Mercury contamination
In addition to global warming and ocean acidification, marine biota is also dealing with another stress factor: pollution. Marine ecosystems are becoming contaminated with several toxic compounds including metals. One of these metals is mercury, which is a very toxic element, as well as its compounds (Korbas et al., 2011). Mercury releases into the environment can occur through natural and anthropogenic sources (e.g. coal combustion, industrial activities, mining) (Nriagu and Pacyna, 1988; Richter et al., 2014). After the industrial revolution, mercury anthropogenic emissions increased drastically (Sunderland and Mason, 2007) and predictions say it is likely they will continue to increase (Streets et al., 2009). Nowadays mercury emissions are mostly of
Figure 3. Temperature effects on the thermal windows of aerobic performance on aquatic animals. Synergistic stressors like ocean acidification (by CO₂) narrow thermal windows (Pörtner and Farrell, 2008).
4 anthropogenic origin and part of these emissions are deposited in the ocean sediment (Selin et al., 2008; Sunderland and Mason, 2007) (Fig. 4).
Bacteria present in aquatic sediments transform the inorganic mercury form into methylmercury (MeHg), which is highly toxic (Richter et al., 2014). Due to the biochemical conditions that lead the Hg transformation in MeHg by bacteria, estuaries and coastal areas are favorable zones for this transformation to occur (Dijkstra et al., 2013). This compound bioaccumulates in aquatic organisms and goes through biomagnification in aquatic food webs, increasing its toxicity and reaching elevated concentrations in high trophic level biota (Campbell et al., 2005; Evers et al., 2011). Hence fish consumers, including humans, are at high risk of exposure toMeHg (Richter et al., 2014). MeHg comprises around 90–95% of the total mercury (HgT) in fish (Burger et al., 2003; Gray et al., 2000). It can cause several adverse effects in these animals, for example, disturb reproductive performance (Hammerschmidt et al., 2002; Matta et al., 2001), enhance oxidative stress (Berntssen et al., 2003; Gonzalez et al., 2005; Keyvanshokooh et al., 2009; Larose et al., 2008; Mieiro et al., 2010), alter activity of enzymes of the central nervous systems (De Domenico et al., 2013; Gill et al., 1990) and change swimming behavior and predator avoidance (Weis and Weis, 1995; Zhou and Weis, 1998).
1.4 Synergisms
Although marine organisms will have to deal with the effects of ocean warming, acidification and contamination simultaneously, little is known about the interactions between climate change and contaminants on marine organisms. The impacts of climate
Figure 4. Global budgets for preindustrial and current mercury cycling in oceans (Sunderland and Mason, 2007).
5 change on marine species can be aggravated by pollution (Noyes et al., 2009). Interactions between temperature and metal pollution influence the physiological tolerance to both stress factors in aquatic ectotherms (Sokolova and Lannig, 2008). Methylmercury bioaccumulation will increase at lower trophic levels under the predicted temperature rise, which consequently will increase MeHg levels throughout the food chain (Dijkstra et al., 2013). Elevated temperature exacerbates biological responses in freshwater fish exposed to metal contamination (Dorts et al., 2014; Lapointe et al., 2011; Sappal et al., 2014). Moreover, ocean acidification can also intensify metal toxicity (Han et al., 2014). For instance, it has been shown that acidification enhances the toxicity of copper in the polychaete Arenicola marina, showing that there are higher toxicity responses under reduced seawater pH (Campbell et al., 2014). Furthermore, temperature and pH affect the bioaccumulation of different metals in cephalopods early life stages (Labarthe et al., 2012; Labarthe et al., 2009; Lacoue-Labarthe et al., 2011).
Only few studies were conducted regarding climate change and contamination responses of marine organisms and, to my knowledge, none uses mercury as the metal contaminant. Most of them just evaluate the bioaccumulation in the organisms or visible responses such as mortality. Also, in fish, this type of response is usually analyzed in freshwater species. That said, there is a lack of knowledge in the response of marine biota, particularly in fish, to ocean warming, acidification and contamination simultaneously.
1.5 Stress biomarkers
As previously said, climate change can cause differences in the accumulation of mercury in fish (Dijkstra et al., 2013) plus, mercury has a great effect in the nervous system (Baatrup, 1991). In teleost fish, brain grows continuously during its lifetime (Ekström, 1994; Kotrschal et al., 1998) and can be affected by environmental conditions such as habitat complexity or different rearing conditions especially in early stages (Kihslinger and Nevitt, 2006; Pollen et al., 2007). Acetylcholinesterase (AChE) is an important enzyme in the nervous system because it hydrolyses the neurotransmitter acetylcholine (Romani et al., 2003). It has been reported that near-future carbon dioxide can alter neurotransmitter function in fish (Nilsson et al., 2012) and it is known that this enzyme is affected by mercury (Gill et al., 1990; Richetti et al., 2011). Nonetheless, no information exists on how ocean warming, acidification and mercury contamination will influence AChE response in fish.
Heat shock proteins (HSP) production occurs in response to high temperatures (Repolho et al., 2014; Rosa et al., 2014a; Rosa et al., 2012) and metal contamination
6 (Rajeshkumar and Munuswamy, 2011; Williams et al., 1996). High temperatures cause formation of oxygen reactive species (ROS) (Abele et al., 2002; Lesser, 2006) and HSP production helps repairing, refolding and eliminating damaged or denatured proteins and protect and control ROS formation (Sokolova et al., 2011). The increase in ROS may also cause lipid peroxidation, one of the most common cellular injury mechanisms (Lesser, 2006). ROS production induce antioxidant enzymes activity, such as superoxide dismutase (SOD), which converts superoxide (O₂⁻) into hydrogen peroxide (H₂O₂); catalase (CAT) which converts H₂O₂ into water (H₂O) and oxygen (O₂) and glutathione S-transferase (GST), which is involved in the protection against xenobiotics (Lesser, 2006; Wang et al., 2000).
7
2. Objectives
The aim of this study was to evaluate the biological responses of juvenile meagre (Argyrosomus regius), to the effects of ocean warming (+4ºC), acidification (ΔpH = 0.5 units) and MeHg exposure (8.02 mg kg⁻¹ dw). More specifically, I determined the combined impact of such climate-related variables and contamination on Fulton condition index, degree of encephalization, acetylcholinesterase levels, heat shock response, lipid peroxidation and antioxidant enzyme activities. It is worth noting that A.
regius is a resilient fish and can easily adapt to changes in the environment (Monfort, 2010).
However, this species is found in coastlines and estuaries, especially in the juvenile stage, where climate change and mercury will have more impact in the future. Meagre is a high commercial value fish (El-Shebly et al., 2007), thus being important to evaluate the future effects of these stressors on this species.
8
3. Material and methods
3.1. Collection of specimen and incubation
Juvenile organisms of Argyrosomus regius (n = 85; Fig. 5) (mean ± standard deviation; total weight: 4.26 ± 2.8 g; total length: 6.30 ± 1.2 cm), from IPMA’s aquaculture pilot station (EPPO, Olhão, Portugal) were transported to the aquaculture facilities of Laboratório Marítimo da Guia (LMG, MARE, Faculty of Sciences) in August 2014. The organisms were randomly placed in eight 90L tanks with separate recirculating aquaculture systems (RAS) filled with filtered natural seawater and equipped with glass wool, bio-balls and protein skimmers to maintain water quality.
After an acclimation period of 15 days, fish were subjected to ocean warming (+4 °C) and acidification (ΔpH = 0.5 units) and MeHg contamination conditions, more specifically, the trial was divided in eight treatments: i) 19 °C, pH 8.0 (control conditions) and control feed (MeHg: 0.06 mg kg⁻¹ dw; HgT: 0.07 mg kg⁻¹ dw), ii) 19 °C, pH 8.0 and contaminated feed (MeHg: 8.02 mg kg⁻¹ dw; HgT: 8.28 mg kg⁻¹ dw), iii) 19 °C, pH 7.5 (control temperature and hypercapnic scenario) and control feed (MeHg: 0.06 mg kg⁻¹ dw; HgT: 0.07 mg kg⁻¹ dw), iv) 19 °C, pH 7.5 and contaminated feed (MeHg: 8.02 mg kg⁻¹ dw; HgT: 8.28 mg kg⁻¹ dw); v) 23 °C, pH 8.0 (warming scenario with control pH) and control feed (MeHg: 0.06 mg kg⁻¹ dw; HgT: 0.07 mg kg⁻¹ dw); vi) 23 °C, pH 8.0 and contaminated feed (MeHg: 8.02 mg kg⁻¹ dw; HgT: 8.28 mg kg⁻¹ dw); vii) 23 °C, pH 7.5 (warming and hypercapnic scenario) and control feed (MeHg: 0.06 mg kg⁻¹ dw; HgT: 0.07 mg kg⁻¹ dw); and vii) 23 °C, pH 7.5 and contaminated feed (MeHg: 8.02 mg kg⁻¹ dw; HgT: 8.28 mg kg⁻¹ dw), with ten to twelve fish per treatment, during 30 days. The MeHg exposure occurred through the feed. Fish were fed two to three times a day and the
9 quantity of food provided was approximately 1% of animal weight per day. Salinity was kept at 35.0 ± 1.0 g/L and the photoperiod was fixed to 12 h light: 12 h dark. Temperature in the tanks was controlled and maintained using chillers, and pH was maintained with a Profilux system. Temperature, pH and salinity were measured every day. Ammonia and nitrite were regularly monitored and kept within recommended levels. Seawater carbonate system speciation (Table S1) was calculated once a week from total alkalinity (determined according to Sarazin et al., (1999) and pH measurements). Total dissolved inorganic carbon (CT), pCO₂ and aragonite saturation were calculated using the CO2SYS software (Lewis et al., 1998), with dissociation constants from Mehrbach et al., (1973) as refitted by Dickson and Millero, (1987).
3.2. Diet
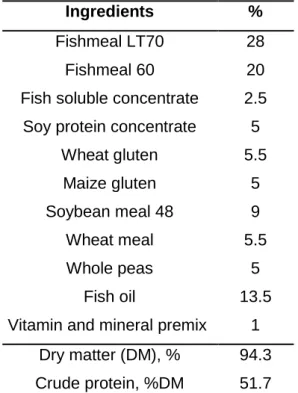
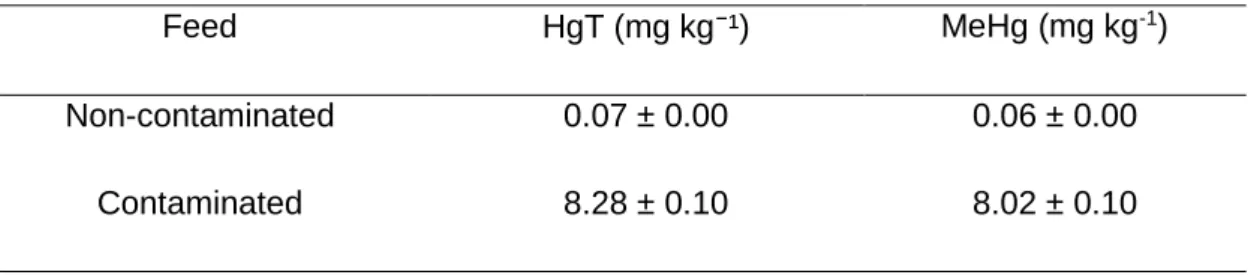
The non-contaminated and contaminated fish were fed with different diets. The composition of the two diets (Table 1) was similar diverging in one aspect: the contaminated diet was fortified with MeHg (inserted in the form of MeHg(II) chloride, CH₃ClHg, 99.8 %, Sigma-Aldrich, previously solubilized in ethanol). The pellet given to the fish in the contaminated treatment had approximately 8.02 mg kg⁻¹ dw of MeHg and 8.28 mg kg⁻¹ dw of HgT (Table 2).
Table 1. Composition of the two diets (i.e. dry inert pellets) used for juvenile meagre feeding.
Ingredients %
Fishmeal LT70 28
Fishmeal 60 20
Fish soluble concentrate 2.5 Soy protein concentrate 5
Wheat gluten 5.5 Maize gluten 5 Soybean meal 48 9 Wheat meal 5.5 Whole peas 5 Fish oil 13.5
Vitamin and mineral premix 1 Dry matter (DM), % 94.3 Crude protein, %DM 51.7
10 Crude fat, %DM 18.9
Ash, %DM 9.6
Table 2. Total mercury and methylmercury concentrations in the non-contaminated and contaminates feed
Feed HgT (mg kg⁻¹) MeHg (mg kg-1)
Non-contaminated 0.07 ± 0.00 0.06 ± 0.00
Contaminated 8.28 ± 0.10 8.02 ± 0.10
3.3.
Total mercury and methylmercury accumulation
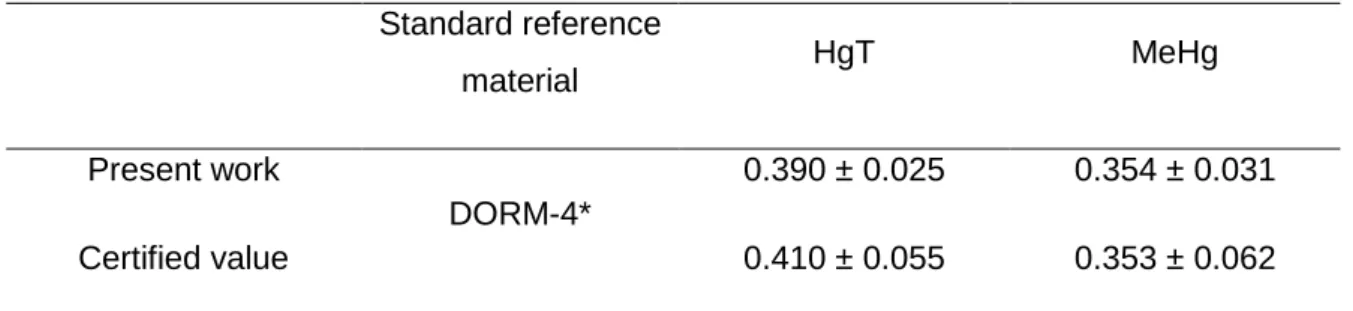
Methylmercury was extracted from the samples (fish and feeds) as described by Scerbo and Barghigiani, (1998), i.e. freeze-dried samples (approximately, 200 mg) were hydrolyzed in 10 ml of hydrobromic acid (47 % w/w, Merck), followed by MeHg extraction with 35 mL toluene (99.8 % w/w, Merck) and toluene removal with 6 ml cysteine aqueous solution (1 % L-cysteinium chloride in 12.5 % anhydrous sodium sulfate and 0.775 % sodium acetate; Merck). Then, total Hg and MeHg were determined in all samples (10-15 mg for solids or 100-200 µL for liquids) by atomic absorption spectrometry (AAS), following the method 7473 of the EPA, (2007), using an automatic Hg analyser (AMA 254, LECO, USA). Mercury concentrations were calculated from linear calibration (using, at least, five different standard concentrations), with a Hg(II) nitrate standard solution (1000 mg L-1, Merck) dissolved in nitric acid (0.5 mol L−1, Merck), and the detection limit was 0.005 mg kg-1, wet weight (ww). Accuracy was checked through the analysis of the certified reference material DORM-4, and results obtained in the present study were within the certified range of values (Table 3). A minimum of three measurements (replicates) were performed per sample. Blanks were always tested in the same conditions as the samples. Prior to utilization, all laboratory ware was cleaned with nitric acid (20 % v/v) for 24h and rinsed with ultrapure water to avoid contamination. All standards and reagents were of analytical (pro analysi) or superior grade.
11 Table 3. Laboratory performance on standard reference materials for total mercury and methylmercury (mg kg⁻¹ dry weight).
Standard reference material HgT MeHg Present work DORM-4* 0.390 ± 0.025 0.354 ± 0.031 Certified value 0.410 ± 0.055 0.353 ± 0.062
*fish protein certified reference material for trace metals, National Research Council Canada, Canada
3.4. Survival and Fulton condition
Survival rate was calculated as the percentage of live fish the end of the experiment, with respect to the number of fish at the beginning. After being euthanized fish were weighed and measured (TL). Fulton’s condition (measure of individual fish’s health) was calculated using the formula K = (weight/TL³) x 100.
3.5. Brain sampling
Fish were euthanized with an overdose of tricaine mesylate solution (MS222, Pharmaq; 500–1000 mg/L) and the spinal cord sectioned to be sure that the animal was dead. The brain was then visually macro-dissected from the cranial cavity, under a stereoscope. Afterwards, brain was dissected into five macro areas: telencephalon, diencephalon, optic tectum, cerebellum and brain stem (Fig. 6) and each area was weighted in an analytical Sartorius balance.
Figure 6. Fish brain macro areas: telencephalon, optic tectum, cerebellum, diencephalon and brainstem (Gonçalves et al., 2008)
12
3.6. Acetylcholinesterase (AChE) activity
Meagre brain areas were homogenized on ice in 1.0 mL of PBS solution (0.14M NaCl, 253 0.003M KCl, 0.01M Na2HPO4, 0.002M KH2PO4, pH 7.4) using a teflon tissue grinder for microtubes. The crude homogenates were then centrifuged (10 min at 14,000 x g at 4 °C). Then, 100 μl of supernatant were diluted to 1:2 in sodium phosphate buffer (50 mM, pH 8). The determination of acetylcholinesterase activity (EC 3.1.1.7; AChE) was performed based on an optimized Ellman method adapted to 96-well microplate (Ellman et al., 1961; Magnotti et al., 1987), in which thiocholine produced by the action of acetylcholinesterase forms a yellow (nitrobenzoate) color with 5,5’-dithiobis(2-nitrobenzoic acid), proportional to the AChE activity. All chemicals used in the assay were purchased to Sigma-Aldrich (Steinheim, Germany). Briefly, 50 μL of diluted samples, were added to each 96 microplate well (Greiner, Germany). Additionally, 50 μL of assay buffer were added to two microplate wells for blanks. Then an acetylthiocholine reaction mixture was prepared freshly in ultra-pure water [50 mM phosphate buffer; 75 mM Acetylthiocholine iodide solution; 1.0 mM of 5,5’-dithiobis(2-nitrobenzoic acid)] and 250 μL were added to each microplate well. Afterwards, the microplate was gently shaken for 30s at room temperature and absorbance read at 415 nm in a microplate reader (Bio-Rad, Benchmark model, USA) at every minute during 10 minutes. Then, AChE activity was calculated considering that one unit of enzyme catalyzes the production of 1.0 μmole of thiocholine per minute, under the assay conditions, and expressed as nmol min⁻¹ mg⁻¹ of total protein following normalization.
3.7. Heat shock response, lipid peroxidation and antioxidant enzyme activities
3.7.1. Preparation of tissue extracts:
Muscle, liver and gills samples (n = 6 per treatment) were homogenized (Ultra-Turrax, Ika, Staufen, Germany) in accordance to body mass of each sample in homogenization buffer, 300 mg tissue per 1 ml phosphate buffered saline solution (PBS, pH 7.3): 0.14 M NaCl, 2.7 mM KCl, 8.1 mM Na₂HP0₄, 1.47 mM KH₂P0₄] by using a glass/PTFE Potter Elvehjem tissue grinder (Kartell, Turin, Italy). All homogenates were then centrifuged (20 min at 14 000 g at 4 °C) and the antioxidant enzyme activities, lipid peroxidation and heat shock response (HSR) were quantified in the supernatant fraction. All enzyme assays were tested with commercial enzymes obtained from Sigma-Aldrich (St. Louis, MO, USA), and each sample was run in triplicate. The enzyme results were
13 normalize by measuring the total protein content of the samples according to the Bradford method (Bradford, 1976).
3.7.2. Heat shock proteins
Heat shock protein (HSP70/HSC70) content was assessed by Enzyme-Linked Immunoabsorbent Assay (ELISA) adapting a protocol from Njemini et al., (2005).Briefly, 10 μl of the homogenate’s supernatant was diluted in 250 μl of PBS (1x), and 50 μl of the diluted sample was added to a 96-well microplates (Nunc brand, Roskilde, Denmark) and allowed to incubate overnight at 4 °C. In the next day, the microplates were washed (3X) in 0.05% PBS-Tween-20. One hundred microliters of blocking solution [1% bovine serum albumin (BSA) Sigma-Aldrich] was added to each well and left to incubate at room temperature for 2 h. After washing the 96-well plates, 50 μl of 5 μg ml¯¹ primary antibody (anti-HSP70/HSC70, Acris, San Diego, CA, USA), detecting 72 and 73 kDa proteins corresponding to the molecular mass of inducible and constitutive isoforms, respectively, was added to each well and then incubated overnight at 4 °C. According to the manufacturer details the primary antibody HSP70/HSC70 (AM12032PU-N) has a broad range reactivity including diverse fish species. On the next day, the nonlinked antibody was removed by washing the microplates again, which were then incubated for 2 h at room temperature with 50 μl of 1 μg ml⁻¹ of the secondary antibody, antimouse IgC, Fab specific, alkaline phosphatase conjugate (Sigma-Aldrich). After three additional washes, 100 μl of substrate (SIGMA FASTTM p-Nitrophenyl Phosphate Tablets, Sigma-Aldrich) was added to each well and incubated 10-30 min at room temperature. Stop solution (50 μl; 3 N NaOH) was added to each well, and the absorbance was then read at 405 nm in a 96-well microplate reader (Asys UVM 340, Biochrom, USA). The amount of HSP70/HSC70 present in the samples was calculated from a curve of absorbance based on serial dilutions of purified HSP70 active protein (Acris) to give a range from 0 to 2000 ng ml⁻¹. The results were expressed in relation to the sample total protein (ng mg⁻¹total protein).
3.7.3. Lipid peroxides assay (malondialdehyde concentration)
Lipid peroxides assay was determined by the quantification of a specific end-product of the oxidative degradation process of lipids, malondialdehyde (MDA). The thiobarbituric acid reactive substances (TBARS) protocol (Uchiyama and Mihara, 1978) was used. Briefly, 5 μl of each sample, treated as described before, were added to 45 μl of 50 mM monobasic sodium phosphate buffer, followed by adding 12.5 μl of sodium dodecyl sulfate (8.1%), 93.5 μl of trichloroacetic acid (20%, pH = 3.5) and 93.5 μl of
14 thiobarbituric acid (1%) to each microtube. Then, 50.5 μl of ultrapure water was added to this mixture and placed in a vortex for 30 s. Afterward, a needle was used to puncture the lids and microtubes were incubated in boiling water (10 min) followed by cooling on ice. Subsequently, 62.5 μl of ultrapure water and 312.5 μl of n-butanol pyridine (15 : 1, v/v) (Sigma-Aldrich, Hamburg, Germany) were added and microtubes centrifuged (5000 x g; 5 min.). Triplicates of 150 μl of the supernatant of each reaction were put into a 96-well microplate and absorbance was read at 532 nm. To quantify the lipid peroxides (MDA content), an eight-point calibration curve (0–0.3 μM TBARS) was calculated using malondialdehyde (dimethylacetal) (MDA) (Merck, Switzerland) standards. Results were expressed in relation to the sample total protein (nmol mg-1 total protein).
3.7.4. Glutathione S-Transferase (GST) activity
Glutathione S-transferase (GST) total activity (EC 2.5.1.18) was determined according to the procedure described by Habig et al., (1974) and optimized for 96-well microplate (Sigma Technical Bulletin, CS0410). This assay uses 1-Chloro-2,4-dinitrobenzene (CDNB) as substrate and, upon conjugation of the thiol group of glutathione to the CDNB substrate, there is an increase in the absorbance. Therefore, the enzyme activity was determined spectrophotometrically by measuring the formation of the conjugates of glutathione (GSH) and l-chloro-2,4-dinitrobenzene (CDNB). The assay contained 200 mM L-glutathione (reduced), Dulbecco’s PBS and 100 mM 1-chloro-2,4-dinitrobenzene (CDNB) solution. Equine liver GST (Sigma-Aldrich) was used as positive control to validate the assay. Then, to perform the assay, 180 μl of substrate solution were added to 20 μl of GST standard or sample in each well of a 96-well microplate (Nunc-Roskilde) and the absorbance at 340 nm was recorded every minute for 6 min, using a plate reader (Asys UVM 340, Biochrom, USA). Thereby the increase in absorbance is directly proportional to GST activity. Then, the GST activity was calculated using a molar extinction coefficient for CDNB of 5.3 εmM (Sigma Technical Bulletin, CS0410), as follows:
𝐺𝑆𝑇 𝑎𝑐𝑡𝑖𝑣𝑖𝑡𝑦 = ∆𝐴340/𝑚𝑖𝑛 0.0053 ×
𝑇𝑜𝑡𝑎𝑙 𝑣𝑜𝑙𝑢𝑚𝑒
𝑆𝑎𝑚𝑝𝑙𝑒 𝑣𝑜𝑙𝑢𝑚𝑒× 𝑑𝑖𝑙𝑢𝑡𝑖𝑜𝑛 𝑓𝑎𝑐𝑡𝑜𝑟
The result are expressed in relation to total protein of the sample (nmol min-1 mg-1 total protein)
15
3.7.5. Catalase (CAT) activity
Catalase activity was assessed through and adaptation of the method described by Johansson and Borg, (1988). In this assay, 20 µl of each sample, 100 µl of 100 mM potassium phosphate and 30 µl of methanol were added to a 96-well microplate, which was promptly shaken and incubated for 20 minutes. Afterwards, 30 µl of potassium hydroxide (10 M KOH) and 30 µl of purpald (34.2 mM in 0.5 M HCl) were added to each well, and the plate shaken and incubated for another 10 minutes. Subsequently, 10 µl of potassium per iodate (65.2 mM in 0.5 M KOH) was added to each well and a final incubation was performed for 5 minutes. Using a microplate reader (BIO-RAD, Benchmark, USA), enzymatic activity was determined spectrophotometrically at 540 nm. Formaldehyde concentration of the samples was calculated based on a calibration curve (from 0 to 75 µM formaldehyde), followed by the calculation of the CAT activity of each sample, where one unit of catalase is defined as the amount that will cause the formation of 1.0 nmol of formaldehyde per minute at 25 ºC. The results are expressed in relation to total protein content (nmol min-1 mg-1protein).
3.7.6. Superoxide dismutase (SOD) activity
The SOD assay follows the nitro blue tetrazolium (NBT) method adapted from Sun et al., (1988). In this method, superoxide radicals (O₂⁻) are generated by the reaction of xanthine with xanthine-oxidase (XOD), and reduce NBT to formazan. SOD competes with NBT for the dismutation of O₂⁻ into peroxide (H₂O₂) and molecular oxygen. The assay was performed using a 96-well microplate (Nunc-Roskilde), adding to each well 200 μl of 50 mM phosphate buffer (pH 8.0) (Sigma-Aldrich), 10 μl of 3 mM EDTA (Riedel-de Haën, Seelze, Germany), 10 μl of 3 mM xanthine (Sigma-Aldrich), 10 μl of 0.75 mM NBT (Sigma-Aldrich) and 10 μl of SOD standard or sample. The reaction started with the addition of 100 mU XOD (Sigma-Aldrich) and the absorbance at 560 nm was recorded every minute for 5 minutes, using a plate reader (Asys UVM 340, Biochrom, USA) at 25 °C. A negative control included all components except SOD or sample, producing a maximal increase in absorbance at 560 nm, which allowed determining the inhibition percentage per minute, caused by SOD activity. SOD from bovine erythrocytes (Sigma-Aldrich) was used as standard and positive control. The SOD inhibition percentage was expressed in % inhibition mg⁻¹ of total protein.
16
3.8. Statistical analyses
Three-way ANOVAs (repeated measurements; using pH and temperatures and contamination) were conducted to detect significant differences in mercury accumulation, Fulton condition, acetylcholinesterase activity, heat shock response, lipid peroxidation and antioxidant enzyme activities. The differences in encephalization coefficient and macro areas coefficient were investigated in the following manner: for the encephalization coefficient a linear regression was made with the brain masses values of non-contaminated control conditions (19 °C pH 8.0), with these linear regression, predicted brain mass was calculated for the respectively fish mass of each fish of each condition. For the macro area coefficient five linear regressions were made with each brain macro area of non-contaminated control conditions (19 °C pH 8.0) and with these linear regressions, predicted macro areas masses were calculated for the respectively total brain mass of each fish and condition. Residuals were calculated with predicted mass value minus the observed mass and outliers were excluded using the ROUT method. Then, three-way ANOVAs (with temperature, acidification and contamination as variables) were conducted to detect significant differences in all variables measured. All statistical analyses were performed for a significance level of 0.05, using Statistica 12 software (StatSoft Inc., Tulsa, OK, USA).
17
4. Results
4.1. Total mercury accumulation
At the end of the 30-days trial, the warming and control pH condition elicited the highest mercury accumulation in most tissues analyzed (Fig. 7; P < 0.05). Under control conditions, gills and liver revealed higher levels of accumulation (6.25 mg kg⁻¹ and 7.06 mg kg⁻¹, respectively) than muscle (3.74 mg kg⁻¹) (P < 0.05). In contrast, under the control temperature and hypercapnia treatment (19 °C, pH 7.5), muscle accumulated less mercury (4.57 mg kg⁻¹) than liver (9.84 mg kg⁻¹) and the same happened under the warming and control pH condition (P < 0.05). Under the warming and hypercapnia scenario (23 °C, pH 7.5) gills accumulated less mercury (3.25 mg kg⁻¹) than brain (5.29 mg kg⁻¹) (P < 0.05).
18 0 2 4 6 8 10 12 14 16 18 20 22 19 °C pH 8.0 19 °C pH 7.5 23 °C pH 8.0 23 °C pH 7.5 Brain t o ta l me rcu ry (mg kg¯ ¹) Non-contaminated Contaminated 0 2 4 6 8 10 12 14 16 18 20 22 19 °C pH 8.0 19 °C pH 7.5 23 °C pH 8.0 23 °C pH 7.5 G ill s to ta l me rcu ry (m g kg¯ ¹) Non-contaminated Contaminated 0 2 4 6 8 10 12 14 16 18 20 22 19 °C pH 8.0 19 °C pH 7.5 23 °C pH 8.0 23 °C pH 7.5 Mu scle to ta l me rcu ry (m g kg¯ ¹) Non-contaminated Contaminated 0 2 4 6 8 10 12 14 16 18 20 22 19 °C pH 8.0 19 °C pH 7.5 23 °C pH 8.0 23 °C pH 7.5 Liv er to ta l me rcu ry (mg kg¯ ¹) Non-contaminated Contaminated ab* ab* b* a* AB AB AB A ac* c* ab* b* c* A AB AB B A A AB a* a* a* b* * * * * A B B AB B A B C D
Figure 7. Impact of ocean acidification (∆pH 0.5) and warming (+4 °C) on total mercury accumulation on A) brain B) gills, C) muscle and D) liver of juvenile meagre (Argyrosomus regius) exposed to methylmercury for 30 days. Values represent mean+s.d. Small letters represent statistical differences among treatments in the same contamination condition. Asterisk represents significant differences between contaminated and non-contaminated treatments in each temperature and pH condition. Capital letters represent significant differences between tissues in the same treatment.
19 E n c e p h a li z a ti o n c o e ff ic ie n t 1 9 ° C p H 8 .0 1 9 ° C p H 7 .5 2 3 ° C p H 8 .0 2 3 ° C p H 7 .5 - 2 0 - 1 5 - 1 0 - 5 0 5 C o n t a m i n a t e d N o n - c o n t a m in a t e d 0 20 40 60 80 100 19 °C pH 8.0 19 °C pH 7.5 23 °C pH 8.0 23 °C pH 7.5 Su rv iv al (% ) Non-contaminated Contaminated 1 1.5 2 2.5 19 °C pH 8.0 19 °C pH 7.5 23 °C pH 8.0 23 °C pH 7.5 Fu lto n co n d itio n in d ex (K ) Non-contaminated Contaminated 0.01 0.02 0.03 0.04 0.05 0.06 19 °C pH 8.0 19 °C pH 7.5 23 °C pH 8.0 23 °C pH 7.5 Brain we ight / b o d y w eight Non-contaminated Contaminated a a a b
4.2. Survival, Fulton condition and encephalization coefficient
During the trial, no mortalities were registered in all treatments. Furthermore, Fulton condition (K) did not show any significant differences between treatments (Fig. 8A; P > 0.05). Warming and hypercapnia changed significantly the encephalization coefficient under the non-contaminated condition (Fig. 8B; P < 0.05). Under this condition, brain was significantly bigger than its predicted value. Under contaminated conditions, encephalization coefficient did not displayed significant differences (P > 0.05), however, it was significantly different between the non-contaminated and contaminated warming and hypercapnia scenarios (P < 0.05).
* A
B
Figure 8. Impact of ocean acidification (∆pH 0.5), warming (+4 °C) and methylmercury contamination on A) Fulton condition index and B) the encephalization coefficient of juvenile meagre (Argyrosomus regius). Values represent mean+s.d. Different letters represent statistical differences among treatments in the same contamination condition. Asterisk represents significant differences between contaminated and non-contaminated treatments in each temperature and pH condition.
20 R e s id u a ls t e le n c e p h a lo n 1 9 ° C p H 8 .0 1 9 ° C p H 7 .5 2 3 ° C p H 8 .0 2 3 ° C p H 7 .5 - 0 .0 1 0 - 0 .0 0 5 0 .0 0 0 0 .0 0 5 0 .0 1 0 0 .0 1 5 0 .0 2 0 C o n t a m i n a t e d N o n - c o n t a m in a t e d R e s id u a ls d ie n c e p h a lo n 1 9 ° C p H 8 .0 1 9 ° C p H 7 .5 2 3 ° C p H 8 .0 2 3 ° C p H 7 .5 - 0 .0 3 - 0 .0 2 - 0 .0 1 0 .0 0 0 .0 1 C o n t a m i n a t e d N o n - c o n t a m in a t e d R e s id u a ls o p ti c t e c tu m 1 9 ° C p H 8 .0 1 9 ° C p H 7 .5 2 3 ° C p H 8 .0 2 3 ° C p H 7 .5 - 0 .0 2 - 0 .0 1 0 .0 0 0 .0 1 C o n t a m i n a t e d N o n - c o n t a m in a t e d
4.3. Macro areas coefficient
Ocean warming, acidification and contamination did not cause any significant changes in the macro areas coefficient ratio between telencephalon, optic tectum, diencephalon, cerebellum (Fig. 9A, B, C and D; P > 0.05). Brain stem was significantly bigger than what was predicted under warming and control pH (Fig. 9E; P < 0.05). Between non-contaminated and contaminated warming and control pH conditions there was a significant difference in the brain stem coefficient (P < 0.05).
A
B
21 B r a in s t e m r e s id u a ls 1 9 ° C p H 8 .0 1 9 ° C p H 7 .5 2 3 ° C p H 8 .0 2 3 ° C p H 7 .5 - 0 .1 5 - 0 .1 2 - 0 .0 9 - 0 .0 6 - 0 .0 3 0 .0 0 0 .0 3 C o n t a m i n a t e d N o n - c o n t a m in a t e d R e s id u a ls c e r e b e ll u m 1 9 ° C p H 8 .0 1 9 ° C p H 7 .5 2 3 ° C p H 8 .0 2 3 ° C p H 7 .5 - 0 .0 1 0 .0 0 0 .0 1 0 .0 2 0 .0 3 C o n t a m i n a t e d N o n - c o n t a m in a t e d a a b * a E D
Figure 9. Impact of ocean acidification (∆pH 0.5), warming (+4 °C) and methylmercury contamination on macroareas coefficient between the five areas of the brain A) telencephalon, B) optic tectum, C) diencephalon, D) cerebellum and E) brain stem of juvenile meagre (Argyrosomus regius). Values represent mean+s.d. Small letters represent statistical differences among treatments in the same contamination condition. Asterisk represents significant differences between contaminated and non-contaminated treatments in each temperature and pH condition.
22
4.4. Brain macro areas acetylcholinesterase activity
Ocean warming and acidification did not affect significantly AChE activity in all five meagre brain macro areas under non-contaminated conditions (Fig. 10; P > 0.05). However, contamination induced a significant increase in AChE activity in all areas (Fig. 10; P < 0.05). In the telencephalon, warming and acidification revealed an increase in AChE (1575.01 nmol min⁻¹ mg⁻¹ protein) compared to the activity under the same temperature condition and control pH (830.96 nmol min⁻¹ mg⁻¹ protein) (Fig. 10A; P < 0.05). Moreover, AChE in the optic tectum increased significantly under the most drastic scenario (23 °C and pH 7.5) (1434.15 nmol min⁻¹ mg⁻¹ protein) (Fig. 10B; P < 0.05). In diencephalon, AChE decreased under the warming and control pH contaminated treatment (962.35 nmol min⁻¹ mg⁻¹ protein) in comparison with the same temperature but hypercapnia treatment (1531.92 nmol min⁻¹ mg⁻¹ protein) (Fig. 10C; P < 0.05). In contrast, in the cerebellum, neither temperature nor pH affected the enzyme response to contamination (Fig. 10D, P > 0.05). Under the contaminated scenario, warming and hypercapnia increased AChE activity in brain stem (1837.70 nmol min⁻¹ mg⁻¹ protein) in comparison with control temperature and pH, and control temperature and hypercapnia treatments (1376.38 nmol min⁻¹ mg⁻¹ protein and 1375.70 nmol min⁻¹ mg⁻¹ protein, respectively) (Fig. 10E; P < 0.05).
Only the non-contaminated control temperature and pH and warming and control pH treatments showed significant differences between the five brain macro areas AChE activities under the same treatment. Under contaminated conditions, only the warming and hypercapnia condition did not reveal significant differences in the AChE levels of the different brain macro areas under the same treatment. Under the non-contaminated temperature and pH control condition, AChE was higher in the diencephalon (243.32 nmol min⁻¹ mg⁻¹ protein) than in the brain stem (141.08 nmol min⁻¹ mg⁻¹ protein) (Fig. 10; P < 0.05). In the non-contaminated condition, under warming and control pH, telencephalon and cerebellum had lower AChE activity (125.11 nmol min⁻¹ mg⁻¹ protein and 117.45 nmol min⁻¹ mg⁻¹ protein, respectively) than diencephalon and brain stem (206.88 nmol min⁻¹ mg⁻¹ protein and 217.61 nmol min⁻¹ mg⁻¹ protein, respectively) (Fig. 10; P < 0.05). Under the contaminated control temperature and pH condition, cerebellum activity was significantly lower (794.28 nmol min⁻¹ mg⁻¹ protein) than in the brain stem (1376.39 nmol min⁻¹ mg⁻¹ protein) (Fig. 10; P < 0.05). Under the control temperature and hypercapnia contaminated condition, diencephalon AChE activity (1475.72 nmol min⁻¹ mg⁻¹ protein) was statistically higher than in the cerebellum (931.20 nmol min⁻¹ mg⁻¹ protein) (Fig. 10; P < 0.05). Lastly, under the warming and control pH scenario, telencephalon, diencephalon and cerebellum had lower AChE
23 activity (831.00 nmol min⁻¹ mg⁻¹ protein, 962.35 nmol min⁻¹ mg⁻¹ protein and 801.95 nmol min⁻¹ mg⁻¹ protein, respectively) than brain stem (1461.22 nmol min⁻¹ mg⁻¹ protein) (Fig. 10; P < 0.05).
24 0 500 1000 1500 2000 2500 19 °C pH 8.0 19 °C pH 7.5 23 °C pH 8.0 23 °C pH 7.5 Te le n ce p h alo n AC h E a ctiv ity (n m o l m in ¯¹ m g¯¹ p ro tein)
Non contaminated Contaminated
0 500 1000 1500 2000 2500 19 °C pH 8.0 19 °C pH 7.5 23 °C pH 8.0 23 °C pH 7.5 Op tic t ectu m AC h E a ctiv ity (n m o l m in ¯¹ mg¯¹ p ro tein)
Non contaminated Contaminated
0 500 1000 1500 2000 2500 19 °C pH 8.0 19 °C pH 7.5 23 °C pH 8.0 23 °C pH 7.5 Di en ce p h alon AC h E a ctiv ity (n m o l m in ¯¹ mg ¯¹ p ro tein)
Non contaminated Contaminated
0 500 1000 1500 2000 2500 19 °C pH 8.0 19 °C pH 7.5 23 °C pH 8.0 23 °C pH 7.5 C ere b ell u m AC h E a ctiv ity (n m o l m in ¯¹ mg¯¹ p ro tein)
Non contaminated Contaminated
0 500 1000 1500 2000 2500 19 °C pH 8.0 19 °C pH 7.5 23 °C pH 8.0 23 °C pH 7.5 B rain s te m AC h E a ctiv ity (n m o l m in ¯¹ mg¯¹ p ro tein) Non-contaminated Contaminated ab* a* b* ab* a* a* a* b* ab* a* b* a* * * * * a* ab* a* b* AB AB AB A A AB AB AB AB AB A AB A B A AB A B A A B B AB B B A B C D E
Figure 10. Impact of ocean acidification (∆pH 0.5), warming (+4 °C) and methylmercury contamination on the acetylcholinesterase activity on the five areas of the brain A) telencephalon, B) optic tectum, C) diencephalon, D) cerebellum and E) brain stem of juvenile meagre (Argyrosomus regius). Values represent mean+s.d. Small letters represent statistical differences among treatments in the same contamination condition. Asterisk represents significant differences between contaminated and non-contaminated treatments in each temperature and pH condition. Capital letters represent significant differences between tissues in the same treatment.
25
4.5. Heat shock response and lipid peroxidation
Water temperature, pH and the usage of a non-contaminated/contaminated food source had distinct effects on HSP70/HSC70 expression in different tissues. Only muscle displayed significant differences (Fig. 11B; P < 0.05), i.e. an increase in the HSP content occurred under both warming and control pH conditions (5.55 ng mg⁻¹ protein in the non-contaminated condition and 6.06 ng mg⁻¹ protein in the non-contaminated condition) when compared to control conditions (19 °C pH 8.0) (3.76 ng mg⁻¹ protein in the non-contaminated condition and 3.51 ng mg⁻¹ protein in the non-contaminated condition). However, there was a significant drop in HSP content, under warming and hypercapnia conditions (23 °C pH 7.5) in non-contaminated tissue (3.94 ng mg⁻¹ protein) (Fig. 11B; P < 0.05).
When comparing different tissues in the same condition it is evident that the HSP content changes (Fig. 11). Under control non-contaminated and contaminated conditions, HSP was statistically higher in liver (5.85 ng mg⁻¹ protein in the non-contaminated condition and 6.68 ng mg⁻¹ protein in the non-contaminated condition) than in gills (3.47 ng mg⁻¹ protein in the non-contaminated condition and 3.89 ng mg⁻¹ protein in the contaminated condition) and muscle (3.76 ng mg⁻¹ protein in the non-contaminated condition and 3.51 ng mg⁻¹ protein in the contaminated condition) (P < 0.05; Fig. 11). At warming and control pH scenario, HSP’s were significantly higher in the muscle (5.55 ng mg⁻¹ protein) when compared to gills and liver (3.19 ng mg⁻¹ protein and 3.60 ng mg⁻¹ protein, respectively) (P < 0.05; Fig. 11). Under the non-contaminated warming and hypercapnia scenario, HSP’s were statistically higher in the muscle and liver (3.94 ng mg⁻¹ protein and 4.77 ng mg⁻¹ protein, respectively) (P < 0.05; Fig. 11).
Regarding MDA levels, no significant differences were observed between treatments (P > 0.05; Fig 11D).
26 0 1 2 3 4 5 6 7 8 9 10 19 °C pH 8.0 19 °C pH 7.5 23 °C pH 8.0 23 °C pH 7.5 G ill s H SP (n g mg ¯¹ p ro tein)
Non contaminated Contaminated
0 1 2 3 4 5 6 7 8 9 10 19 °C pH 8.0 19 °C pH 7.5 23 °C pH 8.0 23 °C pH 7.5 Mu scle H SP (n g mg ¯¹ p ro tein )
Non contaminated Contaminated
0 1 2 3 4 5 6 7 8 9 10 19 °C pH 8.0 19 °C pH 7.5 23 °C pH 8.0 23 °C pH 7.5 Liv er H SP (ng m g¯¹ p rotei n )
Non contaminated Contaminated
0 0.005 0.01 0.015 0.02 0.025 0.03 0.035 0.04 19 °C pH 8.0 19 °C pH 7.5 23 °C pH 8.0 23 °C pH 7.5 MDA (n m o l m g¯ ¹ p ro tein) Non-contaminated Contaminated a A ab a a ab b ab A A B b A B A B A A B B A B C D
Figure 11. Impact of ocean acidification (∆pH 0.5), warming (+4 °C) and methylmercury contamination on HSP in A) gills, B) muscle and C) liver and on D) muscle MDA concentration in juvenile meagre (Argyrosomus regius). Values represent mean+s.d. Small letters represent statistical differences among treatments in the same contamination condition. Capital letters represent significant differences in HSP between tissues in the same treatment.
27
4.6. Antioxidant enzymes activities
The impact of ocean warming, acidification and contamination on antioxidant enzymes (GST, CAT and SOD) in the muscle of juvenile Argyrosomus regius is shown in Figure 12.
GST activity did not change with contamination (Fig. 12A; P > 0.05). Warming caused an increase in GST activity (P < 0.05). Furthermore, under contamination, GST was statistically the highest under warming and control pH scenario when compared with warming and acidification, with values ranging from 9.47 nmol min⁻¹ mg⁻¹ protein to 6.05 nmol min⁻¹ mg⁻¹ protein, respectively, (P < 0.05).
Catalase activity did not display significant differences in non-contaminated treatments (Fig.12B; P > 0.05), however when contaminated with MeHg, meagre CAT activity statistically increased from 4.22 to 6.64 nmol min⁻¹ mg⁻¹ protein under the control temperature and hypercapnia scenario (P < 0.05).
SOD activity did not show any significant differences under non-contaminated treatments (Fig.12C; P > 0.05). In contrast, in contaminated conditions, SOD was significantly higher under the control temperature and acidification treatment (P < 0.05).
28 3 4 5 6 7 8 9 10 11 19 °C pH 8.0 19 °C pH 7.5 23 °C pH 8.0 23 °C pH 7.5 G ST (nm ol m in¯ ¹ m g¯¹ p rotei n )
Non contaminated Contaminated
0 1 2 3 4 5 6 7 8 19 °C pH 8.0 19 °C pH 7.5 23 °C pH 8.0 23 °C pH 7.5 Cata las e (n m o l m in ¯¹ mg¯¹ p ro tein)
Non contaminated Contaminated
0 2 4 6 8 10 12 14 16 18 19 °C pH 8.0 19 °C pH 7.5 23 °C pH 8.0 23 °C pH 7.5 SOD (% in h ib itio n m g¯¹ p ro tein) Non-contaminated Contaminated a ab b a b ab b a a * a b a a A B C
Figure 12. Impact of ocean acidification (∆pH 0.5), warming (+4 °C) and methylmercury contamination in the A) GST activity, B) Catalase activity and C) SOD activity in the muscle tissue of juvenile meagre (Argyrosomus regius). Values represent mean+s.d. Different small letters represent statistical differences among treatments in the same contamination condition. Asterisk represents significant differences between contaminated and non-contaminated treatments in each temperature and pH condition.