Evolution of cost recovery levels in the
Portuguese water supply and
wastewater industry 1998-2005
H
H
e
e
n
n
r
r
i
i
q
q
u
u
e
e
M
M
o
o
n
n
t
t
e
e
i
i
r
r
o
o
O
O
u
u
t
t
u
u
b
b
r
r
o
o
d
d
e
e
2
2
0
0
0
0
8
8
W
W
P
P
n
n
º
º
2
2
0
0
0
0
8
8
/
/
7
7
3
3
DOCUMENTO DE TRABALHO WORKING PAPERDINÂMIA – CENTRO DE ESTUDOS SOBRE A MUDANÇA SOCIOECONÓMICA
Evolution of cost recovery levels in the Portuguese water supply
and wastewater industry 1998-2005
H
H
e
e
n
n
r
r
i
i
q
q
u
u
e
e
M
M
o
o
n
n
t
t
e
e
i
i
r
r
o
o
11W
W
P
P
n
n
º
º
2
2
0
0
0
0
8
8
/
/
7
7
3
3
Outubro de 2008
1 henrique.monteiro@iscte.pt. Economics Department and DINÂMIA, ISCTE – Higher Institute of Social
Sciences and Business Studies, Av. das Forças Armadas, 1649-026 Lisboa, PORTUGAL. Phone: +351 21 790 39 03. Fax. +351 21 790 39 33.
This document was created within the research project POCI 2010/EGE/61306/2004 – Tarifaqua: tariff structures for efficient cost recovery in water services, approved by the FCT and by the POCI 2010, co-financed by the European fund FEDER.
A Abbssttrraacctt 1 1.. IINNTTRROODDUUCCTTIIOONN 55 2 2.. CCOOSSTTRREECCOOVVEERRYYIINNPPOORRTTUUGGUUEESSEELLAAWW 66 3 3.. MMEETTHHOODDOOLLOOGGYY 99 4 4.. BBRRIIEEFFDDEESSCCRRIIPPTTIIOONNOOFFWWAATTEERRAANNDDWWAATTEEWWAATTEERRUUTTIILLIITTIIEESS 1100 5 5.. CCOOSSTTSS 1177 6 6.. RREEVVEENNUUEESS 3399 7 7.. CCOOSSTTRREECCOOVVEERRYYLLEEVVEELLSS 5566 8 8.. CCOONNCCLLUUSSIIOONN 6633 9 9.. RREEFFEERREENNCCEESS 6655
Index of tables
Table 1 - WS and WWDT systems’ costs in 2005... 19
Table 2 – Unit cost by type of utility in retail WS and WWDT (2005) ... 32
Table 3 – Average annual rate of change in costs in WS and WWDT 1998-2002 ... 33
Table 4 – Average annual rate of change in per customer unit costs in WS and WWDT 1998-2005 ... 35
Table 5 – Average annual rate of change in per m3 unit costs in WS and WWDT 1998-2005 .. 36
Table 6 – Unit revenues by type of utility in retail WS and WWDT (2005) ... 51
Table 7 – Average annual rate of change in revenues in WS and WWDT 1998-2002... 52
Table 8 – Average annual rate of change in per customer unit revenues in WS and WWDT 1998-2005... 53
Table 9 – Average annual rate of change in per m3 unit costs in WS and WWDT 1998-2005 .. 54
Table 10 – Cost recovery levels for mainland Portugal by type of system (2002-2005) ... 56
Table 11 - % of water/wastewater utilities and corresponding volumes supplied/drained with cost recovery ratios above and below unity in WS and WWDT (2002-2005) ... 57
Table 12 – Cost recovery levels in mainland Portugal in WS and WWDT (2002-2006) ... 59
Table 13 – Cost recovery ratios by type of utility in retail WS and WWDT (2005) ... 62
Index of figures Figure 1 - Classification of utilities by the nature of the service provided (2005)... 11
Figure 2 - Type of water utility/management (2002-05)... 12
Figure 3 - Distribution of retail WS utilities by type (2005)... 13
Figure 4 - Distribution of bulk WS utilities by type (2005) ... 14
Figure 5 - Distribution of retail WWDT utilities by type (2005) ... 14
Figure 6 - Distribution of bulk WWDT utilities by type (2005) ... 15
Figure 7 - Total costs declared for WS and WWDT systems (2005)... 18
Figure 8 - Distribution of operation costs reported in WS and WWDT (2005)... 21
Figure 9 - Evolution of investment costs in WS (1987-2005) ... 22
Figure 10 - Evolution of investment costs in WWDT (1987-2005)... 23
Figure 11 – Average cost per utility in WS and WWDT systems (2005) ... 24
Figure 12 – Annual unit cost per customer in retail WS and WWDT systems (2005) ... 25
Figure 13 – Average unit cost per m3 in WS and WWDT systems (2005)... 26
Figure 15 – Distribution of retail WS/WWDT tariff revenues (2005)... 42
Figure 16 - Disaggregation of non-tariff revenues in WS (1998-2005)... 43
Figure 17 - Disaggregation of non-tariff revenues in WWDT (1998-2005) ... 44
Figure 18 – Average revenue per utility in WS and WWDT systems (2005)... 45
Figure 19 - Annual unit revenues per customer in retail WS and WWDT systems (2005) ... 46
Figure 20 - Average unit revenue per m3 in WS and WWDT systems (2005)... 47
Index of maps Map 1 - Geographical distribution of the main retail WS utilities in each municipal county (2002 and 2005)... 16
Map 2 - Geographical distribution of the main retail WWDT utilities in each municipal county (2002 and 2005)... 17
Map 3 – Average cost per utility in retail WS and WWDT by NUTS III (2005) ... 27
Map 4 – Average unit cost per customer in retail WS and WWDT by NUTS III (2005)... 28
Map 5 – Average unit cost per m3 in retail WS and WWDT by NUTS III (2005) ... 29
Map 6 – Population density and altitude variation by NUTS III (2005)... 30
Map 7 – Water quality indicators: sampling frequency failures and mandatory quality parameters failures by municipality (2005)... 31
Map 8 – Average revenue per utility in retail WS and WWDT by NUTS III (2005) ... 48
Map 9 – Average unit revenue per customer in retail WS and WWDT by NUTS III (2005)... 49
Map 10 – Purchasing power index and household disposable income per capita (2005) ... 49
Map 11 – Average unit revenue per m3 in retail WS and WWDT by NUTS III (2005)... 50
Map 12 – Cost recovery ratios in retail WS by NUTS III (2002-2005)... 60
Evolution of cost recovery levels in the Portuguese water supply
and wastewater industry 1998-2005
2Abstract:
This paper assesses the situation in Portugal in 2005 regarding cost recovery in the water supply (WS) and wastewaterdrainage and treatment (WWDT) industry by type of system (bulk and retail water and wastewater), by type of utility and by NUTS III, halfway between the publication of the Water Framework Directive (WFD) and the meeting of the 2010 deadline. For that purpose, we build on the previous contribution by Monteiro (2007), which reported the situation in 2002, by updating the indicators to 2005 and assessing the evolution since 1998. We also present a brief historical overview of the presence of the cost recovery principle in Portuguese law regarding the industry. The main conclusions that stand out are: the introduction of the cost recovery principle is prior to the WFD and the more recent Water Law, although it lacked practical implementation; the level of revenues collected by the WS and WWDT utilities is insufficient to meet the financial costs of their activities; the situation is worse for wastewater than for WS systems, revealing evidence of cross-subsidization within the utilities which manage both systems; the situation has worsened in recent years; cost recovery levels are lower in the less densely populated and poorer inland regions; finally, we find no evidence associating cost recovery levels and the type of utility.
Keywords:
Water Supply Systems; Wastewater Drainage and Treatment; Cost Recovery; Water Framework Directive; Water Law.JEL Code:
Q251. INTRODUCTION
2 The author thanks the valuable comments from Catarina Roseta Palma and the cooperation of the
Cost recovery for water services is not a consensual recommendation across the world. While some international organizations from the developed world tend to recommend it as being essential for the financial sustainability of water utilities (OECD, 2006), that is not the case for some worldwide reaching organizations such as the United Nations, which is more concerned with the impact such a principle would have on the poor, leading it to recognize the role that subsidization may have on the improvement of population provision levels in water supply and sewage drainage and treatment (UNDP, 2006 and WWAP, 2006). This may be due to the fact that in developed countries, the water outlays represent a very small portion of the average household income, whereas in developing countries the implementation of full cost recovery would put greater stress on households’ budgets. Foster and Yepes (2006), for example report that in Latin America’s “lower-income countries (Bolivia, Honduras, Nicaragua, and Paraguay), reaching cost recovery tariffs would represent a significant affordability problem for around half of the population” (ibid., p. 34). They compare these results to India and Africa where around 70% of households could be expected to face difficulties in paying full cost recovery tariffs. This would not be the case for a country like Portugal, where water expenditures are estimated to represent less than 1% of average household income (Roseta-Palma et al., 2006). Even when affordability is a real issue, the use of water consumption subsidies as a poverty alleviation measure can be controversial, not only because of their perverse effects on economic efficiency and the financial health of water utilities, but also because their efficacy is also questionable. For example, Komives et al. (2006) find in their study that “most common forms of residential utility subsidies - quantity-based consumption subsidies such as increasing block tariffs - are highly regressive. Most poor households are excluded from these subsidies, and the majority of benefits accrue to the non-poor” (ibid., p. 3). Dahan and Nisan (2007) and Bithas (2008) provide further evidence on the unintended consequences of IBT pricing policies regarding the equity objective.
In theory, this is not an open debate for Europe, where since the publication of the Water Framework Directive (WFD) in 2000, cost recovery in the water supply and sewage industry (including scarcity and environmental costs) has been a main focus of concern (despite the recent surge in interest in the notion of disproportionate costs from article 4 as a reason for exempting a region from compliance with WFD requirements). Although the document’s main focus is the enhancement of the quality of Europe’s water bodies, the introduction of specific sections dealing with economic and financial requirements and instruments has sparked a lot of debate, reports and action all over the European Union.
The WFD (EU, 2000) takes up the principle of cost recovery in water services in its article 9, requiring the economic analysis of water uses in article 5. WATECO (2003) and Ribeiro (2006 and 2007) provide an excellent overview of the economic implications of the WFD, its
deadlines and the institutional settings in which it came about. For the purpose of our document it suffices to say that article 9 establishes 2010 as the deadline for the establishment of an adequate contribution of the several water users (at least households, agricultural and industrial users) for the implementation of cost recovery for the water industry. We assess the cost recovery situation in Portugal in 2005, halfway between the publication of the WFD and the meeting of the established deadline. For that purpose, we build on the previous contribution by Monteiro (2007), which reported the situation in 2002, by updating the indicators to 2005 and assessing the evolution since 1998. To our knowledge, this is the only independent assessment of cost recovery levels for the water industry outside the analysis performed by the Portuguese official institutions (Alves and Pinto, 2004; INAG, 2005, 2007 and 2008)
2. COST RECOVERY IN PORTUGUESE LAW
In Portugal, the cost recovery principle has gained legal recognition, even though many times it still lacks practical implementation. This section describes the evolution of Portuguese Law regarding the cost recovery principle in the water industry, of which we present only a synthesis (more details on the history of the cost recovery principle in Portuguese legal documents are presented by Ribeiro (2007) and APDA (2006)). The remaining sections will assess its implementation.
The awareness about the need to raise revenues from the water supply activity to help finance infrastructure building can be found in Portuguese Law as early as 1892. The decree of 19 December 1892, regarding the hydraulic services of the Ministry of Public Works, defines in its article 21 the revenues of the water districts, assigning them to the public works to be performed in the district, including tariff payments for irrigation water, sand removal or license fees for the use of water surfaces to name a few (Ribeiro, 2007, p. 126).
According to Ribeiro (2007, p. 131), the requirement that the beneficiary should pay for public works improvement of water supply can also be found in the 1930’s, where increased State intervention in the development of hydraulic works for agriculture is accompanied with the payment of an Irrigation and Improvement Charge (a fixed annual fee per hectare), which could be paid in money or in land. Regarding urban water supply, the Administrative Code of 1936 states in article 165 that water tariffs should be set “so as to cover the operation and management costs and to allow the formation of the necessary reserves” (ibid, p. 132). It was by this time also that water supply became one of the main tasks of the municipalities. Despite this evidence that revenue collection from users was important, this is far from pointing to full cost recovery. Just as an example, the investments in water and sewage infrastructure have always
been subsidized by the State (and from 1986 onwards by European funds also). This is also pointed out by the Portuguese Association of Water Suppliers and Wastewater Drainage by stating that “the legal regime has always faced the difficulty intrinsic in the distance between the legal stipulations and their effective implementation. Examples can be found in the several attempts of the legislator to impose the economic balance of the services (…) also present, since the 40’s, in the requirement that municipal services should have tariffs which covered the costs of operation and allowed the formation of the necessary reserves” (APDA, 2006, p. 22).
Nevertheless, the principle that, at the very least, the service should not be free has been deeply entrenched in Portuguese legislation. The Decree-Law n. 70/90, which regulates the previous Framework Law for the Environment (approved in 1987 to update the Portuguese environmental law to the European Community standards, to which Portugal had just joined), also states that beneficiaries of water supply and sewage infrastructures should pay for their services. The several laws published since 1979 regulating the finances of the municipalities have always included water and sewage tariffs as part of the municipalities’ revenues3. Furthermore, they established that the tariffs should cover operation and investment costs4 (although this has not always been the case as we shall demonstrate). This legal principle also covers the State-owned companies like EPAL5 and the private concession services (which had been forbidden between 1977 and 1993).
The Economic and Financial Regime for the Water Resources published in 1994 (Decree-Law 47/94) introduced the polluter pays principle and the user pays principle in the Portuguese Law regarding the use of water resources (Ribeiro, 2007, p. 138). It also includes the definition of charges for water withdrawals according to the water availability in the basin and wastewater effluent discharges into the environment according to the treatment cost for each pollutant type. The revenue raised in this way should have accrued to the budgets of the National Water Institute and the Regional Environmental Public Offices, but they were never implemented in practice for lack of subsequent regulation.
3 The current version of the Law of Local Finances (for municipalities) is Law n. 2/2007 of January 15.
Fees are established as legal revenue in article 16 whereas water and sewage tariffs/prices are established in article 17. Previous versions were: Law 1/79 of January 02; Decree-Law n. 98/84 of March 29; Law n. 1/87 of January 06; Law n. 42/98 of August 6.
4 For example, article 9 of the Decree-Law n. 98/84 of March 29 stated that tariffs “should not be less than
the forecasted operation and management expenditures plus the necessary amount for equipment amortization”. This principle is still maintained in the current Law n. 2/2007, where article 16 n.1 reads “The prices and remaining payment instruments set by the municipalities regarding the services and goods supplied by the municipal organic units, either through direct management or through [autonomous] municipal services, should not be less than the cost directly or indirectly incurred with the activity of supplying those goods and services.” (Assembleia da República, 2007)
5 EPAL is the water supplying company for the country’s capital, Lisbon, and it also supplies bulk water to
some neighbouring municipalities. APDA (2006, pp. 32-33) cites some examples regarding the presence of the cost recovery principle in the legislation regulating this company from 1974 onwards as it changed from a 100% State-owned public company to a Public Limited Company with share capital held by the State’s holding company for the Water and Waste industry, AdP - Águas de Portugal.
In 2005, a new Water Law was published transposing the WFD into Portuguese Law (Assembleia da República, 2005). Its chapter VII brought with it a new economic and financial regime for water resources. The economic principles of the WFD are fully reflected in this law, which recognizes the economic value of water as a scarce resource and the principle of cost recovery for water services, including scarcity and environmental costs (ibid, articles 3 and 77). It also creates a water resource charge for the activities of water withdrawal, effluent discharge, sand removal and occupation of state-owned land or water surfaces. The revenues from the water resource charge must be used to promote water use efficiency, water resources quality and the improvement of water bodies and ecosystems and to finance the necessary infrastructures and administrative system. The water resource charge is a step forward in the internalization of scarcity-related opportunity costs and environmental costs. The implementation of cost recovery regarding the investment, operation and maintenance costs is left for the water tariff policy set by the water utility (ibid., article 82). Naturally, water tariffs must reflect the scarcity and environmental costs internalized by the water resource charge paid by the water utilities to the State6. Because cost recovery is surely impossible without the proper knowledge of the costs incurred, article 83 determines that it is the National Water Authority’s task to perform economic analysis of water resource use at the river basin level.
Unlike the water resource charge set up in 1994, but which never saw the light of day due to the lack of subsequent legislation concerning its implementation, the new charge has already been in place since July 2008, after the publication of the Decree-Law 97/2008 of June 11, which establishes the new economic and financial regime for water resources. The cost recovery principle (including scarcity and environmental costs) is assumed from the outset, within the spirit of the new Water Law and the WFD. Three instruments are established to meet the goals of sustainable water management through the promotion of water use efficiency, water conservation and water quality standards set up in the Water Law: the aforementioned water resource charge; water tariffs; contracted funding programs. The document not only determines the actual calculation procedure for the water resource charge, but also the division of the revenue generated between the National Water Institute, the recently created River Basin Authorities and a water resources protection fund to be created in a subsequent Decree-Law with the aim of promoting the rational use and protection of water resources. The articles concerning the water tariffs (chapter III, articles 20-23) set up the principles of cost recovery, financial sustainability of the water utility, water use efficiency and transparency in billing, but the details are referred to a later Decree-Law which will bring a new regime for water tariff setting, on which the Regulating Authority for Water and Waste (IRAR) has been working with
6 Our analysis of cost recovery in this paper is limited to its financial aspects as we do not consider scarcity
the Ministry of Environment. Finally, the contracted funding programs’ aim is to support investment in information and management technologies for water supply and pollution control, infrastructure building and the maintenance of water courses and adjacent shores (MAOTDR, 2008, article 25).
3. METHODOLOGY
The data on which we rely for this paper was mainly provided by the Portuguese National Water Institute – INAG, which makes available on request its database from the National Inventory of Water Supply and Wastewater Systems (INSAAR). INSAAR periodically collects data on costs, revenues, investments, tariffs, volumes of water supplied and wastewater drained and management type. We have data for the years 1998, 2000, 2002 and 2005 (information on the type of management is for the last two years only, while the investment series has annual information starting in 1987). INSAAR is expected to be updated annually in the future.
Our work will only focus on mainland Portugal, for which reliable data was available at the time of our study7. However, there was still a significant amount of missing data, so we gathered additional information, namely on the volumes supplied and drained and the number of customers served, by directly requesting this information from the more than 300 Portuguese water and wastewater utilities.
Our analysis is made separately for WS systems and for WWDT systems, although the water utility providing them is often the same in each municipality. The analysis also separates retail and bulk water services, using the amount of water supplied/drained to allocate some of the costs faced by the water utility, when necessary.
The reference year for this paper is 2005. This paper updates results published for 2002 by Monteiro (2007). The main methodology followed there is maintained. Namely, the analysis of the evolution of the several indicators considers only those utilities with enough information for the period being analysed.
The calculation of annual investment costs involves the computation of the corresponding annuities from a deflated time-series of investments8, using a 30 year maturity term and a 5% discount rate, which is the value recommended by the European Commission (EC, 2008, p. 14 and 33) for the discount rate to be used in cost-benefit analysis of long-term investment in infrastructures. This value is close to the 5,3% estimated by Evans and Sezer (2005) for the social discount rate in Portugal and similar to the 1987-2005 real profitability rates of long-term
7 Mendes et al. (2006, p. 38) reports the later expansion of INSAAR to the Madeira and Azores
archipelagos.
Portuguese Treasure bonds. Alves and Pinto (2004) also used a 5% discount rate for the economic part of the National Water Plan.
For reasons of statistical secrecy, regional analysis is performed at the NUTS III sub-regional administrative level.
4. BRIEF DESCRIPTION OF WATER AND WATEWATER UTILITIES
The 2005 INSAAR update altered the number of utilities covered by the inventory from 610 (515 with WS services and 326 with WWDT services) to just 319 utilities (293 with WS and 299 with WWDT). The excluded utilities were of very small size, consisting of civil parishes (freguesias) or self-organized neighbourhoods, which seldom reported information anyway. All water utilities responsible for supplying water or draining and treating wastewater in each of the 278 municipal counties of mainland Portugal were kept, as well as all relevant bulk water and wastewater players. Nevertheless, this change makes the results from this paper not strictly comparable with those from Monteiro (2007).
4.1. Nature of the service
Most Portuguese utilities present in INSAAR 2005 simultaneously provide WS and WWDT services (Figure 1). Only 6% were exclusively dedicated to WS and 8% dealt with WWDT only. As expected, 91% of these water utilities provide services directly to the consumer (households, industrial, commercial or agricultural businesses, public entities, among others), while the rest are focused on bulk water provision or wastewater drainage and treatment (6% doing it exclusively and 3% operating on both markets).
Exclusively WS
6% Exclusively WWDT 8%
WS + WWDT simultaneously 86%
Figure 1 - Classification of utilities by the nature of the service provided (2005)
4.2. Type of utility
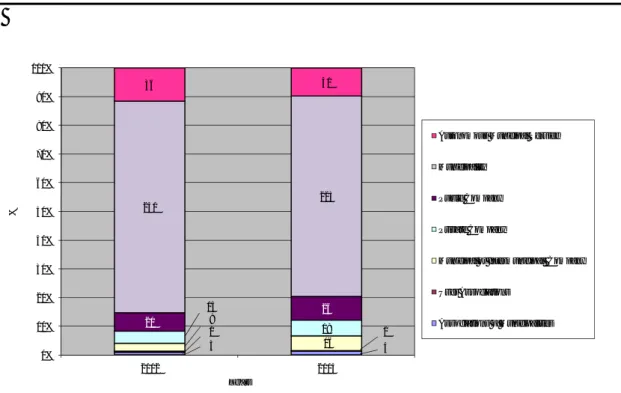
Water utilities have been classified into 7 different types according to their ownership and management (Figure 2). In 2005, 70% of the Portuguese water utilities were municipalities, which have traditionally been providing the service in most cases. This figure is nevertheless down from 74% in 2002, reflecting the slow, but steady tendency for municipalities to create autonomous entities to run the service or to concede it to private operators. This can be also seen from the increasing proportion of municipal companies (3% in 2002, 5% in 2005) and private companies (4% in 2002, 6% in 2005). The increasing number of public companies is mainly due to the creation of bulk water companies by the state-owned holding AdP, together with the municipalities involved.
3 4 1 1 9 16 13 18 20 26 230 223 36 31 0% 10% 20% 30% 40% 50% 60% 70% 80% 90% 100% 2002 2005 % Years
Autonomous Municipal Service
Municipality
Public Company
Private Company
Municipal or Intermunicipal Company
User Associations
Associations of Municipalities
Figure 2 - Type of water utility/management (2002-05)
The different types of water utilities can be found in different locations across the country serving municipal counties with very different population sizes. In a careful analysis, one must, therefore, also look at their relative importance concerning the number of customers9 and the amount of water supplied/drained. The relative weight of municipalities for example, greatly diminishes in all kinds of services once such criteria are taken into account. They are responsible for WS and WWDT services all over the country, but it’s in the smaller rural municipal counties that this type of management arrangement is almost universal. In larger, more urbanized municipal counties, the types of water utilities and management systems are more varied (Figure 3, Figure 4, Figure 5 and Figure 6).
Autonomous municipal services (which have an autonomous management within the municipality, although they are not an independent juridical entity), municipality-owned companies, private and public companies, on the other hand, have a greater importance in retail service if we look at other indicators besides the number os companies of each type, like the number o f customer or the volumes supplied/drained. Although this reflects the growing importance of professional management in the industry, it hasn’t yet implied a trend towards greater privatisation (private companies represented only for 4% of retail WS utilities and 3% in retail WWDT, serving 9% and 8% of customers, respectively).
9 INSAAR uses the concepts of “meter” in WS and “customer” in WWDT to reveal the number of
consumers served (mostly because wastewater is practically never metered). From this point forward, we will consider them equivalent definitions and use the word “customer” only.
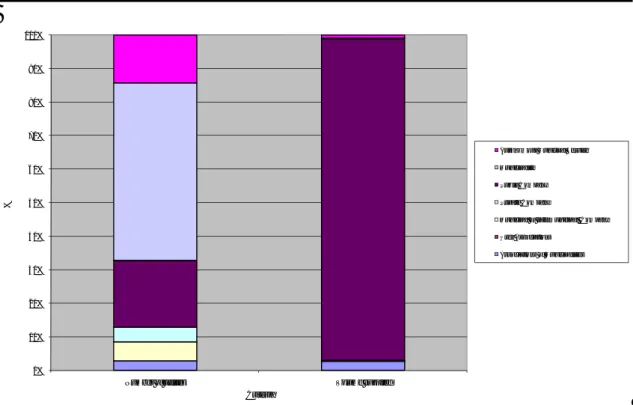
In bulk WS and WWDT the situation is quite different. Public companies dominate the market. They are usually formed with a majority capital share from AdP, the state holding company, and a minority share from the municipalities they are intended to serve. In the ensuing cost analysis to be presented, average values are always weighted by the volume supplied/drained by each water utility. 0% 10% 20% 30% 40% 50% 60% 70% 80% 90% 100%
Number of utilities Number of meters Volume supplied
%
Criteria
Autonomous Municipal Service Municipality
Public Company Private Company
Municipal or Intermunicipal Company User Associations
Associations of Municipalities
0% 10% 20% 30% 40% 50% 60% 70% 80% 90% 100%
Number of utilities Volume supplied
%
Criteria
Autonomous Municipal Service Municipality
Public Company Private Company
Municipal or Intermunicipal Company User Associations
Associations of Municipalities
Figure 4 - Distribution of bulk WS utilities by type (2005)
0% 10% 20% 30% 40% 50% 60% 70% 80% 90% 100%
Number of utilities Number of customers Volume drained
%
Criteria
Autonomous Municipal Service Municipality
Public Company Private Company
Municipal or Intermunicipal Company User Associations
Associations of Municipalities
0% 10% 20% 30% 40% 50% 60% 70% 80% 90% 100%
Number of utilities Volume drained
%
Criteria
Autonomous Municipal Service Municipality
Public Company Private Company
Municipal or Intermunicipal Company User Associations
Associations of Municipalities
Figure 6 - Distribution of bulk WWDT utilities by type (2005)
4.3. Geographical distribution
We now look at how the different types of retail water and wastewater utilities are located across Portugal. Map 1 and Map 2 show that the great majority of the country is served by municipalities. It’s in the more populous urban west coastline (or in some medium-sized inland cities, like district capitals, or in the Algarve, in the south) that we find alternative management arrangements. The traditional alternative was the autonomy of the municipal services within the municipality itself (without creating a distinct juridical entity) with the creation of specific management boards, usually separated from the city council members. In recent years, some municipalities, especially in the more densely populated cities have chosen to create municipal companies to run the services or even to concede it to private operators. This trend is visible in the maps below, even though they only show a 3 year difference. We also find some cases where the water utility is a state-controlled public company, but they have no regional pattern. We found no case of associations of municipalities operating at the retail level. This was expected, because these entities are created to deal with bulk water/wastewater. Recently, the government has been trying to create incentives (through the AdP holding and the management of contracted funding programs) for intermunicipal companies or associations to operate at the retail level, in order to seize economies of scale, but the impact of this policy will only be noticed in the future. It is important to note that some water systems are not confined to the municipal borders, so that Map 1 and Map 2 always consider the predominant operator. Some
water utilities supply two municipalities which have been divided after the system was created. Some systems may supply some population in adjacent counties. Finally, some inframunicipal operators exist, like tourist resorts, user associations, small neighbourhood organizations or civil parishes working under contracts for task decentralization with the municipality.
Map 1 - Geographical distribution of the main retail WS utilities in each municipal county (2002 and 2005)
Map 2 - Geographical distribution of the main retail WWDT utilities in each municipal county (2002 and 2005)
5. COSTS
In this section we look at the water utilities’ cost amount and structure for WS and WWDT systems. Cost information comes from INSAAR 2005, as does the base information for the weights used (number of meters/customers and volumes supplied/drained). As noted earlier, additional information was gathered for the weight variables, in order to reduce the amount of missing data, through direct contacts with all retail water and wastewater utilities. We separate long-term investment costs from operation costs and also consider separately the costs of bulk water purchase/ wastewater drainage, financial outlays and general administrative costs. The data is treated separately for WS and WWDT and for retail and bulk water activities10. Data is for the years 1998, 2000, 2002 and 2005 for all variables, excluding investments, which come from an annual time-series for the period 1987-2005. Where missing data might represent a problem, results are given considering only those utilities with enough information for the
10 Volumes supplied/drained are used as weights to allocate costs between bulk and retail activities when
indicators at hand and for the relevant period being analysed and reporting the proportion of the volume supplied/drained they represent11. All monetary values use constant 2005 prices12.
5.1. Total costs
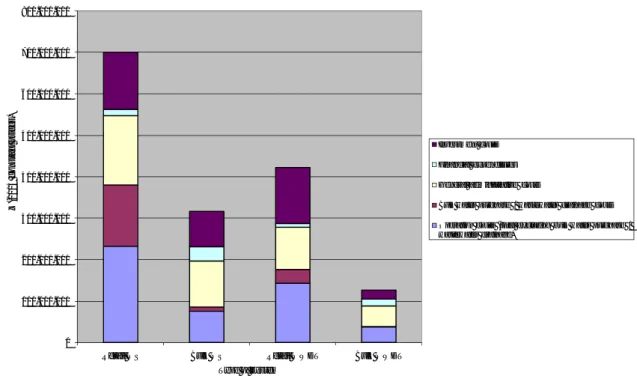
The costs of WS and WWDT systems in Portugal in 2005 amounted to 1566 million Euros. Figure 7 and
Table
1
report the distribution of the different types of costs by the four types of systems (WS and WWDT, bulk and retail).0 100.000.000 200.000.000 300.000.000 400.000.000 500.000.000 600.000.000 700.000.000 800.000.000
Retail WS Bulk WS Retail WWDT Bulk WWDT
€ (2005 c ons tant pr ic es ) Type of system Investment costs Financial expenditures General administrative costs
Bulk water purchase / wastewater drainage costs Operation costs (total excluding bulk water purchase / wastewater drainage)
Figure 7 - Total costs declared for WS and WWDT systems (2005)
The retail level was responsible for the large majority of the costs declared to INAG (72%) especially in WS (
Table
1
). WS represented 65% of the costs, while WWDT accounted for the remaining 35%. Two reasons may explain this difference: the delay in wastewater system expansion and the fact that not all water supplied is returned as wastewater to the sewage system (although in Portugal11 This procedure avoids, for example, the distortion that would be introduced by the fact that small
utilities have lower data reporting levels for the first years under study. The missing data is much less of a problem in the data for customers and volumes than for costs and revenues.
12 We used the deflator for Portuguese GDP at market prices, unit Euro/ECU, supplied by AMECO – Annual
Macroeconomic Database of Directorate General for Economic and Financial Affairs (DG ECFIN) of the European Commission).
the lack of separate sewage systems for urban wastewater and rain water runoff means that it is possible that more water arrives at the wastewater treatment plant than the amount of water supplied).
Investment costs have a significant weight on the cost structure (24%), but the value is not as high as it could be expected (probably due to the fact that dam construction is excluded from the investment data) in an industry which is a flagship for the concept of natural monopoly, due to its capital-intensive nature. Nevertheless, if we add financial outlays like interest rate payments and general administrative costs (which can be considered for the most part as fixed costs), we reach the figure 57% of total costs. Operation costs account for the remaining costs, and it is noticeable that bulk water purchases represent 21% of all costs for retail WS, while wastewater drainage by bulk utilities represent only 8% of the costs of retail operators, reflecting the delay in the implementation of a bulk wastewater system in Portugal. In fact, bulk WS systems represented already 20% of the industry’s costs (31% considering only WS), while bulk WWDT accounted for only 8% (23% considering only WWDT. This delay is also a feature of retail WWDT systems.
Table 1 - WS and WWDT systems’ costs in 2005
€103 Retail WS Bulk WS Retail WWDT Bulk WWDT Total Operation costs (total excluding bulk
water purchase / wastewater drainage) 232.645 75.202 142.840 38.971 489.658
Bulk water purchase / wastewater
drainage costs 147.766 11.085 33.5545 40 192.445
General administrative costs 166.820 109.738 102.021 49.478 428.057
Financial expenditures 14.946 35.565 9.204 16.256 75.971
Investment costs 138.277 85.192 134.442 22.244 380.155
Total 700.455 316.782 422.061 126.989 1.566.28
7 % of total by system type Retail
WS Bulk WS Retail WWDT Bulk WWDT Total Operation costs (total excluding bulk
water purchase / wastewater drainage) 33,2% 23,7% 33,8% 30,7% 31,3%
Bulk water purchase / wastewater
drainage costs 21,1% 3,5% 8,0% 0,0% 12,3%
Financial expenditures 2,1% 11,2% 2,2% 12,8% 4,9%
Investment costs 19,7% 26,9% 31,9% 17,5% 24,3%
Total 100,0% 100,0% 100,0% 100,0% 100,0%
% of total by cost type Retail WS Bulk WS Retail WWDT Bulk WWDT Total Operation costs (total excluding bulk
water purchase / wastewater drainage) 47,5% 15,4% 29,2% 8,0% 100,0%
Bulk water purchase / wastewater
drainage costs 76,8% 5,8% 17,4% 0,0% 100,0%
General administrative costs 39,0% 25,6% 23,8% 11,6% 100,0%
Financial expenditures 19,7% 46,8% 12,1% 21,4% 100,0%
Investment costs 36,4% 22,4% 35,4% 5,9% 100,0%
Total 44,7% 20,2% 26,9% 8,1% 100,0%
5.2. Operation costs
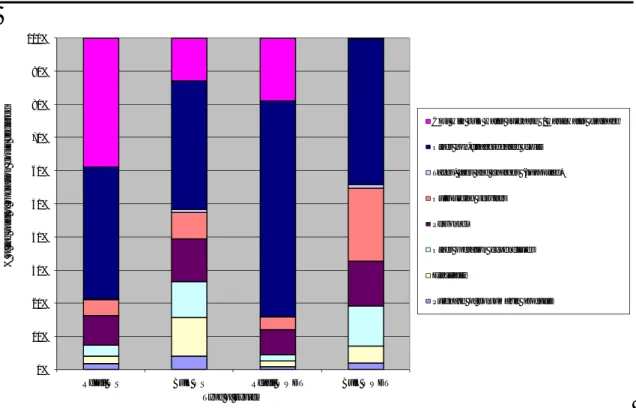
The INSAAR 2005 data made available by INAG enable us to look into the structure of operation costs, although the proportion of those whose disaggregation was not reported by the water utilities is quite significant (Figure 8). Bulk water purchases represent a large proportion of operation costs for retail WS systems (39%). In retail WWDT, on the other hand, bulk operations still stand for only 19% of operation costs. The bulk systems’ cost structure is somewhat different as this kind of expenditures are much less significant, with all other categories like outsourcing services, personnel or electricity having their weight on costs proportionally increased. It is interesting to notice that, even for bulk WS systems, the costs of buying water from other water utilities account for a non-negligible 13% of costs, which may be reflecting the impacts of local/regional water scarcity.
0% 10% 20% 30% 40% 50% 60% 70% 80% 90% 100%
Retail WS Bulk WS Retail WWDT Bulk WWDT
% of t he t o tal o f oper at ion c os ts dec lar ed Type of system
Cost with bulk water purchase / wastewater drainage
Other non-disaggregated costs
Taxes, fees and charges (supported)
Outsourcing services
Personnel
Other operation expenditures
Electricity
Purchase of consumable products
Figure 8 - Distribution of operation costs reported in WS and WWDT (2005)
5.3. Investment costs
The investment time-series and their annual investment costs counterparts (obtained by calculating the corresponding annuities using a 30 year maturity term and a 5% discount rate) show a clear upward trend (Figure 9 and Figure 10). It is hard to point out the exact cause of the temporarily sharp decline in more recent years. It may be due to lack of reporting by the utilities for the years between surveys, but the fact that WS investment is already seen declining for 2002 (a survey year) may suggest that there may be a real cause (beyond the statistical one) for the decline in investment. It may be due to the transition between European structural funds support framework programmes. The 3rd period of European fund support for Portugal terminated in 1999 and the subsequent one was meant for the period 2000-2006, so the decline in investment in the first years of a support framework programme may be something to be expected given the bureaucracy and delays usually associated with the setting up of the program and all the process of opening and deciding applications. In spite of all caution to be taken with these values, the upward trend matches the knowledge of increased public investment in the
Portuguese water industry in recent years13 spurred by large investment programs like PEAASAR 2000-200614. 0 100 200 300 400 500 600 0 50 100 150 200 250 300 1987 1988 1989 1990 1991 1992 1993 1994 1995 1996 1997 1998 1999 2000 2001 2002 2003 2004 2005 In vest im en t: €10^ 6 (2005 co n st an t p ri ces) In ves tm en t cost s: €10^ 6 (2005 co n st an t p ri ces) Years
Annual investment costs Annual investments
Figure 9 - Evolution of investment costs in WS (1987-2005)
13 The upward trend of the investment costs series is mathematically necessary given the 30-year maturity
term considered and the less than 30-year length of the series.
14 PEAASAR - Plano Estratégico de Abastecimento de Água e Saneamento de Águas Residuais [Strategic
Plan for Water Supply and Wastewater Sewage is a government backed plan to support infrastructure building by the industry, within the overall Community Support Framework seizing European structural funds for the period]. A new plan (PEAASAR II) has already been designed and is being implemented for the period 2007-2013 (MAOTDR, 2006).
0 50 100 150 200 250 300 350 400 0 20 40 60 80 100 120 140 160 180 200 1987 1988 1989 1990 1991 1992 1993 1994 1995 1996 1997 1998 1999 2000 2001 2002 2003 2004 2005 In vest im en t: €10^ 6 (2005 co n st an t p ri ces) In ves tm en t cost s: €10^ 6 (2005 co n st an t p ri ces) Years
Annual investment costs Annual investments
Figure 10 - Evolution of investment costs in WWDT (1987-2005)
The distribution of investment between WS and WWDT systems has changed significantly since 1987. In 1987, WS systems received 63% of the investment in the industry, while in 2005 the situation was more balanced with WWDT already comprising 51%. The proportion of the corresponding investment costs in WWDT increased from 38% to 42% during the period.
5.4. Costs per utility and unit costs
We now turn our attention to the cost per utility and the unit costs15 in WS and WWDT systems. We will look into the costs per customer and per cubic meter of water supplied/wastewater drained.
We can see from Figure 11 that, as expected, bulk operators face rather larger costs than retail utilities, with €7,5 million on average for WS and €5 million for WWDT. Wastewater systems face an average total annual cost which is about 2/3 of the corresponding water supply system.
15 The concept of unit cost used here is equivalent to the economic concept of average cost. We calculate
0 1.000.000 2.000.000 3.000.000 4.000.000 5.000.000 6.000.000 7.000.000 8.000.000
Retail WS Bulk WS Retail WWDT Bulk WWDT
€ (2005 c ons tant pr ic es ) Type of system Investment costs Financial expenditures
General administrative costs
Bulk water purchase / wastewater drainage costs
Operation costs (total excluding bulk water purchase / wastewater drainage)
Figure 11 – Average cost per utility in WS and WWDT systems (2005)
Figure 12 shows that the cost of providing the retail WS and WWDT service to a customer is on average €261,6/year (€153,7/year for WS and €107,9/year in WWDT). The difference is probably due to the fact that the population coverage is still insufficient in WW drainage and even lower in WW treatment. According to INAG (2008, p. 22, 44 and 47) while 91% of the population was served by WS in 2006, only 77% had a wastewater drainage system and only 72% were served by wastewater treatment plants.
50,7 35,9 32,0 8,8 37,7 26,6 3,1 2,3 30,2 34,3 0 20 40 60 80 100 120 140 160 180 Retail WS Retail WWDT €/ m et er or c us to m er /y ear ( 2005 c ons ta nt pr ic es ) Type of system Investment costs Financial expenditures
General administrative costs
Bulk water purchase / wastewater drainage costs
Operation costs (total excluding bulk water purchase / wastewater drainage)
Figure 12 – Annual unit cost per customer in retail WS and WWDT systems (2005)
In 2005, in Portugal, supplying 1 m3 of drinking water had an average cost of €1,22, while the drainage and treatment of 1 m3 of wastewater cost €0,91. For WS, the cost for bulk water is significantly lower (€0,79/ m3), which is something to be expected, given the economies of scale that a larger water utility can take advantage of while supplying water to a number of retail operators. Bulk water providers are also expected to maintain a smaller network length, not having to reach every single final customer. Retail operators, on the other hand, buy bulk water and have additional distribution costs on top of that. The situation is more balanced for WWDT where draining and treating 1 m3 of bulk wastewater costs nearly the same (€0,92/ m3) as for retail wastewater. This may be a statistical effect of averaging those retail operators that still have insufficient coverage and treatment levels with the ones which are more advanced in completing the system. As required treatment levels are upgraded for all WWDT utilities we can expect the unit cost of retail WWDT to increase.
The 2006 Annual Report on Water and Waste Industry in Portugal (RASARP) cites “international research, according to which the average service providing cost for 1 m3 of water is around €1, the cost of sewage for 1 m3 of wastewater being significantly lower” (IRAR, 2007, vol.1, p. 32). Our results are similar, only differing in the fact that it is the WS cost which is found to be higher. The higher unit cost for WS may be due to the small size of WS systems in Portugal, something that the government has been trying to change in recent years.
0,40 0,18 0,30 0,26 0,25 0,01 0,07 0,00 0,30 0,28 0,22 0,29 0,02 0,09 0,02 0,14 0,25 0,23 0,29 0,22 0,00 0,20 0,40 0,60 0,80 1,00 1,20 1,40
Retail WS Bulk WS Retail WWDT Bulk WWDT
€/ m 3(2005 c ons tant pr ic es ) Type of system Investment costs Financial expenditures
General administrative costs
Bulk water purchase / wastewater drainage costs Operation costs (total excluding bulk water purchase / wastewater drainage)
Figure 13 – Average unit cost per m3 in WS and WWDT systems (2005)
We can look now at the geographical distribution of unit costs at NUTS III level. The regional distribution of costs per utility follows closely the distribution of the population as expected. The water/wastewater utilities facing the greatest costs are located mainly in the west and south coasts, especially around the two metropolitan areas of Lisbon and Oporto (Map 3).
Map 3 – Average cost per utility in retail WS and WWDT by NUTS III (2005)
Analysing unit costs per customer can be more complex, because lower unit costs can be due to greater efficiency in the service or to the existence of scale economies, but can also be a product of a lower investment in the quality of the service provided, for example in the treatment of drinking water or wastewater before being released into the environment16. Map 4 shows no evident regional pattern.
16 IRAR’s annual reports (IRAR, 2007) provide detailed information on water quality (for all WS utilities)
and water service quality (for concessions). Our suspicion seems to be confirmed by the statement that “Utilities’ performance, regarding sampling frequency failures and mandatory quality parameters failures, still reflects the Portuguese regional development inequalities. Indeed, it’s in the inland regions, with greater lack of human, technical and financial resources, that failures to comply are concentrated, something that hapens mainly in supply zones with less than 5000 inhabitants” (ibid., vol. 4, p. viii). APDA (2006) also reports data on sampling frequency failures and mandatory quality parameters failures.
Map 4 – Average unit cost per customer in retail WS and WWDT by NUTS III (2005)
The same can be said about Map 5, regarding the possible confusion between efficiency and low service quality as reasons for lower costs. Nevertheless, a patter can be found, because unit cost per m3 seems to be higher in the northeast inland part of the country, probably due to the more rugged terrain that can be found in that region or the more diffuse nature of population settlings. Those are hardly the reasons to explain the fact that unit costs are also high in south Alentejo, a plain land with low population density, but with population being concentrated in few villages and cities.
Map 5 – Average unit cost per m3 in retail WS and WWDT by NUTS III (2005)
Map 6 shows the regional distribution of the poputation density (map to the left) and the difference between the maximum and the minimum altitude in each region. I t shows that the greater population density in the west coast of Portugal and the plainer landscape in the west and in the south could be reasons for lower unit costs in these regions.
Map 6 – Population density and altitude variation by NUTS III (2005)
Map 7, on the other hand, presents data from IRAR on water quality indicators and shows that the they are lower in the northern inland part of the country (and in the south of Alentejo), which could result from lower investments in water quality in these regions. These two conflicting trends may explain the mixed results in Map 4 and Map 5.
Map 7 – Water quality indicators: sampling frequency failures and mandatory quality parameters failures by municipality (2005)
We now take a look at the distribution of unit cost by type of utility/management (Table 2). Municipalities are the type of water utilities with fewer costs on average because they are responsible for providing the services of WS and WWDT all over the country, not just in the big cities. They are the predominant type of utility in less densely populated and less urbanized regions. The other types of utilities, which are more commonly found in urban areas are several times larger and therefore face higher total costs.
Municipalities and municipal companies have the lowest unit costs per customer (together with the autonomous municipal services in WWDT), which is something that we would not be expecting if we considered only the possible economies of scale17. However, autonomous municipal services show high unit costs. This prevents us from making any final judgement on the issue of whether a transition towards more professional management and more privatisation of services leads to higher costs or not (and to a correspondingly higher service quality).
17 We do not rigorously assess here if there are economies of scale or not, nor do we try to estimate an
optimal size for the water/wastewater utilities. That kind of analysis for Portugal was done by Martins et al. (2008), who conclude “the industry seems to exhibit economies of scale. There are, therefore, pro-aggregation arguments, especially for small and medium sized local water supply systems” (ibid., p. 23).
Table 2 – Unit cost by type of utility in retail WS and WWDT (2005)
Average cost per utility (2005) (€)
Average unit cost per customer (2005) (€/customer/year)
Average unit cost per m3 (2005) (€/m3) Retail WS Retail WWDT Retail WS Retail WWDT Retail WS Retail WWDT Municipal or Intermunicipal Company 4.999.084 3.768.359 141,8 106,9 0,86 0,74 Private Company 7.526.761 4.628.116 237,5 121,6 1,68 0,89 Public Company 9.156.634 3.310.183 158,5 137,4 1,10 0,66 Municipality 960.250 853.225 115,0 105,2 1,03 0,92 Autonomous Municipal Services 9.262.797 6.015.463 180,9 105,6 1,46 0,98 Total 2.575.230 1.611.120 153,7 107.9 1,22 0,91
5.5. Rates of change in costs
The INSAAR data on costs and revenues is somewhat affected by a non-negligible amount of missing data which requires the calculation of rates of change to be made and interpreted with some caution. For the case of cost totals one must take into account the fact that some years may be lacking more information than others, so that simple rates of change would reflect the entrance and departure of utilities from the database at least as much as the actual change in costs. To prevent this effect we calculate the rates of changes between any two years considering only those utilities which reported data for the two years at hand for the cost category being analysed. The results are qualitatively similar to those obtained if we considered only the utilities which had information for all 4 years, but the amount of utilities/information discarded is much less.
Table 3 presents the results. The overall main result that stands out is the significant real cost increases in all types of systems throughout the period (in 2005 constant prices), reflecting the expansion of the systems that occurred. This can also be seen by the increase in investment
costs18 and financial expenditures19 (subsidies only support part of the investment). In general, the expansion of the bulk water/wastewater systems is already being reflected in the increase in cost with water purchases / wastewater drainage for retail operators. With few exceptions, the several cost categories show very significant real growth.
Table 3 – Average annual rate of change in costs in WS and WWDT 1998-2002
Average annual rate of change (a)
Type of system
Type of costs by system
98-00 00-02 02-05 Operation costs (total excluding bulk water
purchase / wastewater drainage)
4,5% (41%) 1,8% (49%) -2,2% (92%) Bulk water purchase / wastewater drainage
costs 6,5% (48%) 7,9% (67%) 9,1% (46%)
General administrative costs 6,5%
(89%) 79,5% (92%) 13,1% (92%) Financial expenditures 21,0% (27%) -4,9% (29%) 43,7% (88%) Investment costs 11,4% (94%) 10,3% (97%) 0,9% (98%) Retail WS Total costs (b) 11,7% (40%) 12,7% (48%) 3,4% (91%) Operation costs (total excluding bulk water
purchase / wastewater drainage)
82,5% (14%) 5,1% (56%) -4,4% (93%) Bulk water purchase / wastewater drainage
costs 12,9% (89%) 15,3% (96%) -8,6% (15%) Bulk WS
General administrative costs 52,5%
(86%) 290,0% (94%) 13,5% (95%)
18 It is possible that the investment costs’ growth rates are somewhat overestimated due to the fact that
the length of the time series is inferior to the maturity term considered in the calculation of the corresponding annuities.
19 The following cost categories have a significant amount of missing data: Bulk water purchase /
wastewater drainage costs; General administrative costs; Financial expenditures. For this table we only considered the information explicitly reported by the water/wastewater utilities. To keep missing data from preventing the calculation of cost recovery ratios, the rest of the document will follow the assumption that missing data is due to a lack of reporting of null values for these three cost categories and will interpret them as such. We do not follow this procedure here because this would overestimate growth rates for these specific categories of costs. The same procedures are followed in the section for revenues.
Average annual rate of change (a)
Type of system
Type of costs by system
98-00 00-02 02-05 Financial expenditures -19,4% (8%) 1,3% (49%) 50,7% (97%) Investment costs 35,7% (87%) 15,8% (95%) 0,8% (95%) Total costs (b) 61,1% (12%) 13,2% (54%) 5,3% (91%) Operation costs (total excluding bulk water
purchase / wastewater drainage)
16,5% (46%) 11,8% (55%) -7,1% (92%) Bulk water purchase / wastewater drainage
costs 23,6% (11%) 7,8% (11%) 3,0% (21%)
General administrative costs 37,5%
(88%) 67,8% (88%) 14,5% (92%) Financial expenditures 2,4% (23%) 58,8% (26%) 109,5% (78%) Investment costs 19,9% (88%) 15,7% (89%) 2,1% (98%) Retail WW Total costs (b) 19,9% (43%) 27,4% (50%) 1,6% (91%) Operation costs (total excluding bulk water
purchase / wastewater drainage)
-1,6% (84%) -15,4% (60%) -2,4% (70%) Bulk water purchase / wastewater drainage
costs - - -
General administrative costs 27,7%
(99%) 6,2% (66%) 40,2% (70%) Financial expenditures - - 121,1% (70%) Investment costs 11,8% (99%) 11,6% (66%) -1,5% (70%) Bulk WW Total costs (b) 0,3% (84%) 0,2% (60%) 12,0% (70%) (a) The calculated rates of change only consider those utilities for which there is
supplied/drained in the latter year by the utilities being considered in shown in parenthesis)
(b) The utilities considered for the calculation of rates of change for total costs were those which had information on operation and investment costs for the two years under consideration. For the following cost categories we followed the assumption that missing data is due to a lack of reporting of null values interpreted them as such: Bulk water purchase / wastewater drainage costs; General administrative costs; Financial expenditures.
Table
4
and Table 5 show a significant real increase in unit costs throughout the period (with occasional exceptions for WWDT in specific years). This happened in spite of some economies in unit operational costs, especially in more recent years. Investment costs have increased in the beginning of the period, but show a slight decrease in 2002-05 due to the decline in investment in those years (which picked up in 2005). General administrative costs seem to have suffered a widespread increase for all operators. It is also noticeable that the costs with bulk water purchases / wastewater drainage show a steady growth. The representativeness of the results may vary according to the missing data in the database. Overall, the utilities used in the calculation represent a very satisfactory proportion of the market in terms of volumes supplied/drained, but because this may not happen in some specific cost categories in specific years, we show the representativeness of the results (% of volume supplied/drained in the latter year by the utilities being considered) in parenthesis in the tables.Table 4 – Average annual rate of change in per customer unit costs in WS and WWDT 1998-2005
Average annual rate of change (a) Type
of syste
m
Type of costs by system
98-00 00-02 02-05
Operation costs (total excluding bulk water purchase / wastewater drainage)
0,4% (41%) -1,8% (49%) -4,7% (92%) Bulk water purchase / wastewater drainage
costs 3,3% (48%) 4,6% (67%) 6,3% (46%) Retail WS
General administrative costs 2,7%
(89%)
73,9% (92%)
10,2% (92%)
Average annual rate of change (a) Type
of syste
m
Type of costs by system
98-00 00-02 02-05 Financial expenditures 16,6% (27%) -8,2% (29%) 39,9% (88%) Investment costs 7,4% (94%) 6,8% (97%) -1,7% (98%) Total unit cost per customer 7,2%
(40%)
8,8% (48%)
0,7% (91%) Operation costs (total excluding bulk water
purchase / wastewater drainage)
11,7% (45%) 7,3% (54%) -9,7% (91%) Bulk water purchase / wastewater drainage
costs 20,7% (11%) 5,0% (11%) 1,3% (21%)
General administrative costs 32,1%
(87%) 60,9% (87%) 11,6% (91%) Financial expenditures -1,3% (22%) 53,3% (26%) 117,0% (77%) Investment costs 15,3% (87%) 11,9% (88%) -0,7% (97%) Retail WW
Total unit cost per customer 15,1% (42%)
22,4% (49%)
-1,1% (91%) (a) The calculated rates of change only consider those utilities for which there is
information on the cost category for the two years under consideration (the % of volume supplied/drained in the latter year by the utilities being considered in shown in parenthesis)
(b) The utilities considered for the calculation of rates of change for total unit costs were those which had information on operation and investment costs for the two years under consideration. For the following cost categories we followed the assumption that missing data is due to a lack of reporting of null values interpreted them as such: Bulk water purchase / wastewater drainage costs; General administrative costs; Financial expenditures.
Table 5 – Average annual rate of change in per m3 unit costs in WS and WWDT 1998-2005
Type f
98-00 00-02 02-05 Operation costs (total excluding bulk water
purchase / wastewater drainage)
0,6% (41%) -0,9% (49%) -3,4% (92%) Bulk water purchase / wastewater drainage
costs 3,2% (48%) 6,0% (67%) 7,2% (46%)
General administrative costs 1,4%
(89%) 76,0% (91%) 11,7% (92%) Financial expenditures 16,6% (27%) -8,1% (29%) 41,9% (88%) Investment costs 6,1% (94%) 8,0% (96%) -0,4% (97%) Retail WS
Total unit cost per m3 7,5% (40%)
9,8% (48%)
2,1% (91%) Operation costs (total excluding bulk water
purchase / wastewater drainage)
42,7% (14%) -5,7% (56%) -3,6% (93%) Bulk water purchase / wastewater drainage
costs -10,8% (89%) 4,9% (96%) -10,0% (15%)
General administrative costs 19,3%
(86%) 258,0% (93%) 14,2% (91%) Financial expenditures -26,8% (8%) -8,2% (49%) 50,7% (92%) Investment costs 6,7% (86%) 6,6% (94%) 2,1% (91%) Bulk WS
Total unit cost per m3 21,5% (12%)
0,8% (54%)
7,1% (91%) Operation costs (total excluding bulk water
purchase / wastewater drainage)
6,8% (46%) 7,1% (55%) -10,9% (92%) Bulk water purchase / wastewater drainage
costs 12,0% (11%) 7,4% (11%) 2,0% (21%)
General administrative costs 24,8%
(88%) 60,7% (88%) 10,1% (92%) Financial expenditures -3,9% (23%) 47,9% (26%) 99,1% (78%) Retail WW Investment costs 8,9% (88%) 10,7% (89%) -1,4% (98%)
Average annual rate of change (a)
Type of system
Type of costs by system
98-00 00-02 02-05
Total unit cost per m3 9,6% (43%)
22,7% (50%)
-2,9% (91%) Operation costs (total excluding bulk water
purchase / wastewater drainage)
-4,5% (84%) -8,5% (60%) -10,0% (70%) Bulk water purchase / wastewater drainage
costs - - -
General administrative costs 4,0%
(84%) 10,7% (64%) 33,5% (70%) Financial expenditures - - 92,1% (62%) Investment costs -1,0% (84%) 16,1% (64%) -4,8% (69%) Bulk WW
Total unit cost per m3 -2,7% (84%)
8,4% (60%)
9,0% (69%) (a) The calculated rates of change only consider those utilities for which there is
information on the cost category for the two years under consideration (the % of volume supplied/drained in the latter year by the utilities being considered in shown in parenthesis)
(b) The utilities considered for the calculation of rates of change for total unit costs were those which had information on operation and investment costs for the two years under consideration. For the following cost categories we followed the assumption that missing data is due to a lack of reporting of null values interpreted them as such: Bulk water purchase / wastewater drainage costs; General administrative costs; Financial expenditures.
Even though the unit costs are seen to be raising above the inflation rate (probably due to more stringent quality requirements and new investments) the growth rates for unit costs are more moderate than the ones for total costs as can be seen if we compare Table 3 with
Table
4
and Table 5. This reflects some possible economies of scale being seized as the systems expand their coverage and provide higher volumes.In this section we analyse the revenues of Portuguese water and wastewater industry, from the data reported to INSAAR for the period 1998-2005. We will use the same division of the systems into bulk and retail and WS and WWDT. Revenues will be divided into non-tariff and tariff revenues from services provided to the final customers or from transactions between water/wastewater utilities. Investment subsidies will also be taken into account20. Non-tariff revenues (excluding investment subsidies) are exclusive features of retail water operators in the INSAAR database. Unlike the situation for the cost analysis, here all revenues have a clear association with one of the 4 types of systems considered, so that no weighting criterion was needed to distribute them between retail and bulk systems in the cases where the same utility has activity in both.
6.1. Total revenues
The revenues in the WS and WWDT industry in 2005 amounted to €1035 million (Figure 14), a figure well below the one reported for the total costs (Figure 7) as we will see in the section for cost recovery ratios. For now, we will look more carefully into the revenue structure of the industry, which according to INSAAR is mainly comprised of tariff revenues. The weight of non-tariff revenues and investment subsidies in the revenue totals is rather small, although we do suspect that investment subsidies are very understated in the database due to lack of reporting21.
20 Although the INSAAR database does include investment subsidies and we do consider them as revenues
in our analysis, the amounts reported to INSAAR by the water utilities are virtually negligible and do seem to be very far away from the actual level. Investment subsidies are treated here as revenues in the same fashion of investment costs, i.e., they are calculated annuities from the actual investment subsidies time-series using a 30-year maturity term and a 5% discount rate.
21 For example, the total amount of subsidies reported to INSAAR (at current prices) for the period
2000-2005 is around €250 million, while Roseta-Palma et al. (2006) report that € 506,7 million were planned in the Cohesion Fund alone to be applied in the industry’s investments between 2000 and 2006 (ibid., p. 17, table 3). To this value we must add the €621,8 million from the European Regional Development Fund to get a total of €1128,5 million of planned European funds to be applied as investment subsidies in the industry in this period (Portuguese governmental funs would had to these values). We must note that, for the Cohesion Fund, by 2004, although €405,4 million of funding had already been approved, only €86 million had been executed. Nevertheless, if we take into account the fact that the amount of investments reported to INSAAR for the period 2000-2005 reaches €3113 million (current prices) and that the share of European funding on supported investments reached 67% on average (IRAR, 2007, vol. 1, p. 88, table 14), we must take some caution with the data on subsidies reported to INSAAR.
0 100.000.000 200.000.000 300.000.000 400.000.000 500.000.000 600.000.000 700.000.000
Retail WS Bulk WS Retail WWDT Bulk WWDT
€ (200 5 c ons tant p ri c es ) Type of system Investment subsidies Non-tariff revenues Tariff revenues
Figure 14 – Revenues in WS and WWDT systems (2005)
The great majority of the revenues are raised in the WS systems, which account for 74% of all revenues. Retail WS receives 60% of revenues and bulk WS the remaining 14%. On the other hand, WWDT systems receive only 26% of all revenues, 22% in the retail activities and 4% in bulk wastewater. WWDT systems receive 27% of the retail revenues and 23% of the bulk water/wastewater revenues. These are lower proportions for WWDT than we found for the costs, especially in retail activities, which is a first evidence of the existence of cross-subsidization between both activities.
Focusing on the division between retail and bulk water/wastewater activities, we see that the latter account for less than 1/5 of the revenues (18%). The proportion is smaller for WWDT, whose bulk activities represent 16% of the total WWDT revenues while the figure for bulk WS is 19%.
6.2. Tariff revenues
The fixed component of the tariff has a very significant weight on the tariff revenues, especially for WWDT (Figure 15), due to the importance of investment costs for the industry (
Table