UNIVERSIDADE DE LISBOA
FACULDADE DE CIÊNCIAS
DEPARTAMENTO DE BIOLOGIA ANIMAL
Comparative genomic analyses of cyanobacteria
Carolina de Castro Barbosa Rodrigues Barata
Mestrado em Biologia Evolutiva e do Desenvolvimento
Dissertação orientada por:
Acknowledgements
I would like to thank my supervisor Professor Oct´avio Paulo for giving me the opportunity and all the means to work on such an interesting topic. This project has taught me a lot and I enjoyed every minute of it. Data acquisition is hard work and pursuing a career as an Evolutionary Biologist has proved me exactly that.
I thank my supervisor Doctor Elsa Dias, whose kindness and patience showed me that laboratory work is nothing to be afraid of. Coping with disappointing results is far easier if you work alongside good people.
I would also like to thank everyone at Cobig2, especially Francisco Pina-Martins. Everybody’s re-silience was such an inspiration for this past year.
Finally, I thank my family and friends, who have always cheered me up in times of absolute despair and chaos.
Abstract
Cyanobacteria are photosynthetic organisms that can be found in water bodies worldwide. Cyanobac-terial lineage evolution resulted in numerous colour, shape and colony-forming phenotypes. Most cyanobac-teria produce several toxins, but only a few are capable of nitrogen (N2) fixation. Most interestingly, these
bacteria exhibit antimicrobial activity, as well as antibiotic resistance phenotypes. Therefore, it has been suggested that cyanobacteria might harbour several antibiotic resistance (AR) genes. Consequently, it has been hypothesized that these bacteria might play a major role in the dissemination of antibiotic resis-tance phenotypes in microbial communities. Whole-genome sequencing is necessary to fully characterise the genetic basis of such AR phenotypes. In particular, long-read third-generation sequencing methods might help resolve the genomic structure of AR gene containing regions. Horizontally transferred AR genes are often flanked by highly repetitive sequences, not completely resolved by high-throughput next-generation sequencing technologies. Here, we report the use of the portable MinION (Oxford Nanopore Technologies, UK) sequencing device to obtain the genome sequences of six strains of cyanobacteria. Said biological isolates were collected at different time points in freshwater bodies across Portugal. We obtained genome scaffolds for two Microcystis aeruginosa strains. The LMECYA7 scaffold resulted from a hybrid assembly using not only MinION data but also Illumina paired-end reads. The LME-CYA167 genome scaffold represented more than 68% of the reference genome and was entirely built from MinION 1D reads. For both strains, more than one hundred homologous AR gene sequences were found. Among these, fluoroquinolone, beta-lactam and sulfonamide resistance-associated genes were present. Moreover, genome annotation might have unveiled the genetic basis of trimethoprim resistance in the aforementioned cyanobacterial strains. The presence of an alternative folate pathway enzyme (thymidylate synthase, thyX) could fully account for such trimethoprim resistance phenotype. In sum-mary, MinION sequencing allowed us to not only find several homologous AR genes, but also pinpoint the genetic mechanism that is responsible for trimethoprim resistance in two strains of cyanobacteria. Lastly, the process of gDNA extraction requires further optimisation, in order to obtain maximum Min-ION sequencing yield.
Resumo
O presente trabalho teve como objectivo estudar o genoma de 6 (seis) estirpes de cianobact´erias recol-hidas de locais distintos de Portugal continental. Durante a durac¸˜ao do projecto, proposemo-nos a extrair e quantificar DNA gen´omico das estirpes mencionadas para, ent˜ao, procedermos `a sua sequenciac¸˜ao. A posterior an´alise dos dados obtidos focou-se em procurar genes conhecidos de resistˆencia a antibi´oticos bem como outros elementos gen´omicos que possam conferir fen´otipos de resistˆencia a substˆancias an-timicrobianas.
As cianobact´erias s˜ao um grupo de procariotas muito estudado quanto `a sua prevalˆencia em reser-vat´orios de ´agua para consumo humano e animal. A sua importˆancia prende-se no facto de diversas linhagens de cianobact´erias produzirem compostos t´oxicos, nomeadamente microcistinas. Estes com-postos s˜ao nocivos para c´elulas eucari´oticas, podendo mesmo conduzir `a morte dos indiv´ıduos que as ingerem. Para al´em disto, este grupo de organismos apresenta capacidade de fotoss´ıntese oxig´enica, contribuindo para a produc¸˜ao de oxig´enio a partir de compostos orgˆanicos.
Mais recentemente, o papel das cianobact´erias como parte integrante das comunidades de microor-ganismos que habitam ambientes aqu´aticos foi repensado. Estas bact´erias proliferam tanto em ´agua doce como em ´agua salgada e contribuem para o pool gen´etico das comunidades em que se encontram. As cianobact´erias s˜ao capazes de adquirir e partilhar tanto genes como outros elementos gen´omicos, nomeadamente atrav´es de transferˆencia horizontal. A fluidez dos genomas bacterianos sugere que, tal como os restantes genes, os genes de resistˆencia a antibi´oticos s˜ao partilhados pela comunidade micro-biana. Este pool de genes de resistˆencia denomina-se resistoma. Na medida em que as cianobact´erias apresentam fen´otipos de resistˆencia a antibi´oticos, o seu papel no resistoma destas comunidades comec¸a a ser alvo de estudo.
De forma a caracterizar o resistoma de uma comunidade microbiana, ´e necess´ario conhecer todos os genes que possam conferir resistˆencia a determinados antibi´oticos. Para tal, ´e essencial sequenciar o genoma completo dos indiv´ıduos recolhidos. A Estela Sousa e Silva Algae Culture Collection (ES-SACC), actualmente localizada no Instituto de Sa´ude Doutor Ricardo Jorge, e a Blue Biotechnology and Ecotoxicology Culture Collection (LEGE), localizada no Centro Interdisciplinar de Investigac¸˜ao Marinha e Ambiental (CIIMAR), permitem-nos iniciar um estudo de caracterizac¸˜ao do resistoma de mi-croorganismos de ´agua doce em Portugal. Estas colecc¸˜oes incluem amostras de reservat´orios naturais, estac¸˜oes de tratamento de ´aguas residuais e barragens. As amostras caracterizam-se por pertencer a diver-sas esp´ecies com fen´otipos distintos, nomeadamente no que diz respeito a colorac¸˜ao, forma e produc¸˜ao de col´onias.
Ap´os um estudo pr´evio de caracterizac¸˜ao dos fen´otipos de resistˆencia a antibi´oticos de numerosas amostras, 6 estirpes foram escolhidas para este trabalho. Esta selecc¸˜ao teve em conta fen´otipos de re-sistˆencia contrastantes, ou seja, a escolha teve por base estirpes que apresentassem susceptibilidades diferentes para dados grupos de antibi´oticos. Ainda assim, todas as estirpes apresentaram resistˆencia ao trimetoprim e ao ´acido nalid´ıxico. Duas estirpes pertencem `a esp´ecie Microcystis aeruginosa (CYA7 e LMECYA167), outras duas s˜ao classificadas como Plantothrix agardhii (LMECYA269 e LME-CYA280) e as restantes duas como Planktothrix mougeotii (LEGE06226 e LEGE06233).
Quanto `a sequenciac¸˜ao, opt´amos por utilizar o m´etodo de terceira gerac¸˜ao MinION (Oxford Nanopore Technologies, ONT, UK). O pequeno aparelho de sequenciac¸˜ao funciona atrav´es de uma ligac¸˜ao USB 3.0 a qualquer computador port´atil ou desktop. A sequenciac¸˜ao d´a-se atrav´es de um poro que est´a ligado a um transdutor de sinal el´ectrico. A mol´ecula de DNA passa atrav´es do poro e a corrente medida ´e transformada numa sequˆencia de bases. Este m´etodo tem in´umeras vantagens, nomeadamente:
• Permite obter reads longas, na ordem dos milhares de pares de bases (base pairs, bp), o que n˜ao ´e poss´ıvel atrav´es dos m´etodos convencionais de segunda gerac¸˜ao;
• Permite obter sequˆencias a partir de DNA n˜ao amplificado, ou seja, reduz-se a necessidade aumen-tar a quantidade de DNA atrav´es de PCR;
• Permite visualizar o processo de sequenciac¸˜ao em tempo real, no que diz respeito ao rendimento de cada corrida.
Para al´em das vantagens supra referidas, uma das modalidades deste m´etodo permite preparar a bib-lioteca gen´omica para sequenciac¸˜ao em apenas alguns minutos. Contudo, o processo de obtenc¸˜ao do DNA constitui o passo limitante no que diz respeito a uma sequenciac¸˜ao bem sucedida. A qualidade e quantidade de DNA utilizado para a preparac¸˜ao da biblioteca tˆem de obeceder a crit´erios rigorosos. O tamanho dos fragmentos que constituem a biblioteca ´e um outro factor limitante, no sentido em que, quanto mais fragmentado estiver o DNA, mais pequenas ser˜ao as reads obtidas. Portanto, menor ser´a a resoluc¸˜ao do genoma que os dados v˜ao permitir.
Em suma, realiz´amos duas rondas de sequenciac¸˜ao com MinION. Na primeira, procedemos a uma corrida de teste, na qual sequenci´amos DNA de fago lambda, fornecido pela ONT. Sequenci´amos ainda duas bibliotecas de DNA de cianobact´erias, pertencentes `as estirpes LMECYA167 e LEGE06233. O DNA gen´omico de ambas as estirpes foi obtido atrav´es da utilizac¸˜ao de um kit de extracc¸˜ao. Relati-vamente `a segunda ronda de sequenciac¸˜ao, extra´ımos o DNA das 6 estirpes j´a mencionadas atrav´es da realizac¸˜ao de um protocolo de fenol-clorof´ormio. Este protocolo tem como objectivo a obtenc¸˜ao de material gen´etico de elevado peso molecular.
No final de ambas as rondas de sequenciac¸˜ao, conseguimos obter scaffolds dos genomas das duas estir-pes de M. aeruginosa em estudo, isto ´e, das estirestir-pes LMECYA7 e LMECYA167. Os dados obtidos para as restantes estirpes ficaram aqu´em das expectativas, no sentido em que n˜ao permitiram obter cobertura significativa de nenhum dos genomas. A an´alise dos dados de todas as sequenciac¸˜oes revelou que a qual-idade das reads obtidas foi baixa. Os dados foram, ent˜ao, filtrados para que apenas as reads de melhor qualidade fossem assembladas e alinhadas aos respectivos genomas de referˆencia. Por´em, para todas as estirpes do g´enero Planktothrix, a quantidade de reads mapeada contra a referˆencia e, consequentemente, a cobertura obtida foram irris´orias.
Quanto aos scaffolds dos genomas das estirpes de M. aeruginosa, ambas produziram uma sequˆencia consensusmaior que metade do genoma de referˆencia. Assim sendo, procedemos `a an´alise dos potenci-ais genes de resistˆencia a antibi´oticos presentes nas sequˆencias referidas. Tanto em LMECYA7 como em LMECYA167, foram encontrados potenciais hom´ologos de genes associados a resistˆencias. Na maio-ria dos casos, estes genes pertencem a componentes proteicos de bombas de efluxo. Alguns dos outros poss´ıveis genes hom´ologos encontrados surgem associados a resistˆencia a beta-lactˆamicos, quinolonas
e sulfonamidas. Genes de resistˆencia a tetraciclina tamb´em est˜ao presentes na lista de resultados. Fi-nalmente, a anotac¸˜ao dos scaffolds obtidos parece ter permitido entender a base gen´etica da resistˆencia ao trimetoprim. Foram encontrados, nas sequˆencias de ambas as estirpes, genes para um enzima alter-nativo da via metab´olica dos folatos. Esta via ´e essencial `a sobrevivˆencia destes microorganismos e o trimetoprim actua de forma a inibir um dos enzimas da via. Com a presenc¸a de um enzima alternativo, a resistˆencia ao antibi´otico ´e assegurada.
Em conclus˜ao, os dados obtidos atrav´es de sequenciac¸˜ao de terceira gerac¸˜ao permitiram obter scaffolds de dois genomas de cianobact´erias. O processo de sequenciac¸˜ao foi simples, mas limitado pelo relativo sucesso do processo de extracc¸˜ao. A an´alise dos dados tamb´em foi limitada pela actualizac¸˜ao constante dos softwares em actual desenvolvimento. Em ´ultima an´alise, foi poss´ıvel detectar sinais de adaptac¸˜ao no que diz respeito `a evoluc¸˜ao de fen´otipos de resistˆencia a antibi´oticos nas estirpes em estudo.
Contents
1 Introduction 1
1.1 Evolutionary genetics and adaptation . . . 1
1.2 Cyanobacteria as model organisms . . . 1
1.3 Third generation MinION sequencing technology . . . 3
2 Methodology 5 2.1 Cyanobacteria . . . 5
2.2 DNA extraction and sequencing . . . 6
2.3 Data analysis . . . 7
3 Results 9 3.1 First sequencing round . . . 9
3.1.1 Raw read statistics . . . 9
3.1.2 Genome assembly . . . 12
3.1.3 Alignment to reference genome . . . 14
3.2 Second sequencing round . . . 15
3.2.1 Raw read statistics . . . 15
3.2.2 Genome assembly . . . 20
3.2.3 Alignment to reference genome . . . 21
3.3 Genome analysis . . . 23
3.3.1 LMECYA7 hybrid assembly . . . 23
3.3.2 LMECYA167 combined sequencing data . . . 26
4 Discussion 29
5 References 32
List of Figures
1 Read yield during the first sequencing round. i) Lambda phage, ii) LMECYA167 and iii) LEGE06233. . . 10 2 Read quality score distribution for the first sequencing round. i) Lambda phage, ii)
LME-CYA167 and iii) LEGE06233. . . 11 3 Read quality score distribution for the first sequencing round. i) Lambda phage, ii)
LME-CYA167 and iii) LEGE06233. Albacore 2.0.2 basecalled reads. . . 12 4 Lambda phage data assembly GC content pattern along the genome. Albacore 1.2.1
basecalled reads. . . 13 5 Sequencing depth i) along the genome and ii) overall distribution of lambda phage. . . . 14 6 Sequencing depth i) along the genome and ii) overall distribution of lambda phage
Alba-core 2.0.2 basecalled read alignment. . . 15 7 Read yield during the second sequencing round. i) LMECYA7, ii) LMECYA167, iii)
LMECYA269, iv) LMECYA280, v) LEGE06226 and vi) LEGE06233. . . 17 8 Read yield during the LMECYA167 24h sequencing run. . . 17 9 Read quality score distribution for the second sequencing round. i) LMECYA7, ii)
LME-CYA167, iii) LMECYA269, iv) LMECYA280, v) LEGE06226 and vi) LEGE06233. . . . 18 10 Read quality score distribution for the second sequencing round. i) LMECYA7, ii)
LME-CYA167, iii) LMECYA269, iv) LMECYA280, v) LEGE06226 and vi) LEGE06233. Al-bacore 2.0.2 basecalled reads. . . 19 11 Sequencing depth along the genome (left hand-side plots) and overall distribution (right
hand-side plots) of LMECYA7 (i and ii) and LMECYA167 (iii and iv). Alignment per-formed using Albacore 1.2.6 basecalled reads. . . 23 12 Sequencing depth along the genome (left hand-side plots) and overall distribution (right
hand-side plots) of LMECYA7 (i and ii) and LMECYA167 (iii and iv). Alignment per-formed using Albacore 2.0.2 basecalled reads. . . 24 13 Sequencing depth i) along the genome and ii) overall distribution of LMECYA7 hybrid
assembly alignment to the reference genome. Alignment performed using Albacore 2.0.2 basecalled reads. . . 25 14 Sequencing depth i) along the genome and ii) overall distribution of LMECYA167
com-bined data. . . 28 15 Sequencing depth i) along the genome and ii) overall distribution of LMECYA167
com-bined data. Alignment performed using Albacore 2.0.2 basecalled reads. . . 28 16 Circular representation of the LMECYA167 combined data scaffold genome. The blue
ring corresponds to the mapping coverage along the genome. The orange ring repre-sents all the coding sequences found in LMECYA167 genome scaffold by the RAST annotation tool. . . 29 S1 Pore occupancy during the first sequencing round. i) Lambda phage, ii) LMECYA167
and iii) LEGE06233. . . 37 S2 Pore occupancy during the second sequencing round. i) LMECYA7, ii) LMECYA167,
iii) LMECYA269, iv) LMECYA280, v) LEGE06226 and vi) LEGE06233. . . 38 S3 Pore occupancy during the LMECYA167 24h sequencing run. . . 39 S4 Read length during the first sequencing round. i) Lambda phage, ii) LMECYA167 and
S5 Read length during the second sequencing round. i) LMECYA7, ii) LMECYA167, iii) LMECYA269, iv) LMECYA280, v) LEGE06226 and vi) LEGE06233. . . 40 S6 Read length during the LMECYA167 24h sequencing run. . . 41 S7 Lambda phage quality score versus read length plots. Albacore 1.2.1 basecalled reads. . 42 S8 LMECYA167 quality score versus read length plots. Albacore 1.2.1 basecalled reads. . 43 S9 LEGE06233 quality score versus read length plots. Albacore 1.2.1 basecalled reads. . . 44 S10 Lambda phage quality score versus read length plots. Albacore 1.2.1 basecalled reads. . 45 S11 LMECYA167 quality score versus read length plots. Albacore 1.2.1 basecalled reads. . 46 S12 LEGE06233 quality score versus read length plots. Albacore 1.2.1 basecalled reads. . . 47 S13 LMECYA7 quality score versus read length plots. Albacore 1.2.6 basecalled reads. . . . 48 S14 LMECYA167 quality score versus read length plots. Albacore 1.2.6 basecalled reads. . 49 S15 LMECYA269 quality score versus read length plots. Albacore 1.2.6 basecalled reads. . 50 S16 LMECYA280 quality score versus read length plots. Albacore 1.2.6 basecalled reads. . 51 S17 LEGE06226 quality score versus read length plots. Albacore 1.2.6 basecalled reads. . . 52 S18 LEGE06233 quality score versus read length plots. Albacore 1.2.6 basecalled reads. . . 53 S19 LMECYA7 quality score versus read length plots. Albacore 2.0.2 basecalled reads. . . . 54 S20 LMECYA167 quality score versus read length plots. Albacore 2.0.2 basecalled reads. . 55 S21 LMECYA269 quality score versus read length plots. Albacore 2.0.2 basecalled reads. . 56 S22 LMECYA280 quality score versus read length plots. Albacore 2.0.2 basecalled reads. . 57 S23 LEGE06226 quality score versus read length plots. Albacore 2.0.2 basecalled reads. . . 58 S24 LEGE06233 quality score versus read length plots. Albacore 2.0.2 basecalled reads. . . 59 S25 Lambda phage data assembly GC content pattern along the genome. Albacore 2.0.2
basecalled reads. . . 60 S26 Sequencing depth along the genome (left hand-side plots) and overall distribution (right
hand-side plots) of LMECYA269 (i and ii) and LMECYA280 (iii and iv). . . 61 S27 Sequencing depth along the genome (left hand-side plots) and overall distribution (right
hand-side plots) of LEGE06226 (i and ii) and LEGE06233 (iii and iv). . . 62 S28 Sequencing depth along the genome (left hand-side plots) and overall distribution (right
hand-side plots) of LMECYA269 (i and ii) and LMECYA280 (iii and iv). Alignment performed using Albacore 2.0.2 basecalled reads. . . 63 S29 Sequencing depth along the genome (left hand-side plots) and overall distribution (right
hand-side plots) of LEGE06226 (i and ii) and LEGE06233 (iii and iv). Alignment per-formed using Albacore 2.0.2 basecalled reads. . . 64
List of Tables
1 MICs of all six strains of cyanobacteria. AMX: amoxicillin, CAZ: ceftazidime, CRO: ceftriaxone, KAN: kanamycin, GEN: gentamicin, STR: streptomycin, NOR: norfloxacin,
NAL: nalidixic acid, TET: tetracycline, TMP: trimethoprim . . . 5
2 First sequencing round: Raw read statistics . . . 9
3 First sequencing round: Raw Albacore 2.0.2 basecalled read statistics . . . 11
4 First sequencing round: Assembly statistics . . . 13
5 First sequencing round: Assembly statistics (Albacore 2.0.2 basecalled reads) . . . 14
6 First sequencing round: Bowtie2 alignment statistics . . . 14
7 First sequencing round: NGMLR alignment statistics of Albacore 2.0.2 basecalled reads 15 8 Second sequencing round: Albacore 1.2.6 basecalled read statistics . . . 16
9 Second sequencing round: Albacore 2.0.2 basecalled read statistics . . . 20
10 Second sequencing round: Assembly statistics . . . 20
11 Second sequencing round: Assembly statistics (Albacore 2.0.2 basecalled reads) . . . 21
12 Second sequencing round: GraphMap alignment statistics . . . 21
13 Second sequencing round: NGMLR alignment statistics . . . 21
14 Second sequencing round: NGMLR alignment statistics with Albacore 2.0.2 basecalled reads . . . 22
15 LMECYA7 hybrid assembly statistics . . . 24
16 LMECYA7 hybrid assembly alignment statistics . . . 25
17 LMECYA7 hybrid assembly alignment statistics (Albacore 2.0.2 basecalled reads) . . . 25
18 LMECYA167 combined sequencing data assembly statistics . . . 26
19 LMECYA167 combined sequencing data alignment statistics . . . 27
20 LMECYA167 combined sequencing data alignment statistics (Albacore 2.0.2 basecalled reads) . . . 27
S1 Quality and quantity assessment of gDNA stock samples . . . 37
S2 LMECYA7 hybrid assembly alignment consensus RGI tool hits. . . 65
1
Introduction
1.1 Evolutionary genetics and adaptation
Understanding causes and patterns of evolution across the tree of life can prove difficult. However, re-searchers are now able to accurately describe the evolutionary history of numerous groups of organisms. Tracking events that happened in the past of a given lineage is possible by analysing its genome. The evolution of genomes is shaped by mutation, selection and drift. Third generation sequencing methods are powerful tools for the study of such phenomena.
It has been long since researchers found that selection can contribute to the evolution of populations only if there is variance in fitness among the individuals (Fisher, 1930). Different combinations of advantageous and deleterious alleles generate such variance (Felsenstein, 1974). Accordingly, selection can cause allele frequency shifts in order to allow populations to adapt. However, in finite populations, genetic draft has to overcome the effects of genetic drift to be successful at causing adaptation. Evidence of population adaptation has been found in both model and non-model organisms from single gene analyses (Mundy, 2005; Hoekstra et al., 2006) to whole-genome scans (Bennett and Lenski, 2007; Sattath et al., 2011; Silva et al., 2015).
1.2 Cyanobacteria as model organisms
This project aims at detecting signatures of ecological adaptation by studying the main genomic fea-tures of six strains of cyanobacteria collected in different waterbodies across Portugal. Cyanobacteria are a group of photosynthetic bacteria. Their origin is thought to have occurred approximately 2.5 billion years ago (Altermann and Kazmierczak, 2003). Ever since, cyanobacteria have evolved to occupy nu-merous ecological niches exhibiting a plethora of morphological and physiological adaptations, as well as specific genomic features (Hess, 2011). These microorganisms range from unicellular to colonial and filamentous forms. They are even capable of nitrogen (N2) fixation in specialised cells called heterocysts
(Karl et al., 2002). Only filamentous colonies produce such cells. The ability to fix atmospheric N2
is referred to as diazotrophy, which was be proposed to be an ancestral trait of the prokaryote lineage (Stucken et al., 2010). In a 2006 study, Tomitani et al. found that diazotrophy is polyphyletic in 20 spp of cyanobacteria, indicating that this trait was present in the last common ancestor of such lineages. More-over, cyanobacteria are known to thrive in both freshwater and marine ecosystems and to occupy benthic and planktonic niches.
Cyanobacteria are found in water bodies worldwide associated with harmful algal blooms (HABs). HABs consist of not only cyanobacteria but also microscopic algae. These particular blooms of microor-ganisms have been extensively studied since they cause both human and animal disease and even death. Such toxic blooms have been described for more than 100 years (Francis, 1878). Although cyanobacte-rial blooms can be a human and livestock health hazard, particular secondary metabolites produced by cyanobacteria bear great pharmaceutical and biotechnological potential (Hess, 2011). Accordingly, and as primary producers, cyanobacteria play a major role in aquatic ecosystems. Understanding the evolu-tionary and ecological history of the cyanobacterial lineage using novel genome sequencing methods is, thus, increasingly compelling.
Cyanobacteria are capable of producing different types of toxins, such as neurotoxins and hepatotox-ins. Of the latter, microcystins (MCs) are a well-studied group of toxic cyclic peptides (Tillett et al., 2000) which are produced by a diverse range of cyanobacteria (Rinehart et al., 1994; Sivonen, 1996). MCs are potent inhibitors of eukaryotic protein phosphatases. These toxins are actively transported into vertebrate hepatocytes causing permanent damage (Eriksson et al., 1990). MCs and other cyanobacterial peptides are produced via nonribosomal peptide synthases (NRPSs). NRPS gene clusters have been stud-ied and characterised in several genera of cyanobacteria (Calteau et al., 2014), namely in Planktothrix (Rounge et al., 2009).
The microcystin-producing mcy gene cluster has been described in at least three orders of cyanobac-teria, Chroococales, Nostocales and Oscillatoriales (Jungblut and Neilan, 2006). The mcy gene cluster of a Microcystis aeruginosa strain (Chroococales) was characterised in detail in 2000 by Tillett et al. Later, Kurmayer et al. (2005) studied said cluster in 17 Planktothrix strains (Oscillatoriales). Moreover, researchers have found evidence of purifying selection on the mcy genes across the cyanobacterial lin-eage, namely low KA/KS(Rantala et al., 2004) and dN/dSratios (Kurmayer and Gumpenberger, 2006).
In a more recent study, Kurmayer et al. (2015) performed a phylogenetic analysis of 138 Planktothrix strains from distinct geographical origins. All the strains contained at least remnants of the cluster and a non-polarised McDonald-Kreitman test revealed no evidence of selection acting on mcy genes.
Based on evidence for fitness effects of MC production, authors have suggested several putative roles for these toxins. In both Planktothrix (Briand et al., 2008) and Microcystis (Schatz et al., 2007) genera, the benefits of producing the toxin have been shown to outweigh the costs under growth-limiting con-ditions. Moreover, under limiting light and temperature conditions, MC-producing strains had greater fitness. Thus, a strain that produces MCs has a selective advantage that allows it to thrive in its microbial community. Accordingly, MCs were suggested to play a role in light adaptation processes (Hesse et al., 2001) and siderophoric scavenging of trace metals (Rantala et al., 2004), as well as intraspecies commu-nication (Schatz et al., 2007) and quorum-sensing (Kaebernick and Neilan, 2001). MC production might also play a part as a feeding deterrent or in cell-to-cell signaling and gene regulation. Contrastingly, in P. agardhii strains, researchers were able to associate insertion sequence (IS) elements, which are a type of transposable element (TE), to the inactivation or recombination of cyanotoxin production genes (Christiansen et al., 2014). Although the link between toxicity and specific environmental cues remains unclear, the role of natural selection seems to be key in the diversification of toxic and non-toxic strains of cyanobacteria.
The genomes of cyanobacteria are highly variable and plastic (Rocha, 2006). This is mostly due to a phenomenon known as Horizontal Gene Transfer (HGT). HGT is mostly caused by three distinct processes: transformation, when bacteria uptake environmental DNA; conjugation of DNA via cell-cell communication; and transduction, as a result of infection by lysogenic phages. In an effort to find a cyanobacterial core genome, Shi and Falkowski (2008) found that more than 52% of orthologous genes were susceptible to HGT within 13 species of cyanobacteria. In a 2003 study, Rocap et al. were also able to find evidence of HGT in 2 strains of Prochlorococcus. Similarly, 11% of genes were found to be the result of recent transfer events among 12 strains of M. aeruginosa (Humbert et al., 2013). HGT events can range from gene fragments, to complete genes and even whole operons. For instance, Tooming-Klunderud et al. (2013) found evidence of HGT of the phycoerythrin gene cluster between
Planktothrixstrains through homologous recombination. Thus, HGT allows cyanobacterial populations to adapt quicker to varying environmental conditions.
Recently, environmental microbial communities have been suggested to be important reservoirs for antibiotic resistance (AR) genes (Manageiro et al., 2014; Amos et al., 2014). It has also been suggested that cyanobacteria might play a role in the environmental resistome, i.e. the pool of AR genes found in such microbial communities. Accordingly, some species of cyanobacteria exhibit antibacterial activity (Wright, 2007) as well as resistance to a few antibiotics, such as ampicilin and penicilin (Prasanna et al., 2010). Furthermore, in 2015, Dias et al. studied antibiotic susceptibility of cyanobacteria belonging to the Estela Sousa e Silva Algae Culture Collection (ESSACC). Susceptibility was assessed for Aphani-zomenon gracile, Chrisosporum bergii and Planktothrix agardhii as well as 9 Microcystis aeruginosa strains. Cell growth was followed over time. All strains exhibited highest susceptibility to β-lactams. Additionally, no isolates were susceptible to trimethoprim or nalidixic acid.
Consequently, researchers are working towards finding the genetic basis of AR in cyanobacteria. Plas-mids and other mobile genetic elements, such as TEs, have been proposed to determine AR (Bennett, 2009; Chen et al., 2008). Said genomic elements are required for HGT to happen. Thus, cyanobacte-ria must bear AR genes because both plasmids and TEs have been successfully found in cyanobactecyanobacte-rial genomes (Christiansen et al., 2008). Furthermore, HGT has been shown to allow for the quick spread of numerous genomic features between strains of bacteria (Davies, 1994; Marti et al., 2013; Huddleston, 2014; Jiao et al., 2017). However, scientists are yet to accurately describe how does this process facilitate the spread of AR genes among cyanobacteria.
1.3 Third generation MinION sequencing technology
In the early 1990’s, bacterial whole-genome sequencing revealed thousands of new genes as well as a major role for HGT in generating genetic diversity. Comparative genomics began to tell core and pan genomes apart by reporting genes present in all strains within a taxonomic group versus the entire set of genes that characterise such taxon. Later on, high-throughput next-generation sequencing methods generated SNP-based phylogenies of bacterial lineages. Moreover, reconstructing transmission chains and characterising within-patient pathogen diversity became feasible. As of 2010, third-generation real-time sequencing technologies, such as Pacific Biosciences’ SMRT and Oxford Nanopore Technologies’ MinION, promised to revolutionise whole-genome data acquisition (Lu et al., 2016). Both sequencing devices are able to produce much longer reads in comparison to next-generation technologies. Third-generation sequencing reads are tens of thousand base-pairs long. Moreover, no fragment amplification is required and, consequently, no sequencing biases from PCR amplification are produced. Additionally, sequencing time is drastically reduced from days to hours.
MinION is a highly portable device that connects to a laptop or desktop computer via a USB 3.0 port. DNA is loaded into a consumable flow cell and directly sequenced. Each flow cell contains up to 2048 nanopore channels connected to 512 signal amplifiers. All nanopores are inserted in a silicon membrane and contain a platinum electrode at the base of the well. The nanopore signal is processed by device-management software MinKNOW. During an experiment, a customisable Python script controls the device and the flow cell. A DNA molecule is sequenced as it goes through the pore. In turn, the amplifier channel records the current signal over time. Varying voltage should be the result of different
nucleotides passing through the nanopore. In contrast to all other sequencing technologies, MinION is able to produce reads of virtually unlimited length. Since a DNA molecule is directly sequenced as it goes through the channel, read length is sole function of the molecule’s initial size. Thus, ONT’s nanopore technology might help resolve the sequence of highly repetitive genomic regions.
Despite numerous advantages, MinION whole-genome sequencing is hindered by high error rates and homopolymer under-representation. Because nanopore readings exhibit high stochastic variability, MinION error rates are not negligible. Rate estimation is usually based on sequence identity to either a reference genome or Illumina reads. Over the years, flowcell chemistry improvements and management software updates have resulted in greater sequence identity. Reported raw read error rates are as high as 38.2%, for R6 chemistry flowcells (Laver et al., 2015), and as low as 8%, for R9.4 chemistry flowcells (Ben´ıtez-P´aez and Sanz, 2017). Other studies estimate error rates between 25-17.2% and 14.8-11% for R7.3 and R9 flowcells, respectively (Istace et al., 2016; Jansen et al., 2017). Moreover, MinION raw reads exhibit substantial misrepresentation of homopolymers, i.e. repeats of identical nucleotides (Lu et al., 2016). Basecalling software implements a maximum k-mer length. Therefore, it might overlook homopolymer sequences that are longer than such k-mer size. This could have an impact on genome size estimation, overall GC content and repetitive sequence resolution.
MinION data publication list is increasing exponentially since 2016. For instance, MinION sequenc-ing has proved useful for metagenomic studies. In a 2016 paper, Edwards et al. used nanopore technology to characterise the microbiota of a High Arctic glacier. Additionally, Brown et al. (2017) tested the ability of correctly assigning taxonomy from MinION data in both synthetic bacterial communities and single species runs. Furthermore, several bacterial genomes, such as Escherichia coli’s (Jain et al., 2017) and Staphylococcus aureus’ (Bayliss et al., 2017), were sequenced using MinION. Some eukaryotic genomes were also MinION sequenced, namely Saccharomyces cerevisiae yeast (Istace et al., 2016; Giordano et al., 2017). Notably, the genome sequences of a few animal and plant species have been obtained us-ing nanopore technology, for example the European eel (Anguilla anguilla) (Jansen et al., 2017), wild tomato (Solanum pennelli) (Schmidt et al., 2017b) and thale cress (Arabidopsis thaliana) (Michael et al., 2017). Lastly, researchers have used MinION data to identify and characterise antibiotic resistance genes (Ashton et al., 2014; Ludden et al., 2017; Schmidt et al., 2017a).
This work aims to unveil signatures of population adaptation from genome sequencing data of six cyanobacterial strains, belonging to three species - Microcystis aeruginosa, Planktothrix agardhii and Planktothrix mougeotii. Using ONT’s MinION third-generation sequencing technology, we focused on obtaining good quality whole-genome sequences. We worked towards identifying the main genomic features that allow different cyanobacterial strains to exhibit antibiotic resistance phenotypes.
2
Methodology
2.1 Cyanobacteria
The strains of cyanobacteria used throughout this work belong to the Estela Sousa e Silva Algae Culture Collection (ESSACC) from Instituto de Sa´ude Doutor Ricardo Jorge (Paulino et al., 2009), and the Blue Biotechnology and Ecotoxicology Culture Collection (LEGE) from Centro Interdisciplinar de Investigac¸˜ao Marinha e Ambiental (Martins et al., 2010). The strains were isolated from freshwater bodies across Portugal with numerous geographical/usage characteristics. All strains were phenotipically characterised and their phylogenetic relationship was previously inferred (Val´erio et al., 2009). Each isolate is maintained in Z8 medium as a monoalgal, free of eukaryotes, non-axenic stock culture. The laboratory culture chamber is kept in a 14/10 h L/D cycle (light intensity 16 ± 4 µEm-2s-1, approx.) at 20±1◦C.
Four ESSACC and two LEGE strain genomes belonging to two different genera were sequenced dur-ing the course of this work. ESSACC strains are referred to as LMECYA strains. The LMECYA7 and LMECYA167 strains belong to the Microcystis aeruginosa species and were first isolated in the rural freshwater reservoirs of Montargil (1996) and Corgas (2001), respectively. The remaining four strains belong to the Planktothrix genus. LMECYA269 was collected from the Magos reservoir in 2009, while LMECYA280 was collected from the S˜ao Domingos reservoir in 2012. Both strains are Planktothrix agardhiiisolates. Finally, LEGE06226 and LEGE06233 belong to the Planktothrix mougeotii species and were isolated from the Febros waste water treatment plant in 2006 and 2007, respectively.
The strains were chosen based according to antibiotic susceptibility phenotypes, particularly the Min-imum Inhibitory Concentration (MIC). In this case, cell growth was determined by optical density mea-surements (450 nm) of the antibiotic exposed cultures, relatively to control cultures (not exposed to antibiotics). Furthermore, culture integrity was followed by microscopic examination and each MIC es-timate corresponds to the absence of undamaged cyanobacterial cells. MICs were previously obtained for a set of at least 9 different antibiotics for all six strains (Dias et al., 2015). A detailed description of all antibiotics and corresponding MICs can be found in table 1. Lowest MICs correspond to highest susceptibility.
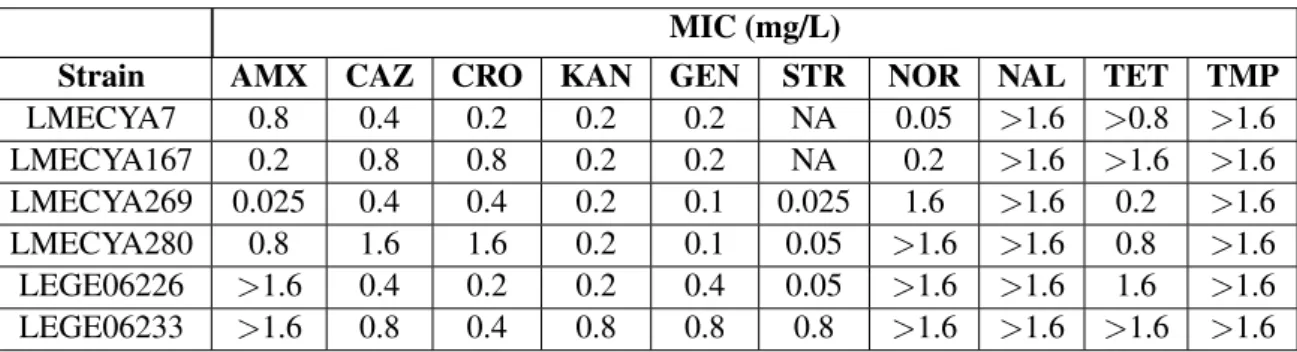
Table 1: MICs of all six strains of cyanobacteria. AMX: amoxicillin, CAZ: ceftazidime, CRO: ceftriaxone, KAN: kanamycin, GEN: gentamicin, STR: streptomycin, NOR: norfloxacin, NAL: nalidixic acid, TET: tetracycline, TMP: trimethoprim
MIC (mg/L)
Strain AMX CAZ CRO KAN GEN STR NOR NAL TET TMP
LMECYA7 0.8 0.4 0.2 0.2 0.2 NA 0.05 >1.6 >0.8 >1.6 LMECYA167 0.2 0.8 0.8 0.2 0.2 NA 0.2 >1.6 >1.6 >1.6 LMECYA269 0.025 0.4 0.4 0.2 0.1 0.025 1.6 >1.6 0.2 >1.6 LMECYA280 0.8 1.6 1.6 0.2 0.1 0.05 >1.6 >1.6 0.8 >1.6 LEGE06226 >1.6 0.4 0.2 0.2 0.4 0.05 >1.6 >1.6 1.6 >1.6 LEGE06233 >1.6 0.8 0.4 0.8 0.8 0.8 >1.6 >1.6 >1.6 >1.6
2.2 DNA extraction and sequencing
We used the Oxford Nanopore Techologies (ONT, UK) sequencing platform, MinION, to sequence the genomes of the six cyanobacterial strains previously chosen. Two sequencing rounds were performed. For the first, genomic DNA of strains LMECYA167 and LEGE06233 was extracted using the MO BIO Laboratories, Inc. PowerWater DNA Isolation Kit. The biomass for DNA extraction was obtained from 20 mL of cyanobacterial cultures in exponential growth phase were centrifuged for 5 minutes at 2000xg. Extracted DNA was concentrated using SpeedVac for an average of 35 minutes at medium heat. DNA quality and concentration were assessed using a Nanodrop spectrophotometer (ND-1000) and a Qubit 2.0 fluorometer (dsDNA High Sensitivity assay, Life Technologies). A maximum of 200 ng cyanobacterial DNA was used for library preparation. Sequencing library preparation was carried out using the Rapid Sequencing Kit SQK-RAD002 for the two LMECYA strains and the lambda phage DNA provided in the kit. The libraries were loaded into a MinION R9.5 flow cell on a MinION MK 1B controlled by Min-KNOW software version 1.6.11. Lambda phage sequencing ran on a with a 6hr run plus Basecaller.py workflow. Both LMECYA167 and LEGE06233 gDNA was sequenced by running a 48-hour run plus Basecaller.py workflow. However, data acquisition was stopped after 12 and 18 hours for LMECYA167 and LEGE06233, respectively. Live base calling was performed using the ONT EPI2ME Agent version 2.47.537208. The flow cell was washed between sequencing runs using the ONT Wash Kit WSH-002 and kept at 4◦C overnight.
For the second sequencing round, DNA of all six cyanobacterial strains was extracted using a high molecular weight DNA extraction protocol (Sambrook and Russell, 2001) modified by Jain et al. (2017). Cyanobacterial cells were collected from exponential growth phase cultures into Falcon tubes. Between 15-60 mL of cultured cells were spun for at least 10 minutes at 2000xg in order to pellet. The supernatant was removed and the cells were resuspended in 100 µL PBS. Ten (10) mL of TLB (10 mM Tris-HCl pH 8.0, 25 mM EDTA pH 8.0, 0.5% (w/v) SDS, 20 µg/mL Roche Diagnostics RNase A) were added to the resuspended cells. Each Falcon tube was incubated at 37◦C for 1 hour. Afterwards, 50 µL of Roche Diagnostics Proteinase K (at a 20 mg/mL stock concentration) were added. The tubes were gently mixed end-over-end 10 times and then incubated at 50◦C for 3 hours. After 1 and 2 hours, all tubes were gently rotated end-over-end. After incubation, 10 mL of buffer saturated phenol (Sigma, phenol solution for molecular biology) were added to each tube, which were placed on a rotator for 15 minutes. The tubes were spun at 2000xg for 15 minutes. Then, the aqueous phase was carefully transferred into a clean Falcon tube. We added 5 mL of buffer saturated phenol followed by 5 mL of chloroform. The tubes were rotated again and then spun down for another 15 minutes. The aqueous phase was removed and poured into a new tube. A second chloroform wash was carried out for strains LMECYA269 and LMECYA280. In order for the DNA to precipitate, 4 mL of 5 M ammonium acetate and 30 mL of 100% ice-cold ethanol were added to each tube, which were rotated end-to-end 10 times. Using a sterile plastic hook, we tried to recover as much DNA as possible. However, it proved difficult to recover a significant amount of DNA from most of the tubes. Therefore, we left the 100% ethanol containing tubes at -20◦C for 8 hours followed by 1 hour at -80◦C. LMECYA269 and LMECYA280 gDNA tubes did not require said freezing step. Then, the tubes were spun down and the pellets were washed twice in 70% ethanol containing Eppendorf tubes. After spinning down at 10000xg, the 70% ethanol was removed and the tubes were placed on a heat block for at least 4 hours. One hundred and fifty (150) µL of 10 mM Tris-HCl (pH 8.5) were added to each tube. All tubes were left for 13 hours at 4◦C and then stored at -20◦C.
Two R9.5 chemistry flow cells were used for the sequencing step. DNA quality and quantity were as-sessed using Nanodrop, Qubit and Fragment Analyzer (PROSize 2.0, Advanced Analytical Technologies, Inc.). The six gDNA libraries were prepared using the SQK-RAD003 Rapid Sequencing kit. Reagent and gDNA volumes were adjusted as follows: 15 µL gDNA, 5 µL FRA, 1 µL RPD, 30.5 µL RBF, 16.5 µL LLB and 7 µL NFW. At least 400 ng of gDNA were used for library preparation. Custom MinKNOW (version 1.7.10) scripts allowed us to perform 8-hour sequencing runs with live basecalling and to adjust the initial voltage at the start of each run. The flowcells were washed using EXP-WSH002 and stored for 3 hours between sequencing runs. Moreover, we prepared and sequenced an additional LMECYA167 library using a SQK-RAD002 Rapid Sequencing kit. Library preparation was carried out according to (Jain et al., 2017). Reads were obtained during a 24-hour sequencing run. The genome of LMECYA7 was obtained using both the MinION platform and Illumina MiSeq paired-end sequencing methods. The Illumina dataset was produced by the Laborat´orio Nacional de Referˆencia das Resistˆencias aos Antimi-crobianos e Infec¸˜oes Associadas aos Cuidados de Sa´ude (LNR-RA/IACS) along with the Unidade de Tecnologia e Inovac¸˜ao of Instituto Nacional de Sa´ude Doutor Ricardo Jorge.
2.3 Data analysis
Basecalling was performed using Albacore (versions 1.2.1 and 1.2.6, ’read fast basecaller.py’ script) for all MinION ’pass’ reads. Albacore 2.0.2 was also used to rerun basecalling. All fastq files were produced by Albacore. Fasta files were extracted from MinION fast5 data files using Poretools (avail-able at https://poretools.readthedocs.io/en/latest/), version 0.6.0 (Loman and Quinlan, 2014). More-over, Poretools computes raw read statistics, including minimum, maximum and median length, and produces additional run yield and pore occupancy plots. Read quality versus read length plots were obtained using NanoPlot (available at https://github.com/wdecoster/NanoPlot). Quality score distri-butions were computed by Poretools. Adapter sequences were removed by Porechop (available at https://github.com/rrwick/Porechop).
Genome assembly was performed for each strain using the Canu assembler (available at https://github.com/marbl/canu), version 1.5 (Koren et al., 2016). We also performed a hybrid LMECYA7 assembly using SPAdes
(avail-able at http://bioinf.spbau.ru/spades). A hybrid assembly combines both Illumina and MinION sequenc-ing data to produce a more contiguous genome scaffold. Assembly quality was assessed via QUAST (Gurevich et al., 2013) online tool (http://quast.bioinf.spbau.ru/). Moreover, Nanopolish (available at https://github.com/jts/nanopolish) was used to compute an improved consensus sequence for the LME-CYA167 combined data assembly.
Additionally, read alignment was performed using Bowtie 2 (Langmead and Salzberg, 2012), ver-sion 2.3.2 (available for download at http://bowtie-bio.sourceforge.net/bowtie2/index.shtml), GraphMap (Sovi´c et al., 2016), available at https://github.com/isovic/graphmap, and NGMLR (Sedlazeck et al., 2017), available at https://github.com/philres/ngmlr. The latter two programs are especially accurate for long third-generation sequencing reads. Lambda phage reads were aligned to the GCA 000840245.1
GenBank/NCBI assembly database reference. LMECYA7 and LMECYA167 were aligned to GCA 000010625.1, while LMECYA269 and LMECYA280 were aligned using the GCA 000710505.1 accession. LEGE06226 and LEGE06233 were aligned to the GCA 000464745.1 scaffold reference. Lastly, we used Samtools (version 1.3.1) to compute aligned read statistics, to obtain the distribution of sequencing depth and to find an overall consensus sequence from some of the aligned data.
We looked for antibiotic resistance genes using the Resistance Gene Identifier (RGI) tool, available at the Comprehensive Antibiotic Resistance Database (CARD) website (https://card.mcmaster.ca/). In order to assess other genomic features present in the obtained genome sequences, we used the Rapid An-notation using Subsystem Technology (RAST) service (available at http://rast.nmpdr.org/). Furthermore, we searched for potential plasmid sequences in our data by running the plasmidspades.py script, which is a part of the SPAdes assembler package.
3
Results
3.1 First sequencing round
3.1.1 Raw read statistics
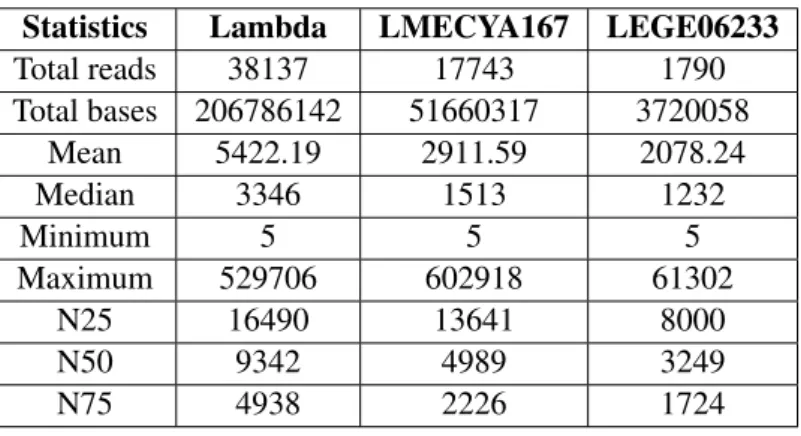
For the first sequencing round, we started by performing a lambda phage test run followed by the sequencing of two cyanobacterial strain gDNA, LMECYA167 and LEGE06233. We used one R9.4 chemistry flowcell and prepared the library according to the Rapid Sequencing kit standard protocol (SQK-RAD002 kit). Lambda phage sequencing resulted in approximately 207 Mbases in a total of 38,137 reads, whereas for strains LMECYA167 and LEGE06233, we obtained 17,743 and 1,790 reads, respectively. LMECYA167’s sequencing run resulted in more than 51 Mbases. For LEGE06233, nearly 4 Mbases were obtained. Moreover, mean read length shows a similar trend to that of total basepair and read yield, that is, lambda phage exhibited much higher values than both cyanobacterial strains. While lambda phage had 5,422 bp mean read length, LMECYA167 and LEGE06233 had 2,912 bp and 2,078 bp, respectively. Similarly, the N50 read statistic was greater for lambda phage (9,342 bp) than for either cyanobacterial strains (approximately 2,000 bp). Other raw read statistics, such as median and minimum read length, can be found in table 2.
Table 2: First sequencing round: Raw read statistics
Statistics Lambda LMECYA167 LEGE06233
Total reads 38137 17743 1790 Total bases 206786142 51660317 3720058 Mean 5422.19 2911.59 2078.24 Median 3346 1513 1232 Minimum 5 5 5 Maximum 529706 602918 61302 N25 16490 13641 8000 N50 9342 4989 3249 N75 4938 2226 1724
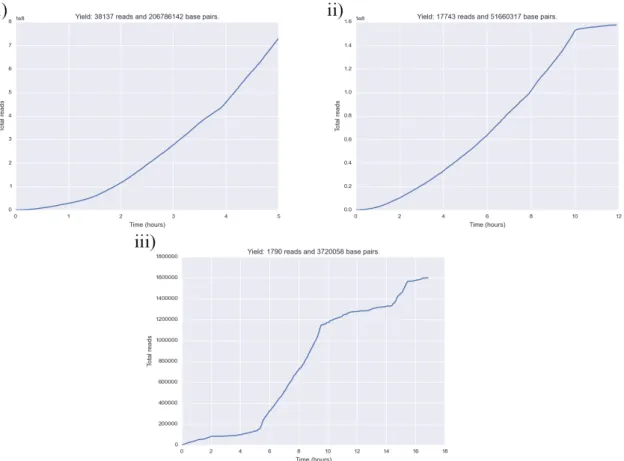
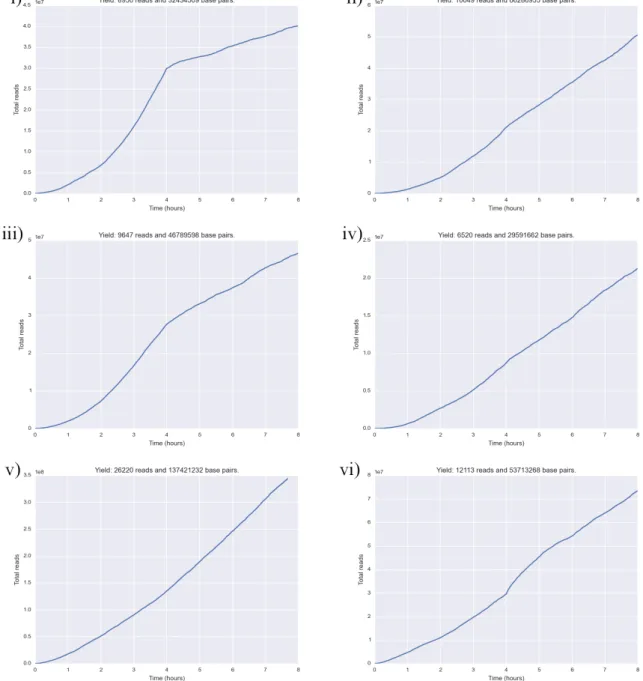
Figure 1 shows read yield over time for all three first sequencing round runs. Whereas read yield was almost linear over time for lambda phage and LMECYA167, LEGE06233 had very poor yield during most of the run time. After 10 hours, LMECYA167 seemed to have reached a plateau during which very few reads were produced.
Quality score per base distribution plots can be found in figure 2. Both lambda phage and LME-CYA167 had a 39 maximum base quality score, while LEGE06233 had a maximum of 38. Further-more, mean quality score values are very different between cyanobacterial and lambda phage read data. Mean quality score is 9.6 and 11.4 for LEGE06233 and LMECYA167, respectively. Contrastingly, mean lambda phage quality score is substantially greater, approximately 17.4. Additionally, read quality score distribution plots reveal one peak around 6 for both cyanobacteria. In the case of lambda phage, there are two quality score peaks: the first around 6 and the second around 13. The highest scoring peak contains most of the lambda sequenced reads. Quality score per read versus read length plots can be found in figures S7, S8 and S9. Overall, lambda phage sequencing had greater base and read yield and produced higher quality reads.
Figure 1: Read yield during the first sequencing round. i) Lambda phage, ii) LMECYA167 and iii) LEGE06233.
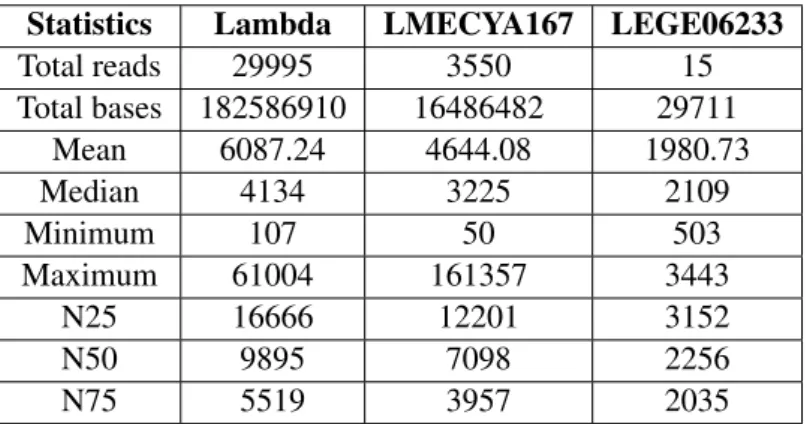
After genome assembly and read alignment using Albacore 1.2.1 basecalled reads, we re-ran basecall-ing with the most recent version of Albacore (version 2.0.2). This improved version applies a quality score filter to the raw data. Only reads with quality scores greater than or equal to 7-8 will pass. In the case of lambda phage data, the total number of reads was reduced by 21% and the total number of sequenced bases by 11%. However, mean read length as well as N50 increased by 12% and 6%, re-spectively. Maximum read length decreased from 529,706 bp to 61,004 bp. Note that both reads seem to be artifacts, because lambda phage genome length is approximately 48 kbp. This suggests that the quality score filter applied by Albacore 2.0.2 resulted in a greater quality dataset. For LMECYA167 and LEGE06233 strains, each dataset was reduced by nearly 80% and 90% of the total number of reads, respectively. Even though mean read length increased by almost 60% in the case of LMECYA167, max-imum read length was reduced by 70%. Moreover, the total number of sequenced bases decreased from 51 Mbases to 16 Mbases. Lastly, regarding LEGE06233, mean read length, total number of sequenced bases and N50 were reduced. All raw read statistics can be found in table 3.
Figure 3 shows base quality score histograms for the three first sequencing round runs. For the lambda phage test run, base quality scores averaged around 20, a 13% increase from the unfiltered data. More-over, the read quality score plots show a single peak around 12. This observation is in contrast with Albacore 1.2.1 basecalled reads, in which the quality score distribution had two peaks. Furthermore, regarding LMECYA167 and LEGE06233 read quality scores, both score distribution plots exhibit one peak. However, the peak is not around 6 as for the unfiltered data, but around 8-9. This indicates that Al-bacore 2.0.2 quality score filter is increasing overall dataset quality. For read quality score versus length bivariate plots see figures S10, S11 and S12.
Figure 2: Read quality score distribution for the first sequencing round. i) Lambda phage, ii) LMECYA167 and iii) LEGE06233.
Table 3: First sequencing round: Raw Albacore 2.0.2 basecalled read statistics
Statistics Lambda LMECYA167 LEGE06233
Total reads 29995 3550 15 Total bases 182586910 16486482 29711 Mean 6087.24 4644.08 1980.73 Median 4134 3225 2109 Minimum 107 50 503 Maximum 61004 161357 3443 N25 16666 12201 3152 N50 9895 7098 2256 N75 5519 3957 2035
Figure 3: Read quality score distribution for the first sequencing round. i) Lambda phage, ii) LMECYA167 and iii) LEGE06233. Albacore 2.0.2 basecalled reads.
3.1.2 Genome assembly
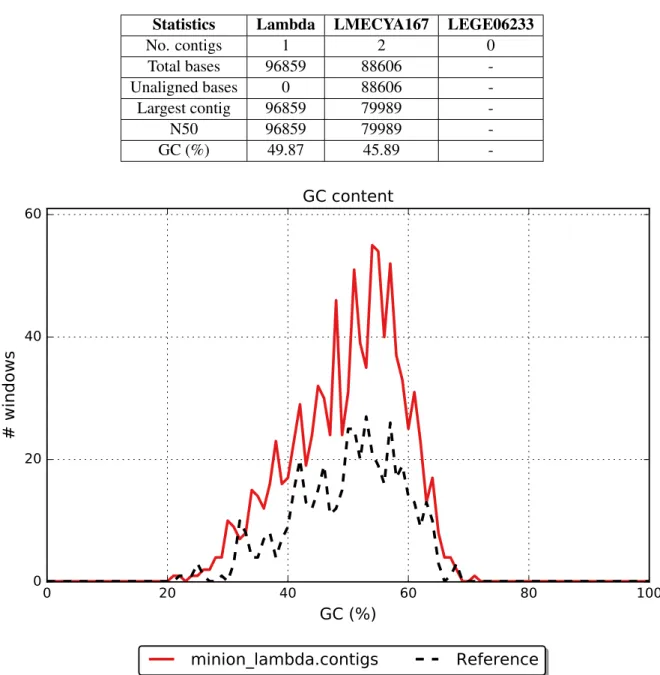
Each independent run was assembled using Canu. Table 4 shows general assembly statistics. For the lambda phage assembly, a single 96,859 bp contig was produced. The contig aligned to the approxi-mately 48 kbp lambda phage genome, resulting in almost full length genome duplication. 8 mismatches and 197 indels were also reported. Overall GC content was 49.9% and its pattern along the genome notably matches that of the reference (figure 4). Furthermore, the assembly produced by LMECYA167 sequencing data resulted in 2 contigs and a total assembly length of 88,606 bp. Neither of the contigs aligned to the reference genome. Lastly, regarding the LEGE06233 sequencing run, no overlaps were found by Canu among the 1,790 reads.
Table 4: First sequencing round: Assembly statistics
Statistics Lambda LMECYA167 LEGE06233
No. contigs 1 2 0 Total bases 96859 88606 -Unaligned bases 0 88606 -Largest contig 96859 79989 -N50 96859 79989 -GC (%) 49.87 45.89
-0
20
40
60
80
100
GC (%)
0
20
40
60
# windows
GC content
minion_lambda.contigs
Reference
Figure 4: Lambda phage data assembly GC content pattern along the genome. Albacore 1.2.1 basecalled reads.
Genome assembly performed by Canu using Albacore 2.0.2 basecalled reads resulted in one contig for both lambda phage and LMECYA167. In both cases, total assembly length was reduced. The lambda phage assembly revealed a genome duplication ratio of 1.81, since almost the whole 87,881 bp contig aligned to the reference. The assembly had 7 mismatches and 264 indels. GC content pattern along the genome is similar to that of the reference (figure S25). For the LMECYA167 79,639 bp-long scaffold, the contig did not map onto the reference genome. Finally, as with the unfiltered data, the LEGE06233 assembly did not find any overlaps between reads. Assembly statistics can be found in table 5.
Table 5: First sequencing round: Assembly statistics (Albacore 2.0.2 basecalled reads)
Statistics Lambda LMECYA167 LEGE06233
No. contigs 1 1 0 Total bases 87881 79639 -Unaligned bases 0 79639 -Largest contig 87881 79639 -N50 87881 79639 -GC (%) 49.26 50.68
-3.1.3 Alignment to reference genome
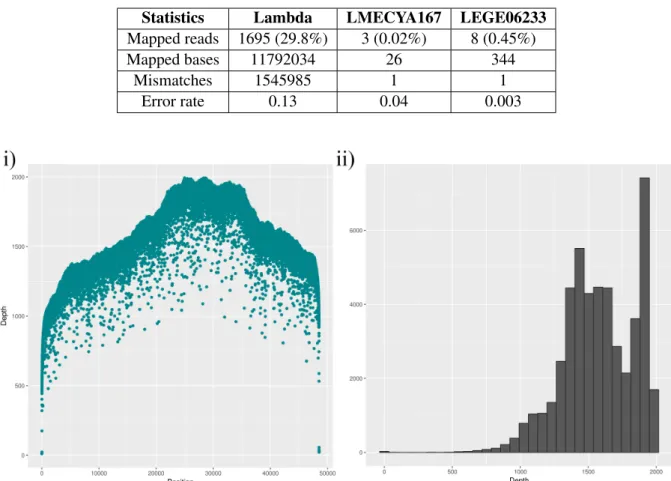
The Albacore 1.2.1 basecalled reads of the first sequencing round were aligned to a reference using Bowtie2. Results can be found in table 6. The lambda phage dataset generated an alignment from 1,695 reads, i.e. 29.8% of the total number of reads. This assembly resulted in 11,792,034 mapped bp, 1,545,985 mismatches and a 13% error rate. Regarding LMECYA167 and LEGE06233, a negligible amount of reads were aligned to the reference (3 and 8 reads, respectively). Overall, Bowtie2 alignment of cyanobacterial MinION reads was not successful. Sequencing depth plots for the alignment of lambda phage reads onto the reference genome (figure 5) show that most of the depth had a maximum of 2000 times. Moreover, most of the genome alignment had a sequencing depth that was greater than 1000 times.
Table 6: First sequencing round: Bowtie2 alignment statistics
Statistics Lambda LMECYA167 LEGE06233
Mapped reads 1695 (29.8%) 3 (0.02%) 8 (0.45%)
Mapped bases 11792034 26 344
Mismatches 1545985 1 1
Error rate 0.13 0.04 0.003
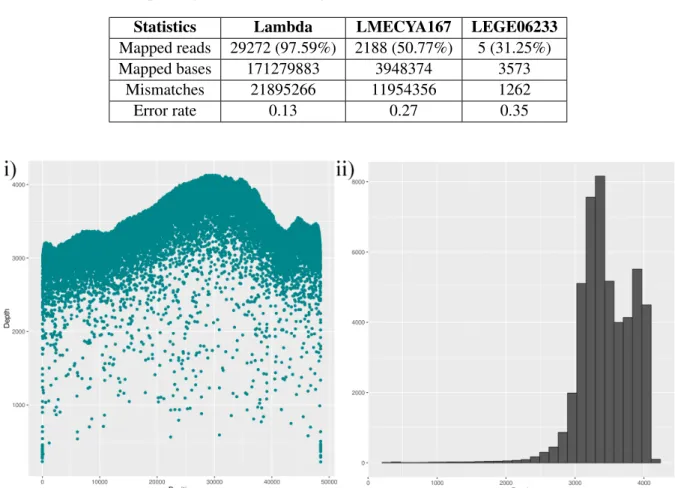
The first sequencing round Albacore 2.0.2 basecalled reads were aligned to the reference using NGMLR, for this software is well suited for MinION dataset alignment. NGMLR alignments were more successful than the previous Bowtie2 runs. For LMECYA167, NGMLR aligned more than 50% of reads resulting in 3,948,374 mapped bases. Although NGMLR increased LEGE06233’s overall mapped length from 344 bases to 3573 bases, it corresponds to very little genome coverage. In the case of the lambda phage data, NGMLR aligned nearly 97.67% of Albacore 2.0.2 basecalled reads. This corresponds to 171,279,883 mapped bases, which suggests that the lambda phage alignment was extremely successful with excellent sequencing depth. For both cyanobacterial strains, error rates were high, around 30%, while for lambda phage, the error rate remained low at 13%. These alignment statistics can be found in table 7. Lastly, lambda sequencing depth plots can be found in figure 6. In comparison to Albacore 1.2.1 basecalled reads, Albacore 2.0.2 reads produced an alignment with much higher sequencing depth. Overall depth peaked at over 3000 times with a maximum of 4000 times.
Table 7: First sequencing round: NGMLR alignment statistics of Albacore 2.0.2 basecalled reads
Statistics Lambda LMECYA167 LEGE06233
Mapped reads 29272 (97.59%) 2188 (50.77%) 5 (31.25%)
Mapped bases 171279883 3948374 3573
Mismatches 21895266 11954356 1262
Error rate 0.13 0.27 0.35
Figure 6: Sequencing depth i) along the genome and ii) overall distribution of lambda phage Albacore 2.0.2 basecalled read alignment.
3.2 Second sequencing round
3.2.1 Raw read statistics
For the second sequencing round, we performed six 8-hour sequencing runs and an additional 24-hour run. All libraries were prepared using Rapid Sequencing kits. For further details on library preparation see Methods. gDNA quality and quantity assessment can be found in table S1. We used two R9.5
chemistry flowcells to perform said sequencing runs. Each flowcell sequenced well over 100 Mbases and each 8-hour run yielded between 29-66 Mbases. Total number of passed reads varied between 6520, for LMECYA280, and 13110, for LEGE06226. Maximum read length reached 1,586,596 bp for LMECYA167. Moreover, mean read length and N50 were highest for LMECYA167 at 6596 bp and 35977 bp, respectively. Mean read length and N50 were lowest at 3624 bp and 6941 bp for LMECYA7. In the case of the 24-hour LMECYA167 run, 4262 reads were produced with an average read length of 3894 bp. 16,596,861 bases were sequenced during said run. Other raw read statistics are found in table 8.
Table 8: Second sequencing round: Albacore 1.2.6 basecalled read statistics
Statistics LMECYA7 LMECYA167 LMECYA269 LMECYA280 LEGE06226 LEGE06233 LMECYA167 24h
Total reads 8950 10049 9647 6520 13110 12113 4262 Total bases 32434509 66286955 46789598 29591662 68710616 53713268 16596861 Mean 3623.97 6596.37 4850.17 4538.60 5241.08 4434.35 3894.15 Median 1721 1650 2077 2219 1633 1651 2281 Minimum 5 5 6 5 5 5 9 Maximum 324357 1586596 307239 871568 480391 777260 428391 N25 30843 88402 33490 39945 52545 40072 17083 N50 6941 35977 11123 8359 20130 11661 5873 N75 3031 8616 4240 3709 5590 4225 3025
Read yield plots over time (figure 7) reveal an almost linear relationship between said variables during all 8 hour-sequencing runs. Figure 8 shows LMECYA167 read yield during the 24-hour sequencing run. Although such run yielded very few reads over the first 12 hours, afterwards, the relationship between the number of produced reads and run time is almost linear. For pore occupancy over time and read length distribution plots see figures S2 and S3.
Figure 9 shows the histogram of quality score per base for each of the six 8-hour sequencing runs. Average quality scores range from 8.5 (LMECYA7) to 12.4 (LEGE06226). Maximum scores varied between 58 and 59. All strains show similar patterns of quality score distribution, i.e. a single peak around 3-4. This suggests that few good quality reads were produced during said sequencing runs. Read quality score histograms exhibit an identical trend (figures S13 to S18), that is, one peak around 4-5. For some strains, there is a much smaller higher scoring second peak or a wider tail, corresponding to few good quality reads. Quality score per read versus read length plots can be found in figures S13 to S18. Comparing to the first sequencing round quality score statistics, the second round appears to have produced lower quality reads.
All second sequencing round datasets were also basecalled using Albacore 2.0.2. As with the first sequencing round data, the total number of produced reads and sequenced bases were drastically reduced. The number of reads were reduced by at least 73% as was the case for LEGE06233. The greatest reduction of ’pass’ reads was observed for the LMECYA167 24-hour run (98%). Maximum read length was only the same for LMECYA7. The remaining strains had the maximum read length statistic severely reduced. Regarding the N50 read statistic, all strains but LMECYA280 and LEGE06233 revealed an increased N50 value. This suggests higher dataset contiguity in comparison to the unfiltered data. For all raw read statistics, see table 9.
Figure 7: Read yield during the second sequencing round. i) LMECYA7, ii) LMECYA167, iii) LMECYA269, iv) LMECYA280, v) LEGE06226 and vi) LEGE06233.
Figure 9: Read quality score distribution for the second sequencing round. i) LMECYA7, ii) LMECYA167, iii) LMECYA269, iv) LMECYA280, v) LEGE06226 and vi) LEGE06233.
The distribution of quality scores per base for each cyanobacterial dataset was also obtained. All histograms show the same single-peak trend as for Albacore 1.2.6 basecalled reads. However, there was a peak shift for all strains but LMECYA7. Each histogram exhibits a quality score peak between 7-9. LMECYA167 appears to have the greatest increase in base quality scores. For quality score per base distributions of Albacore 2.0.2 basecalled reads, see figure 10. Moreover, read quality score distribution plots (figures S19 to S24) reveal a similar increase in peak value. For all strains, quality score peaks vary from 7 to 11.
Figure 10: Read quality score distribution for the second sequencing round. i) LMECYA7, ii) LMECYA167, iii) LMECYA269, iv) LMECYA280, v) LEGE06226 and vi) LEGE06233. Albacore 2.0.2 basecalled reads.
Table 9: Second sequencing round: Albacore 2.0.2 basecalled read statistics
Statistics LMECYA7 LMECYA167 LMECYA269 LMECYA280 LEGE06226 LEGE06233 LMECYA167 24h
Total reads 424 1466 2464 672 2339 3217 79 Total bases 3387351 25576138 16940070 2049604 26486693 10574668 730655 Mean 3387351 17446.21 6875.03 3050.01 11323.94 3287.12 9248.80 Median 1950 8420 3339 1704 5752 1387 3987 Minimum 75 59 35 174 26 58 108 Maximum 324357 294791 112054 295641 152016 334329 71852 N25 182110 68690 30198 16381 41207 16357 42610 N50 103977 40289 14348 4608 23556 6957 29289 N75 8880 20373 6774 2293 12393 2915 8014 3.2.2 Genome assembly
Table 10 shows general Canu assembly statistics for all seven second sequencing round datasets. While the 8-hour run assemblies resulted in 1-4 contigs, the LMECYA167 24-hour run assembly produced no contigs. Assembled length varied between 1,784 bp for LMECYA167 and 28,403 bp for LMECYA7. Overall, no contig was mapped onto the reference genome.
Table 10: Second sequencing round: Assembly statistics
Statistics LMECYA7 LMECYA167 LMECYA269 LMECYA280 LEGE06226 LEGE06233 LMECYA167 24h
No. contigs 1 1 4 2 - 2 0 Total bases 28403 1784 25795 9045 - 18503 -Unaligned bases 28403 1784 25795 9045 - 18503 -Largest contig 28403 1784 14628 4761 - 16870 -N50 28403 1784 14628 4761 - 16870 -GC (%) 25.24 2.41 31.76 19.49 - 30.44
-Albacore 2.0.2 basecalled read assemblies performed by Canu are found in table 11. In contrast to the Albacore 1.2.6 basecalled read assembly, Canu found no overlaps in the LMECYA269 data. Moreover, Canu was able to build a 3805 bp-long assembly for the LMECYA167 24-hour run dataset. LMECYA7, LMECYA280, LEGE06233 and LMECYA167 24-hour run data resulted in a single contig. LEGE06226 assembly did not finish at the time this dissertation was written, despite having run for more than 4 weeks. For most strains, overall assembly length increased. This is particularly notable in the case of LMECYA167 8-hour run data, for which there was an almost 57 times increase in length. Moreover, LMECYA167 assembly was the only one for which a small proportion of the assembled data aligned to the reference (3333 bp). The remaining contigs did not align to the corresponding reference genomes. Even though Albacore 2.0.2 basecalled data resulted in more contiguous assemblies, none of the contigs would have enough length to reach full genome coverage. Lastly, GC content increased for all strains relatively to the Albacore 1.2.6 data, but only LMECYA167 seems to have a similar GC percentage to that of the reference genome (42.7%).
Table 11: Second sequencing round: Assembly statistics (Albacore 2.0.2 basecalled reads)
Statistics LMECYA7 LMECYA167 LMECYA269 LMECYA280 LEGE06226 LEGE06233 LMECYA167 24h
No. contigs 1 2 0 1 1 1 1 Total bases 378042 101199 - 11825 59552 5362 3805 Unaligned bases 378042 97866 - 11825 59552 5362 3805 Largest contig 378042 68809 - 11825 59552 5362 3805 N50 378042 68809 - 11825 59552 5362 3805 GC (%) 48.91 40.8 - 43.82 50.48 45.88 50.17
3.2.3 Alignment to reference genome
All second sequencing round datasets were aligned to the corresponding reference genome using two distinct alignment programs, GraphMap and NGMLR. Both software are frequently used to align nanopore data onto reference sequences. GraphMap and NGMLR alignment statistics can be found in tables 12 and 13, respectively. For all datasets, NGMLR was able to increase the proportion of mapped reads at least 6.8 times. LMECYA167 strain showed the greatest increase (over 22 times), having 32.68% of reads mapped by NGMLR versus 4.81% by GraphMap. This increase resulted in a total number of mapped bases well over full genome length, i.e. 7,980,072 mapped bp. None of the remaining align-ments had more than 250,000 bp mapped onto the reference. Consequently, none such alignalign-ments have nearly enough length for full genome coverage (figures 11, S26 and S27).
Table 12: Second sequencing round: GraphMap alignment statistics
Statistics LMECYA7 LMECYA167 LMECYA269 LMECYA280 LEGE06226 LEGE06233 LMECYA167 24h
Mapped reads 45 (0.5%) 483 (4.81%) 46 (0.48%) 31 (0.48%) 98 (0.75%) 162 (1.34%) 23 (0.54%) Mapped bases 63829 6421102 187231 29777 200598 174971 163546 Mismatches 24533 2797386 89642 13793 86035 74866 71934 Error rate 0.38 0.44 0.48 0.46 0.43 0.43 0.44
Table 13: Second sequencing round: NGMLR alignment statistics
Statistics LMECYA7 LMECYA167 LMECYA269 LMECYA280 LEGE06226 LEGE06233 LMECYA167 24h
Mapped reads 1073 (11.25%) 4211 (32.68%) 594 (5.97%) 351 (5.24%) 1988 (14.11%) 1153 (9.13%) 327 (7.34%) Mapped bases 89770 7980072 49589 19291 237834 102594 222801 Mismatches 27262 2060977 15474 6066 75045 32117 63294 Error rate 0.30 0.26 0.31 0.31 0.32 0.31 0.28
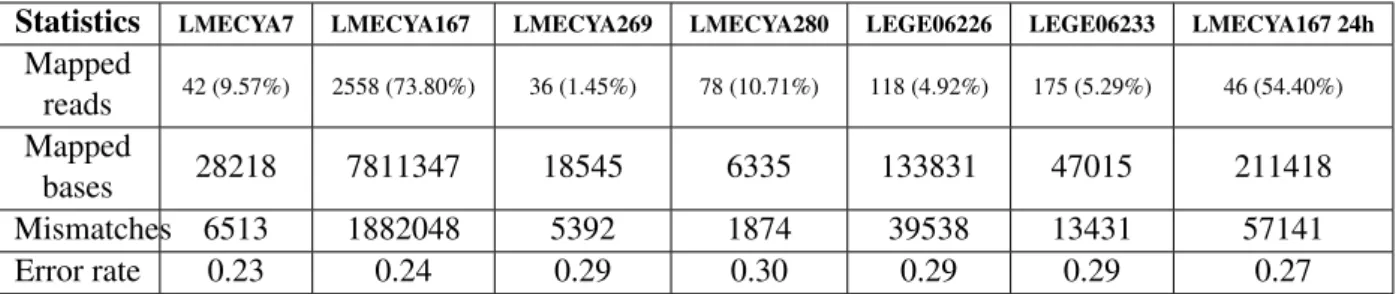
After using Albacore 2.0.2 to repeat basecalling, reads were aligned to the reference using NGMLR. We chose NGMLR as it proved to be the most efficient alignment software from our previous analyses. For all strains but the LMECYA167 24-hour run, the total number of mapped bases was reduced by 67% at most, in comparison to the Albacore 1.2.6 basecalled data. The LMECYA167 alignment showed the smallest reduction, i.e. only 2% less bases were mapped onto the reference. Since all datasets were significantly reduced by quality score filtering, every strain had less mapped reads. Nevertheless, LMECYA167’s total number of mapped bases was still greater than the reference genome size. Al-though it might suggest good genome coverage (figure 12), there is a substantial amount of mismatches (1,882,048). On the remaining strain alignments, none could reach significant coverage (figures 12, S28 and S29). Finally, average error rates decreased by almost 3%, from 30% to 27%.
Table 14: Second sequencing round: NGMLR alignment statistics with Albacore 2.0.2 basecalled reads
Statistics LMECYA7 LMECYA167 LMECYA269 LMECYA280 LEGE06226 LEGE06233 LMECYA167 24h
Mapped reads 42 (9.57%) 2558 (73.80%) 36 (1.45%) 78 (10.71%) 118 (4.92%) 175 (5.29%) 46 (54.40%) Mapped bases 28218 7811347 18545 6335 133831 47015 211418 Mismatches 6513 1882048 5392 1874 39538 13431 57141 Error rate 0.23 0.24 0.29 0.30 0.29 0.29 0.27
Figure 11: Sequencing depth along the genome (left hand-side plots) and overall distribution (right hand-side plots) of LMECYA7 (i and ii) and LMECYA167 (iii and iv). Alignment performed using Albacore 1.2.6 basecalled reads.
3.3 Genome analysis
3.3.1 LMECYA7 hybrid assembly
We obtained a hybrid assembly of the genome of LMECYA7 using SPAdes. This M. aeruginosa strain assembly resulted from a previously available Illumina paired-end sequencing dataset and our MinION sequencing reads. Two hybrid assemblies were performed for both Albacore 1.2.6 and Albacore 2.0.2 basecalled reads. Table 15 shows general assembly statistics. The total number of contigs of length greater than or equal to 500 bp varies very little between the two assemblies. Accordingly, the total number of assembled bases increased by 1,604 from Albacore 1.2.6 to Albacore 2.0.2 basecalled datasets. Nevertheless, GC content and largest contig length was the same for the two assemblies. Although the total number of assembled bases is well over full genome length, GC content is somewhat different from that of the reference sequence (48.85% vs 42.10%). This indicates that the assembly did not achieve
Figure 12: Sequencing depth along the genome (left hand-side plots) and overall distribution (right hand-side plots) of LMECYA7 (i and ii) and LMECYA167 (iii and iv). Alignment performed using Albacore 2.0.2 basecalled reads.
complete genome coverage.
Table 15: LMECYA7 hybrid assembly statistics
Statistics LMECYA7 hybrid (Albacore 1.2.6) LMECYA7 hybrid (Albacore 2.0.2)
No. contigs 5674 5673
Total bases 13151544 13153148
Largest contig 380716 380716
N50 23542 23542
GC (%) 48.85 48.85
Furthermore, we aligned the two aforementioned hybrid assemblies onto the reference genome. For that purpose, we used three alignment programs: Bowtie2, GraphMap and NGMLR. Although Bowtie2
is a short-read alignment program, the latter two are well suited for longer MinION read alignments. The number of mapped contigs did not vary substantially between the two assemblies. Bowtie2 aligned the least amount of reads (373 and 367 for Albacore 1.2.6 and Albacore 2.0.2 basecalled datasets, re-spectively) followed by GraphMap. There was a meaningful increase of mapped reads for both NGMLR alignments in comparison to the Bowtie2 and GraphMap. The number of NGMLR mapped bases was 3,807,078 for Albacore 1.2.6 basecalled reads and 3,814,883 for Albacore 2.0.2. This is just over half genome length, indicating that we obtained at least 50% genome coverage from the alignment of the hybrid assembly. For sequencing depth plots, see figure 13.
Table 16: LMECYA7 hybrid assembly alignment statistics
Statistics GraphMap Bowtie2 NGMLR
Mapped contigs 414 (1.74%) 373 (1.57%) 1690 (6.74%)
Mapped bases 3064796 21596 3807078
Mismatches 1222741 273 433694
Error rate 0.40 0.01 0.11
Table 17: LMECYA7 hybrid assembly alignment statistics (Albacore 2.0.2 basecalled reads)
Statistics GraphMap Bowtie2 NGMLR
Mapped contigs 409 (4.16%) 367 (3.73%) 1681 (15.06%)
Mapped bases 3232015 21246 3814883
Mismatches 1290110 269 435540
Error rate 0.40 0.01 0.11
Figure 13: Sequencing depth i) along the genome and ii) overall distribution of LMECYA7 hybrid assembly alignment to the reference genome. Alignment performed using Albacore 2.0.2 basecalled reads.
In summary, we obtained a hybrid assembly from the Albacore 2.0.2 basecalled read dataset and an Illumina paired-end library. The assembled data was aligned onto the reference genome. From the alignment, we built a consensus sequence which was used to look for antibiotic resistance (AR) genes.