"-'""fGVEBAPE
FUNDAÇÃO GETULIO VARGAS
ESCOLA BRASILEIRA DE ADMINISTRAÇÃO PÚBLICA E DE EMPRESAS DOUTORADO EM ADMINISTRAÇÃO
ESSAYSIN
COMPUTATIONAL MANAGEMENT SCIENCE
TESE APRESENTADA À ESCOLA BRASILEIRA DE ADMINISTRAÇÃO PÚBLICA E DE
EMPRESAS PARA OBTENÇÃO DO TÍTULO DE DOUTOR
MARCELO SALHA:B BROGLIATO
m a r c e l o s a l h a b b r o g l i at o
E S S AY S I N
E S S AY S I N
C O M P U TAT I O N A L M A N A G E M E N T S C I E N C E m a r c e l o s a l h a b b r o g l i at o
Escola Brasileira de Administração Pública e de Empresas Fundação Getulio Vargas
Marcelo Salhab Brogliato: Essays in Computational Management Science, © June 2018
s u p e r v i s o r s:
Alexandre Linhares location: Rio de Janeiro
Ficha catalográfica elaborada pela Biblioteca Mario Henrique Simonsen/FGV
Brogliato, Marcelo Salhab
Essays in computational management science / Marcelo Salhab Brogliato. – 2018.
285 f.
Tese (doutorado) - Escola Brasileira de Administração Pública e de Empresas, Centro de Formação Acadêmica e Pesquisa.
Orientador: Alexandre Linhares. Inclui bibliografia.
1.Administração. 2. Ciência cognitiva. 3. Memória - Simulação
por computador. 4. Processo decisório. 5. Inteligência artificial distribuída. 6. Bitcoin. I. Linhares, Alexandre. II. Escola Brasileira de Administração Pública e de Empresas. Centro de Formação Acadêmica e Pesquisa. III. Título.
A B S T R A C T
This thesis presents three specific, self-contained, scientific papers in the Computational Management Science area. Modern management and high technology interact in multiple, profound, ways. Professor Andrew Ng tells students at Stanford’s Graduate School of Business that “AI is the new electricity”, as his hyperbolic way to emphasize the potential transformational power of the technology.
The first paper is inspired by the possibility that there will be some form of purely digital money and studies distributed ledgers, proposing and analyzing Hathor, an alternative architecture towards a scalable cryptocurrency.
The second paper may be a crucial item in understanding human decision making, perhaps, bringing us a formal model of recognition-primed decision. Lying at the intersection of cognitive psychology, computer science, neuroscience, and artificial intelligence, it presents an open-source, cross-platform, and highly parallel framework of the Sparse Distributed Memory and analyzes the dynamics of the memory with some applications.
Last but not least, the third paper lies at the intersection of marketing, diffusion of technological innovation, and modeling, extending the famous Bass model to account for users who, after adopting the innovation for a while, decide to reject it later on.
R E S U M O
A presente tese é formada por três trabalhos científicos na área de Management Science Computacional. A gestão moderna e a alta tecnologia interagem em múltiplas e profundas formas. O professor Andre Ng diz aos seus estudantes na Escola de Negócios de Stanford que “Inteligência Artificial é a nova eletricidade”, como sua forma hiperbólica de enfatizar o potencial transformador da tecnologia.
O primeiro trabalho é inspirado na possibilidade de que haverá alguma forma de dinheiro digital e estuda ledger distribuídas, propondo e analisando o Hathor, uma arquitetura alternativa para criptomoedas escaláveis.
O segundo trabalho pode ser um item crucial no entendimento de tomadas de decisão, nos trazendo um modelo formal de recognition-primed decisions. Situada na intersecção entre psicologia cognitiva, ciência da computação, neuro-ciência e inteligência artifical, ele apresenta um framework open-source, multi-plataforma e altamente paralelo da Sparse Distributed Memory e analisa a dinâmica da memória e algumas aplicações.
O terceiro e último trabalho se situa na intersecção entre marketing, difusão de inovação tecnologica e modelagem, extendendo o famoso modelo de Bass para levar em consideração usuário que, após adotar a tecnologia por um tempo, decidiram rejeitá-la.
Showing gratitude is one of the simplest yet most powerful things humans can do for each other. — Randy Pausch, The Last Lecture
A C K N O W L E D G M E N T S
I must, first and foremost, give thanks for the complete and unwavering support and love from all my family. My beloved wife Patrícia, my wonderful parents Reynaldo and Angelina, my lovely sister Flávia, my sweet grandmas Geny and Rosaria, and all others who will always be remembered in my heart. Thank you for your patience and for understanding that I was physically far away but very close in heart. A special thanks to my dad, Reynaldo, who always inspired me and who first awakened my passion for technology and engineering.
Thanks to my wife, Patrícia, for sharing the dreams, the passion, and the craziness, for all her caring and love. Especially, for understanding my absence and my unusual working times. Her loyalty and commitment make me the luckiest man alive. I love you, Xu.
I’m very grateful for the friendship, guidance, and invaluable help of my advisor Alexandre Linhares. Without him this work would never be possible. His passion for cognitive sciences, artificial intelligence, and economics has influenced everyone around him. His ideas have profoundly influenced my thoughts and my life since we have met. His optimism and trust in my abilities were undying. I must not forget his wife Paula, who became a dear friend and has always supported me as well, even when I was working in her living room until sunrise. Thank you for this amazing journey, my friends.
Thanks to my friends Daniel Chada, Layla Mendes, Renato Kogeyama, André Luiz, Luiz Sacramento, Kaillen Givigi, Jamil Chivitarese, Lucia Barros, Daniel Modenesi, Bernardo Machado, and Andréia Sodré, always available for serious talking, laughing, and sharing their wide and deep knowledge, even at lunchtime and weekends. I will never forget our all-you-can-eat adventures in Bros restaurant, the snacks in Catarina, and the drinks in Bigode’s bar. You have become very close friends who I will carry for life.
Thanks to my long-time business partner and friend Claudio Abreu, who share a deep delight for engineering and has taught me so much about life, family, and business. He has always put faith in me and cheered for my victories. Thank you, my dear friend.
I thank my dear buddy and coauthor Daniel Chada for sharing the passion for research, always inspiring and amusing me with his
astonishing ideas. Our long discussions have definitely shaped my researching abilities. Thank you, bro!
Thanks to EBAPE / FGV for their finest faculty, staff, and infrastructure. A special thanks to Celene Silva Melo for her empathy and support besides all the help with paperwork, funding, and many other things. Another special thanks to professor Luiz Antônio Joia, who trusted me in the first place and guided my first steps into the world of academy.
Last, but far from least, I thank Kallen Givigi for being the “Psych-os” lab’s protector and defender. She has always been there solving all sort of things (even personal matters) and whipping our lab into shape. Always kind and smiling, she gently asked for more focus and less mess. Your request is my command, my lady.
Finally, thanks to everyone who helped me in any way, for each word, for caring, for your support in difficult moments and for all jokes and talks that made my days worthwhile. Surely this work was done thanks to all of you. After all, nobody does it alone!
C O N T E N T S
i i n t r o d u c t i o n 1
1 i n t r o d u c t i o n 3
1.1 Distributed financial ledgers 5
1.2 Sparse Distributed Memory 6
1.2.1 Decisions with serious skin in the game 7
1.2.2 Artificial Intelligence 10
1.3 Diffusion of innovation 11
1.4 The fine print... 12
ii h at h o r: an alternative towards a scalable c r y p t o c u r r e n c y 13 2 i n t r o d u c t i o n 15 3 b i t c o i n & blockchain 21 4 i o ta & tangle 25 5 a na ly s i s o f b i t c o i n 31 5.1 Hash function 31
5.2 Mining one block 31
5.3 Mining several blocks 33
5.4 Mining for a miner 34
5.5 Orphan blocks 36
5.6 Analysis of network’s hash rate change 36
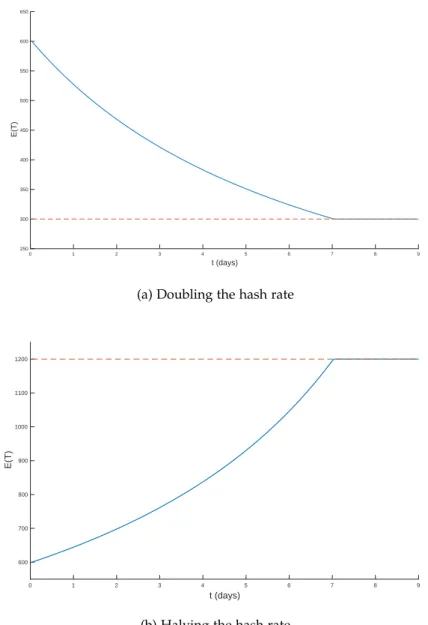
5.6.1 Hash rate suddenly changing 37
5.6.2 Hash rate smoothly changing 37
5.6.3 Piecewise linear model of hash rate
change 40
5.6.4 Comparison of the models 40
5.7 Attack in the Bitcoin network 41
5.8 Confirmation time and network capacity 46
6 h at h o r’s architecture 49
6.1 Transaction confirmation 51
6.2 Time between blocks 51
6.3 Weight of the transactions 52
6.4 Issuance rate 52
6.5 Transaction fees 53
6.6 Transaction validation 53
6.7 Orphan blocks 54
6.8 Governance 54
6.9 Expected number of tips 55
7 m e t h o d o l o g y 57
8 a na ly s i s o f h at h o r 59
8.1 Confirmation time 59
xiv c o n t e n t s
8.2 Visualizing the network 64
8.3 Number of tips 65
8.4 Network validated transactions 65
9 c o n c l u s i o n 69
iii a n i n v i tat i o n t o s pa r s e d i s t r i b u t e d m e m o r y: f r o m t h e t h e o r e t i c a l m o d e l t o t h e s y s t e m d y na m i c s 71
10 i n t r o d u c t i o n 73
10.1 Desiderata for a theory of memory 74
10.2 The wasted effort of duplicated, ad hoc, work 75
11 n o tat i o n 79
12 s pa r s e d i s t r i b u t e d m e m o r y 81
12.1 Neurons as pointers 87
12.2 Concepts 88
12.3 Read operation 88
12.3.1 Generalized read operation 89
12.4 Critical Distance 90
13 f r a m e w o r k a r c h i t e c t u r e 93
13.1 Bitstring 94
13.1.1 The distance between two bitstrings 94
13.2 Address space 95
13.2.1 Scanning for activated hard locations 95
13.2.2 OpenCL kernels 96
13.3 Counters 97
13.4 Read and write operations 106
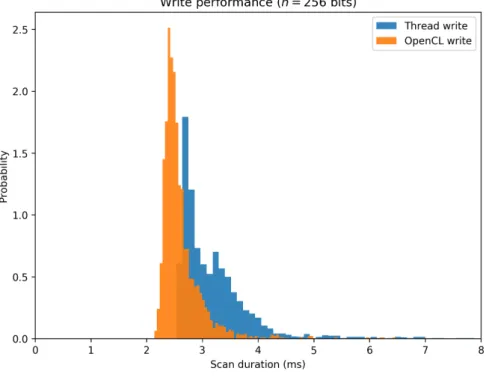
14 r e s u lt s (i): performance 107
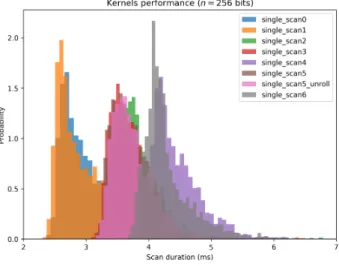
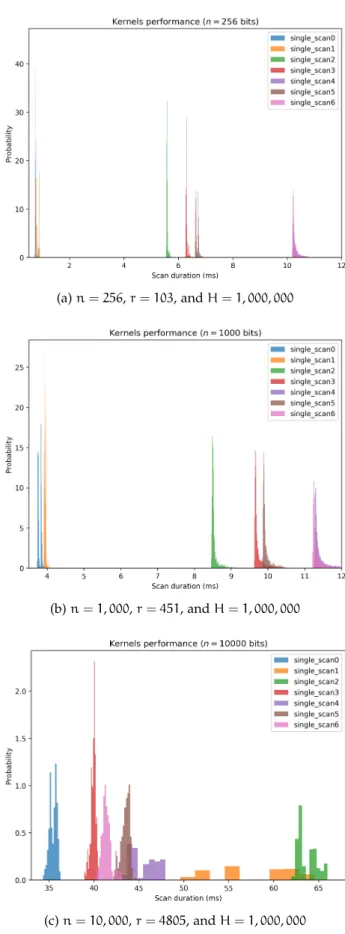
14.1 Kernels comparison 108
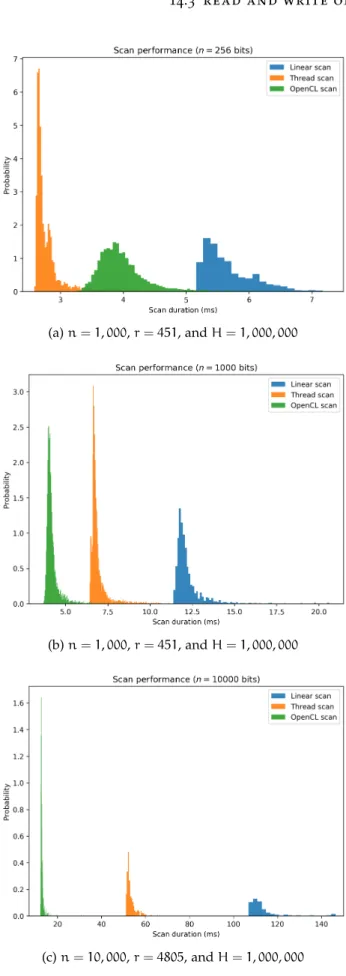
14.2 Scanners comparison 109
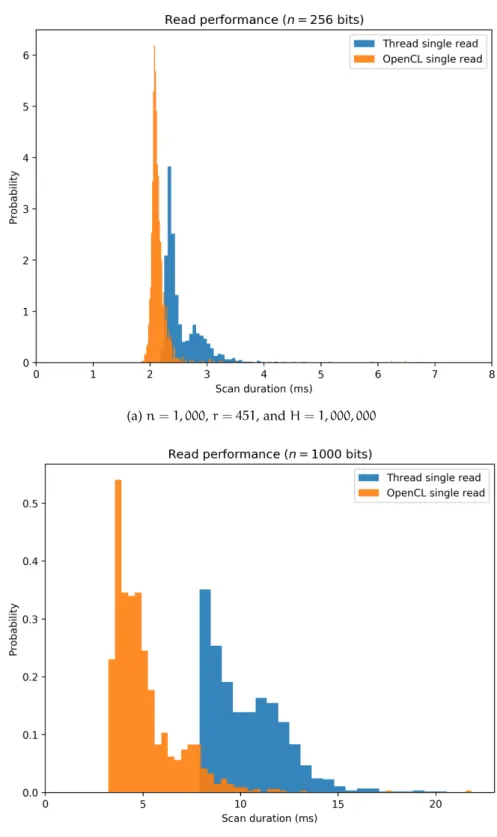
14.3 Read and write operations 109
14.3.1 Summary of results 109
15 r e s u lt s (ii): framework validation 131
15.1 Distance between random bitstrings 131
15.2 Number of activated hard locations 132
15.3 Intersection of two circles 133
15.4 Storage and retrieval of sequences 134
15.4.1 k-fold memory using only one SDM 135
16 r e s u lt s (iii): loss of neurons 137
17 r e s u lt s (iv): critical distance 143
17.1 A deviation from the equator distance? 147
17.2 Counter bias 153
17.3 Read bias 155
17.4 Critical distance of 209 158
18 r e s u lt s (v): generalized read operation 161
19 r e s u lt s (vi): s u p e r v i s e d c l a s s i f i c at i o n a p p l i c at i o n 165
c o n t e n t s xv
20 r e s u lt s (vii): i m a g e n o i s e f i lt e r i n g a p p l i c at i o n 175
21 r e s u lt s (viii): the possibility of unsupervised r e i n f o r c e m e n t l e a r n i n g 181
21.1 Training 184
21.2 Results 184
22 r e s u lt s (ix): information-theoretical write op-e r at i o n 191
23 c o n c l u s i o n 195
23.1 Another ‘funny thing’... 195
23.2 Magic numbers 196
23.3 Symmetrical, rapidly accessible, hard locations 196
23.4 “i” versus “l” 197
23.5 Deep learning, multiple SDMs — and the incredible animal behavior of Dr. Linhares 197
23.6 Not a real Conclusion 203
24 a p p e n d i x 207 iv d i f f u s i o n a n d d i s m i s s a l o f i n n ovat i o n: f o r e c a s t i n g t h e n u m b e r o f f a c e b o o k’s active u s e r s 211 25 i n t r o d u c t i o n 213 26 t h e b a s s m o d e l 215 27 t h e e x t e n d e d m o d e l 217 28 m o d e l s f o r R(t) 219 28.1 Model 1 219 28.2 Model 2 220 28.3 Model 3 221 28.4 Model 4 222 29 e s t i m at i o n m e t h o d 225 30 r e s u lt s 227 31 c o n c l u s i o n 231 v c o n c l u s i o n 233 32 c o n c l u s i o n 235 vi a p p e n d i x 239 a r e c e n t r e s u lt s i n t h e o r y o f c o m p u t i n g - i 241
a.1 The Halting Problem is Solvable 241
L I S T O F F I G U R E S
Figure 1 Slides from an old Linhares’ class; a
viewpoint that has influenced the choice of topics found in this thesis. In the history of computing business, the most interesting level of analysis seems to be that of the platform. It is where things can go on top of, and communities emerge, and standards fight against each other, and fortunes are built or lost. It is, in a sense, a major part of the Big Drama of our moment in history. Each time a new computing platform appears, it seems as the opportunities are ripe for the taking; as if
a multitude of doors have opened
simultaneously. Note that the slides were made in 2007, and expected an AI-based ‘semantic revolution‘ by 2015 [130]. In
between, both the iPhone (and competitors) and Bitcoin (and competitors) have created giant platforms on top of which immense wealth has been created (Uber, Instagram, etc, on the case of smartphones; and exchanges, miners, investors, payment processors, etc., in the case of blockchains). The key point is that
we should (i) expect new, unforeseen,
technological platforms, (ii) rapidly identify them, and (iii) throw our energy at them, as they offer leverage to make an asymmetric
impact. 4
Figure 2 White nodes represent transactions that have been confirmed at least once. Green circles represent unconfirmed transactions (tips). Gray and dashed nodes are the transactions currently solving the proof-of-work in order to be propagated. 27
Figure 3 Suddenly the number of transactions per
second increases and the width of the swarm
grows. After a while, the number of
transactions per second decreases and the width of the swarm shrinks. 28
List of Figures xvii
Figure 4 The red nodes are transactions which had
some conflict with previous transaction and were invalidated by the network. Notice that none of them have been confirmed. 29
Figure 5 Probability density function of Y6, i.e., probability of finding 6 blocks after time t. The shaded areas shows the lower 5% and upper 5% of the pdf. 34
Figure 6 Maximum absolute error between the linear
and the suddently change models. 41
Figure 7 The average time between blocks when the
hash rate changes over time. 42
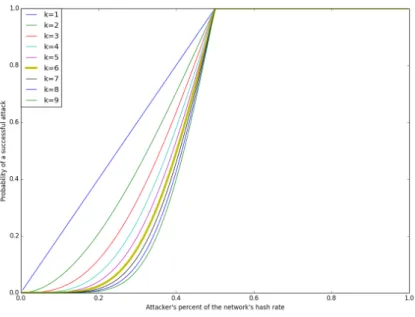
Figure 8 Both the attacker and the network are mining. Each step up is a new block found by the network with probability p. Each step right is a new block found by the attacker with probability 1 − p. It ends when the network finds k blocks — in this example, k = 6. The red path has probability p6(1 − p)3, while the blue path has probability p6(1 − p)7. Notice that the blue path is a successfull attack, because the attacker has found more blocks than the network. In the red path, the attacker still have to catch up 3 blocks to have a
successful attack, which happens with
probability ρ3, if p < 0.5. 45
Figure 9 Probability of a successful attack according to the network’s hash rate of the attacker
(β). 46
Figure 10 Visualization of a Hathor’s graph in two
particular cases: (a) no miners, (b) no transactions. It shows that when there are no miners, Hathor is similar to Iota (same structure, but different parameters), and when there is no transactions, it is similar to
Bitcoin. 59
Figure 11 Visualization of a Hathor’s graph with
transactions and blocks. Red boxes are blocks, and white circles are simple transactions. The arrows show the confirmations. 60
xviii List of Figures
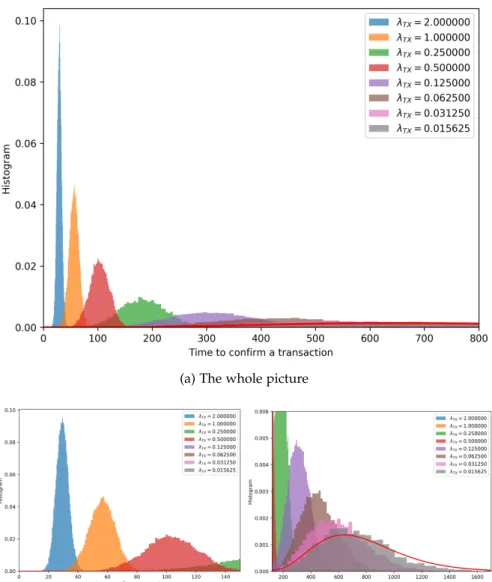
Figure 12 Confirmation time in two scenarios: (a) low load, (b) mid load. The red curve is the distribuion of the time to find six blocks in Bitcoin (which follows an Erlang distribution). As we can notice, in the low load scenario, Hathor’s confirmation time behaves just like Bitcoin’s. When the load is increased, it starts to diverge from Bitcoin’s distribution. 60
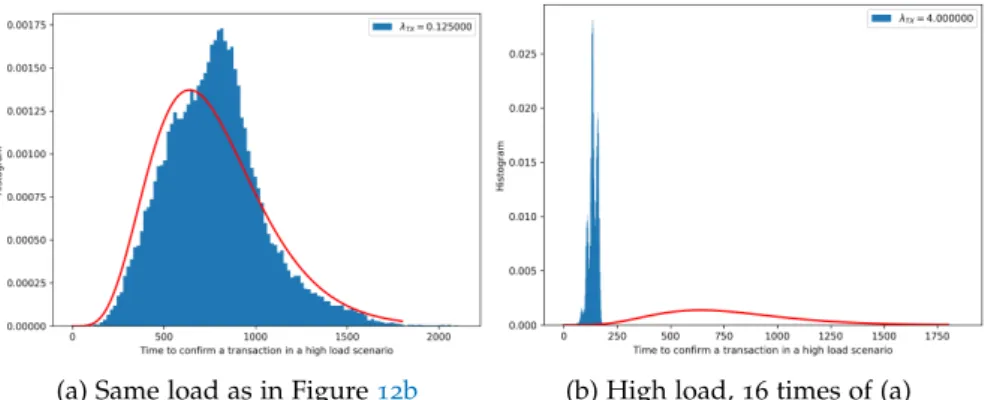
Figure 13 Confirmation time in many scenarios, moving from a low load (λTX = 0.015625) to a high load
(λTX = 2). 61
Figure 14 Confirmation time with miners’ hash rate ten times the transactions’. 62
Figure 15 Histogram of time between blocks. The red
curve the Bitcoin’s theoretical distribution of time between blocks. As we can notice, the fit
is very good. 62
Figure 16 Visualization of a Hathor’s graph with
transactions and blocks. Red boxes are blocks; green circles are confirmed transactions; white circles are in-progress transactions; yellow circles are unconfirmed transactions (tips); and grey circles are transactions solving the proof-of-work which have not been
propagated yet. The arrows show the
confirmation chain. Block’s arrows are in
bold. 63
Figure 17 DAG visualization when the loading is
changed over time. 64
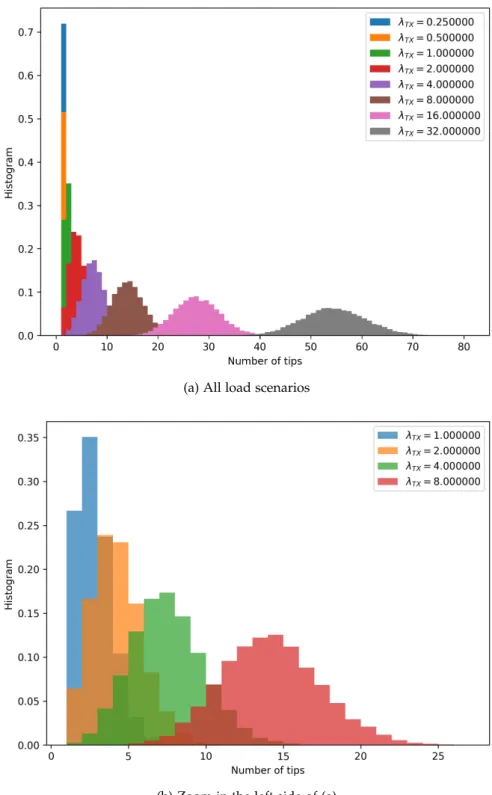
Figure 18 Histogram of the number of tips for different load scenarios. As expected, the number of tips increases with λTX. 66
Figure 19 Histogram of the time it takes for a
transaction to be network validated. A transaction is said to be network validated when all tips are confirming it directly or indirectly. 68
List of Figures xix
Figure 20 Here we have Qn, for n ∈ {3, 7, 10}. Each
node corresponds to a bitstring in{0, 1}n, and two nodes are linked iff the bitstrings differ
by a single dimension. A number of
observations can be made here. First, the number of nodes grows as O(2n); which
makes the space rapidly intractable. Another interesting observation, better seen in the figures below, is that most of the space lies ‘at the center’, at a distance of around n/2 from any given vantage point. 82
Figure 21 Activated addresses inside access
radius r around the center address. 83
Figure 22 Shared addresses between the
target datum η and the cue ηx. 84
Figure 23 Hard-locations randomly sampled from
binary space. 85
Figure 24 In this example, four iterative readings were required to converge from ηxto η. 86
Figure 25 Hard-locations pointing, approximately, to the target bitstring. 87
xx List of Figures
Figure 26 How far, in Hamming distance, is a read item from the original stored item? Kanerva demonstrated that, after a small number of iterative readings (6 here), a critical distance behavior emerges. Items read at close distance converge rapidly; whereas farther items do not converge. Most striking is the point in which the system displays the tip-of-tongue
behavior. Described by psychological
moments when some features of the item are prominent in one’s thoughts, yet the item still cannot be recalled (but an additional cue
makes convergence ‘immediate’).
Mathematically, this is the precise distance in which, despite having a relatively high number of cues (correct bits) about the desired item, the time to convergence is
infinite. Heatmap colors display the
Hamming distance the associative memory is able to cleanly converge to—or not. In the x-axis, the distance from the desired item is displayed. In the y-axis, we display the read operation’s behavior as the number of items registered in the memory grows. These graphs are computing intensive, yet they can be easily tested by readers in our provided
Jupyter notebooks. Note the different
scales. 91
Figure 27 Address space’s bitstrings are stored in a contiguous array. In a 64-bit computer, each bitstring is stored in a sub-array of 64-bit integers, with length 8· dn/64e. 95
Figure 28 Kernel comparisons for MacBook Pro Retina
13-inch Late 2013 with a 2.6GHz Intel core i5 processor, 6GB DDR3 RAM, and Intel Iris
GPU. 111
Figure 29 Scanner comparisons for MacBook Pro Retina 13-inch Late 2013 with a 2.6GHz Intel core i5 processor, 6GB DDR3 RAM, and Intel Iris
GPU. 112
Figure 30 Read operation comparisons for MacBook Pro Retina 13-inch Late 2013 with a 2.6GHz Intel core i5 processor, 6GB DDR3 RAM, and Intel
List of Figures xxi
Figure 31 Write operation comparisons for MacBook Pro Retina 13-inch Late 2013 with a 2.6GHz Intel core i5 processor, 6GB DDR3 RAM, and Intel
Iris GPU. 114
Figure 32 Kernel comparisons for iMac Retina 5K
27-inch 2017 with a 3.8GHz Intel core i5 processor, 8GB DDR4 RAM, and a Radeon
Pro 580 8G GPU. 116
Figure 33 Scanner comparisons for iMac Retina 5K 27-inch 2017 with a 3.8GHz Intel core i5 processor, 8GB DDR4 RAM, and a Radeon Pro 580 8G
GPU. 117
Figure 34 Read operation comparisons for iMac Retina 5K 27-inch 2017 with a 3.8GHz Intel core i5 processor, 8GB DDR4 RAM, and a Radeon Pro
580 8G GPU. 118
Figure 35 Write operation comparisons for iMac Retina 5K 27-inch 2017 with a 3.8GHz Intel core i5 processor, 8GB DDR4 RAM, and a Radeon Pro
580 8G GPU. 119
Figure 36 Kernel comparisons for Amazon EC2
p2.xlarge with Intel Xeon E5-2686v4
processor, 61GB DDR3 RAM, and NVIDIA
K80 GPU. 121
Figure 37 Scanner comparisons for Amazon EC2
p2.xlarge with Intel Xeon E5-2686v4
processor, 61GB DDR3 RAM, and NVIDIA
K80 GPU. 122
Figure 38 Read operation comparisons for Amazon EC2
p2.xlarge with Intel Xeon E5-2686v4
processor, 61GB DDR3 RAM, and NVIDIA
K80 GPU. 123
Figure 39 Write operation comparisons for Amazon EC2
p2.xlarge with Intel Xeon E5-2686v4
processor, 61GB DDR3 RAM, and NVIDIA
K80 GPU. 124
Figure 40 Kernel comparisons for Amazon EC2
p3.2xlarge with Intel Xeon E5-2686v4
processor, 488GB DDR3 RAM, and NVIDIA
Tesla V100 GPU. 126
Figure 41 Scanner comparisons for Amazon EC2
p3.2xlarge with Intel Xeon E5-2686v4
processor, 488GB DDR3 RAM, and NVIDIA
xxii List of Figures
Figure 42 Read operation comparisons for Amazon EC2
p3.2xlarge with Intel Xeon E5-2686v4
processor, 488GB DDR3 RAM, and NVIDIA
Tesla V100 GPU. 128
Figure 43 Write operation comparisons for Amazon EC2
p3.2xlarge with Intel Xeon E5-2686v4
processor, 488GB DDR3 RAM, and NVIDIA
Tesla V100 GPU. 129
Figure 44 Histogram of 10,000 distances between two
random bitstrings with 1,000 bits. The curve in red is the theoretical normal distribution with µ = 500 and σ =√500/2. 131
Figure 45 Histogram of the number of activated hard
locations in 10,000 scans from a random bitstring. The curve in red is the theoretical
normal distribution with µ = Hp and
σ = p(p − 1)H. 132
Figure 46 Histogram of the distances of activated hard locations to the center of the circles. The curve in red is the theoretical distribution of
Equation3 133
Figure 47 Number of hard locations in the intersection of circles around two bitstrings x bits
away. 134
Figure 48 This graph shows the SDM’s robustness
against loss of neurons in a SDM with n = 1, 000 and H = 1, 000, 000. It shows that a loss of 200,000 neurons, 20% of the total, does not seem to affect SDM whatsoever. 138
Figure 49 This graph shows the SDM’s robustness
against loss of neurons in a SDM with n = 1, 000 and H = 1, 000, 000. The more neurons are lost, the smaller the critical distance, i.e., the worse the SDM recall. 138
Figure 50 This graph shows the SDM’s robustness
against loss of neurons in a SDM with n = 1, 000 and H = 1, 000, 000. Even when 50% of neurons are dead, SDM recall is barely affected, which is an impressive result and matches with some clinical results of children submitted to hemispherectomy. 140
Figure 51 This graph shows the SDM’s robustness
against loss of neurons in a SDM with n = 1, 000 and H = 1, 000, 000. 140
List of Figures xxiii
Figure 52 This graph shows the SDM’s robustness
against loss of neurons in a SDM with n = 256and H = 1, 000, 000. 141
Figure 53 Kanerva’s original Figure 7.3 (p. 70) predicting a ~500-bit distance after a point. 143
Figure 54 Results generated by the framework diverging from Kanerva’s original Figure 7.3. Here we had a 1,000 bit, 1,000,000 hard location SDM with 10,000 random bitstrings written into it, which was also Kanerva’s configuration.
144
Figure 55 Results generated by the framework similar to Kanerva’s original Figure 7.3. Here we have a 1,000 bit, 1,000,000 hard location SDM with (a) just 100 random bitstrings written into it and (b) steps of 1,000 random bitstrings written into it. 145
Figure 56 This graph shows the interaction effects more clearly. As we change the single read to a 6-iterative read, the effect has vanished, and all bitstrings above x = 500 have converged to 500-bit distance bitstrings. Here we have precisely the same configuration of Figure54,
except for the iterative read. 146
Figure 57 Kanerva’s original Figure 7.3 generated using the equations from Brogliato et al. [30]. 147
Figure 58 The threshold size r of hard-locations bring about the autocorrelation of Theorem 9.
Consider, for instance, the extremes {0, n}. Let us start with n (in our case, n = 1000 dimensions): given the information that d(x, y) 6 n, the probability of a bitmatch in
dimension i is 1/2; as
∀x, y ∈ {0, 1}N, d(x, y) 6 n. At the other
extreme, consider that we have the
information that d(x, y) 6 0: in this case x = y and the probability of a bitmatch, in any dimension, is 1. The autocorrelation hence drops monotonically until convergence at 1/2 as the distance grows. Numerically, our results converge to precisely 1/2 only after d(x, y) > 607 for n = 1000; d(x, y) > 5332 for n = 10000, and d(x, y) > 83 for n = 100. This will be seen in Lemma10. 150
xxiv List of Figures
Figure 59 The same setup as in Figure 54, but for
n = 10, 000. It shows that the interference has almost gone away when n is sufficiently large. 152
Figure 60 Given an address x and a dimension i, how
many hard locations with bitmatches in i are activated by reading at x? The histogram was obtained through numerical simulation. The
red curve is the theoretical normal
distribution found in Theorem13. 153
Figure 61 The value of the counters after s = 10, 000 writes shows the autocorrelation in the counters in autoassociative memories (“x at x”). The histogram was obtained through simulation. The red curve is the theoretical normal distribution found in equations (21)
and (22). 155
Figure 62 Autocorrelation in the counters in
autoassociative memories (“x written at x”).
The histogram was obtained through
simulation. The red curve is the theoretical distribution. 156
Figure 63 The histogram was obtained through
simulation. The red curve is the theoretical normal distribution. 157
Figure 64 The histogram was obtained through
simulation. The red curve is the theoretical normal distribution. 157
Figure 65 The histogram was obtained through
simulation. The red curve is the theoretical normal distribution. 158
Figure 66 New distance after a single read operation in a bitstring ηd, which is d bits away from η.
The new distance was calculated between ηd
and read(ηd). Notice that when d > 520, the
intersection between η and ηd is zero, which
means there is only random bitstrings written into the activated hard locations. The distance 220equals 1000· 0.220 which is the probability find in Figure65. 159
Figure 67 Zoom-in around d = 209 of Figure57. 159
List of Figures xxv
Figure 69 (a) and (b) show the behavior of a single read.
As stated previously, we can see a
deterioration of convergence, with lower critical distance as z > 1. Another observation can be made here, concerning the discrepancy of Kanerva’s Fig 7.3 and our data. It seems that Kanerva may not have considered that a single read would only ‘clean’ a small number of dimensions after the critical distance. What we observe clearly is that with a single read, as the distance grows, the system only ‘cleans’ towards the orthogonal distance 500 after a number of iterative readings. 162
Figure 70 (a) and (b) show the behavior of Figure 69,
now executed with 6-iterative reads. What we observe clearly is that with a single read, as the distance grows, the system only ‘cleans’ towards the orthogonal distance 500 after a number of iterative readings. 163
Figure 71 Examples of noisy images with uppercase let-ters, lowercase letlet-ters, and numbers. 165
Figure 72 One noisy image for each of the 62 classifica-tion groups. 166
Figure 73 100 noisy images generated to train label A.
167
Figure 74 Images generated using a 20% noise for the high noise scenario. 167
Figure 75 Images generated for the no noise scenario.
168
Figure 76 Images of different characters which may be confusing depending on the noise level. 169
Figure 77 Characters in the low noise scenario in which the classifier has made at least one mistake. In all the other cases, it correctly classified the images. We may notice that the groups of “i” and “l” have been completely merged by the classifier, because it cannot distinguish them, not even with no noise. 170
Figure 76 Characters in the high noise scenario in which the classifier has made at least one mistake. In all the other cases, it correctly classified the
images. 173
Figure 77 Progressive noise into letter “A”, from 0% to 45% in steps of 5%. 175
xxvi List of Figures
Figure 78 Training images written into the SDM. They were written in their own addresses — write(address=bs_image,
datum=bs_image). 176
Figure 79 In order to test the SDM as a noise filter, we read from noisy images expecting to get a clean image. It is interesting to highlight that SDM has never seen a clean version letters “T” and “I”. 176
Figure 80 Probability of getting the right pixel when reading from an image with noise p. It assumes that SDM was trained with 200 images with 15% noise. 177
Figure 81 Training images in which the intersection
between images is too high. They were
written in their own addresses —
write(address=bs_image,
datum=bs_image). 178
Figure 82 When the intersection between images
becomes too high, there appears some
interference in the resulting image. All cases have 10% noise. We can notice that the empty space on the right side of the “C” letter generates some white pixels on the right side of both “B” and “D” letters. 178
Figure 83 Using labels solves the interference problem
when the intersection between images
becomes too high. All cases have 20% noise.
179
Figure 84 Each action is a cell in the TicTacToe board and is mapped to slice of the bitstring. 182
Figure 85 Example of a game with 7 movements in
which X wins. 182
Figure 86 Positive reward bitstrings used in our
reinforcement learning algorithm. 183
Figure 87 Results playing against the random player. Each cycle was made of 100 games for training, and then 100 games for measuring statistics. 186
Figure 88 Results playing against the smart player. Each cycle was made of 100 games for training, and then 100 games for measuring statistics.
Figure 89 Results playing against another SDM player. Each cycle was made of 100 games for training, and then 100 games for measuring statistics. 188
Figure 90 Results playing against a randomly chosen
player between random player, smart player, and another SDM player. Each cycle was made of 100 games for training, and then 100 games for measuring statistics. 189
Figure 91 Shannon write operation: Computing the
amount of information of a signal to each hard location in its access radius. (a) entirety of the space; (b) region of interest; (c) Fast integer computation is possible through a stepwise function. 193
Figure 92 Behavior of the critical distance under the
information-theoretic weighted write
operation when n = 1, 000, H = 1, 000, 000 and r = 451. 194
Figure 93 Bongard problems 71 - 73, courtesy of noted Bongardologist, Dr. Harry Foundalis. What distinguishes the boxes on the left hand side to those on the right hand side? 199
Figure 94 Fit of Model 2 with Facebook’s active users dataset. mF(t) is the total users, mR(t) is the inactive users, and mA(t) is the active users. The unit of these functions are thousands of people. The parameters are m = 1, 497.50, p = 0.000331, q = 0.100088, w = 0.140595, and
ν = 0.187188. The goodness of fit are
R2 = 99.84% and BIC=10,566.52. 228
Figure 95 Fit of Model 3 with Facebook’s active users dataset. mF(t) is the total users, mR(t) is the inactive users, and mA(t) is the active users. The unit of these functions are thousands of people. The parameters are m = 1, 967.64, p = 0.000184, q = 0.097867, w = 0.330511, and ν = 0.006912. The goodness of fit are R2 = 99.83% and BIC=11,485.68 228
xxviii List of Tables
Figure 96 Fit of Model 4 with Facebook’s active users dataset. mF(t) is the total users, mR(t) is the inactive users, and mA(t) is the active users. The unit of these functions are thousands of people. The parameters are m = 1, 854.85, p = 0.000183, q = 0.099738, w = 0.334454, and
ν = 0.007007. The goodness of fit are
R2 = 99.84% and BIC=10,724.55 229
L I S T O F TA B L E S
Table 1 Write operation example in a 7-dimensional
memory of data η being written to ξ, one of the activated addresses. 87
Table 2 Comparison of Kanerva’s read and Chada’s
read. Each ξiis an activated hard location and
the values come from their counters. Gray cells’ value is obtained randomly with probability 50%. 90
Table 3 MacBook Pro Retina 13-inch Late 2013 with a
2.6GHz Intel core i5 processor, 6GB DDR3 RAM, and Intel Iris GPU. The SDM settings were: (i) n = 256, r = 103, and H = 1, 000, 000; (ii) n = 1, 000, r = 451, and H = 1, 000, 000; and (iii) n = 10, 000, r = 4850, and H = 1, 000, 000. There is no benchmark for n = 10, 000 because memory is not enough on either RAM or GPU—it would consume 37.25 GB of RAM and 1.2GB of memory in the GPU. For the histogram of durations, see Figures28,29,30, and31. 110
Table 4 iMac Retina 5K 27-inch 2017 with a 3.8GHz
Intel core i5 processor, 8GB DDR4 RAM, and a Radeon Pro 580 8G GPU. The SDM settings were: (i) n = 256, r = 103, and H = 1, 000, 000; (ii) n = 1, 000, r = 451, and H = 1, 000, 000; and (iii) n = 10, 000, r = 4850, and H = 1, 000, 000. There is no benchmark for read and write operations with n = 10, 000 because RAM is not enough to allocate the counters—it would consume 37.25 GB of RAM. For the histogram of durations, see Figures32,33,34, and35. 115
List of Tables xxix
Table 5 Amazon EC2 p2.xlarge with Intel Xeon
E5-2686v4 processor, 61GB DDR3 RAM, and NVIDIA K80 GPU. Running an SDM with n = 256bits, H = 1, 000, 000, and r = 103. The SDM settings were: (i) n = 256, r = 103, and H = 1, 000, 000; (ii) n = 1, 000, r = 451, and H = 1, 000, 000; and (iii) n = 10, 000, r = 4850, and H = 1, 000, 000. There is no benchmark for kernel single_scan5_unroll because it returns the wrong result in this GPU. The problem is related to the premises of the optimization used by this kernel, which are not true for this GPU. For the histogram of durations, see Figures36,33,34, and35. 120
Table 6 Amazon EC2 p3.2xlarge with Intel Xeon
E5-2686v4 processor, 488GB DDR3 RAM, and NVIDIA Tesla V100 GPU. The SDM settings were: (i) n = 256, r = 103, and H = 1, 000, 000; (ii) n = 1, 000, r = 451, and H = 1, 000, 000; and (iii) n = 10, 000, r = 4850, and H = 1, 000, 000. There is no benchmark for kernel single_scan5_unroll because it returns the wrong result in this GPU. The problem is related with the premises of the optimization used by this kernel, which are not true for this GPU. For the histogram of durations, see Figures40,41,42, and43. 125
Table 7 Dual process theories. 198
Table 8 Desiderata of open-source, creative-common
deliverables, longer-term. Some of these items are mature for wide dissemination, whereas others are in planning phase. For an online SDM course, for instance, we might partner with a Ph.D. program in the Teaching of Mathematics and Physics, such as IM/UFRJ [96], who are intent on developing and
measuring the effects of new educational tools. 203
Part I
1
I N T R O D U C T I O NIt is still an unending source of surprise for me to see how a few scribbles on a blackboard or on a sheet of paper could change the course of human affairs. — Stanislaw Ulam If anything good can ever be said about the second world war, it might be this: the war effort sparked a massive number of scientific fields.
Though most fields existed prior to the war, after the war they were funded by the public as strategic pieces of the major nations arsenal against future conflagrations. One of the fields in question was that of Management Science (also called Operations Research in military circles, as researchers filled the ranks of planners of war operations). Management Science had started as an industrial field, in movements stemming from Taylor and the origin of the production line by Henry Ford. That was the first moment in industry in which operations were systematically subject to some of
the tools of science: measurement, experimentation,
hypothesis-testing, statistics, mathematical optimization, etc.
This humble beginnings date from almost 100 years ago. Today the field has advanced to a great number of nations, and the amount of applications has grown explosively. Of particular interest to us is the advent of the computer, and of engineering efforts that brought expo-nential growth in computational power to the hands of individuals. Whilst, during the war, computations were mostly done by hand, the electronic computer took over afterward; up to an extent that it is not outlandish to say that this original field can be referred to, today, as computational management science.
Applied mathematics and computer science serve simultaneously as a theoretical foundation and the major tool available to the field. Though this is a doctoral thesis concerning business, in this document one should expect to find the language and nomenclature of mathematical modeling and computer science as our primary and most natural language.
This thesis will explore three different topics related to computing business platforms (Figure 1). Though the range of the topics is large,
as it usually is in management science, it is my hope to convince readers of the value of this doctoral thesis brought by three specific, self-contained, scientific papers — the first of which studies the possibility of distributed financial ledgers.
4 i n t r o d u c t i o n
(a) (b)
(c) (d)
(e) (f)
Figure 1: Slides from an old Linhares’ class; a viewpoint that has influenced the choice of topics found in this thesis. In the history of comput-ing business, the most interestcomput-ing level of analysis seems to be that of the platform. It is where things can go on top of, and communi-ties emerge, and standards fight against each other, and fortunes are built or lost. It is, in a sense, a major part of the Big Drama of our moment in history. Each time a new computing platform appears, it seems as the opportunities are ripe for the taking; as if a multitude of doors have opened simultaneously. Note that the slides were made in 2007, and expected an AI-based ‘semantic rev-olution‘ by 2015 [130]. In between, both the iPhone (and
competi-tors) and Bitcoin (and competicompeti-tors) have created giant platforms on top of which immense wealth has been created (Uber, Insta-gram, etc, on the case of smartphones; and exchanges, miners, in-vestors, payment processors, etc., in the case of blockchains). The key point is that we should (i) expect new, unforeseen, technologi-cal platforms, (ii) rapidly identify them, and (iii) throw our energy at them, as they offer leverage to make an asymmetric impact.
1.1 distributed financial ledgers 5
1.1 d i s t r i b u t e d f i na n c i a l l e d g e r s
The World Bank estimates that there are two billion people without access to financial services. As banks are unable to sustain operations in numerous poverty-stricken areas, services such as money transfers, access to credit, digital/distant payments, inflation protection, etc., remain beyond reach for ‘the unbanked’. This seems to be one of the factors that perpetuate poverty. The Bill and Melinda Gates Foundation chose as focus of its “Level-One project”: to provide basic financial services through cell phones. Another initiative, the United Nations World Food Programme has begun, in 2017, an experiment in Jordan, in which the organization provides funds for thousands of people towards its goal of food relief. An interesting aspect of this program has been the format of the funds distributed: they have been all on the ethereum blockchain [162,163,199].
The possibility of having a completely digital financial system without the overheads of traditional banking systems has appeared with the release of Bitcoin and similar blockchain technologies. This field questions numerous traditional assumptions in computer science, record-keeping, banking & finance, and economic inclusion. The seminal work of Nakamoto [145] described the architecture of
Bitcoin, a peer-to-peer electronic cash system, also known as cryptocurrency. Bitcoin’s currency ledger is public and stored in a blockchain across thousands of computers. Even so, no one is able to spend either somebody else’s funds nor to double spend their own funds. In order to be confirmed, each transaction must be both digitally signed by the owner of the money and the funds verified in the blockchain by Bitcoin’s miners. The question of whether Bitcoin (or related works) can scale to billions of people is, however, far from settled.
One of the interesting parts of Bitcoin are the incentives. On one hand, users have incentive to use Bitcoin because the fees are small, the money transfer is quick and global, and the currency issuance rate is well known. On the other hand, the miners have incentive to be part of Bitcoin’s network because, every ten minutes, new coins are found and transactions’ fees are collected. These incentives keep the community together and have maintained Bitcoin alive.
The impact of Bitcoin in society — and hence in the companies and the government — has been growing every day. People are increasingly using Bitcoin to exchange money and transfer money overseas. Companies are looking into Bitcoin as an alternative to reduce banking fees. The poor may be included in the finance system through Bitcoin. People may hedge their assets against their governments’ money issuance and inflation — as in the case of Venezuela.
6 i n t r o d u c t i o n
Bitcoin is the first and most famous cryptocurrency, used worldwide, with a highly volatile market cap, as of this writing, of $ 192B. Even so, it faces serious scalability challenges; such as serious quality of service and network congestion when the number of transactions per second is high, and an increase in the transaction fees and uncertain delays in transactions’ confirmations.
Note that these problems have been a deliberate decision from the current developers of the “bitcoin-core”, which believe that is it risky to increase the blocksize (in which all transactions are stored). It is not known whether a blocksize, say, of 1GB, would be feasible to sustain the decentralization of the network.
Iota is a second cryptocurrency that, instead of using a blockchain, proposes the use of a “tangle architecture”: a different way to register the currency ledger across thousands of computers. Although it has not been confirmed in practice yet, its architecture seems to be significantly more scalable than Bitcoin’s blockchain. As we will see, the problem here is exactly the opposite of Bitcoin’s. Iota needs a minimum number of transactions per second in order to work properly.
Our analysis suggests an architecture for a distributed currency which is inspired by both Bitcoin’s blockchain and Iota’s tangle in order to solve the scalability problems. While Bitcoin’s network saturates when it hits a certain number of transactions per second, Iota’s does not work properly with less than a certain number of transactions per second. Our proposed architecture seems to work in both scenarios: low and high number of transactions per second.
In this first study we will investigate some issues regarding this possibility, namely: (i) cryptographic security and game-theoretical attacks; (ii) scalability; (iii) self-governance of the system; (iv) appropriate incentive system to all participants.
A second topic that may have an outsized influence on business and that we will be taking a closer look at is a model of artificial intelligence — and of human decision making.
1.2 s pa r s e d i s t r i b u t e d m e m o r y
A significant part of the thesis is devoted to Sparse Distributed Mem-ory, or SDM for short. There are two reasons for that: first, it is an im-portant topic in artificial intelligence and computational cognitive sci-ence — a crucial piece of technology that may eventually have vast influence throughout society.
But it is perhaps more than that. Perhaps it is a crucial item in understanding human decision making. SDM may, perhaps, bring us a formal model of recognition-primed decision, put forth by Gary Klein as a theory of decision-making.
1.2 sparse distributed memory 7
1.2.1 Decisions with serious skin in the game
The recent field of naturalistic decision making stands as a new alternative model of study of decision-making. It bears contrast to both the classical model of rational choice and to the program of heuristics and biases.
The classical model of rational choice and optimization which has been the basis of studies in economics (for instance, in game theory), management science and operations research (in for example mathematical programming models), and in artificial intelligence (the symbols and search paradigm), proposes a set of standard, quantitative, methods in order to ‘rationally’ select a choice. Under this theory, the decision-maker:
1. identifies a set of options,
2. identifies ways of evaluating these options,
3. weighs each evaluation dimension,
4. calculates a rating of each option, and, finally,
5. selects the one with the maximum score.
Note that this model implies that, in order to have a number of choices to choose from, one must first have (i) perceived a problem, and (ii) perceived a set of alternative choices — where do the choices come from? What psychological process brings forth their emergence? The rational model will deal only with the phase of (iii) selecting one choice from the set.
Despite its widespread use in a number of distinct areas, the rational choice model has not found to be psychologically plausible, for a number of reasons [160]. One of the reasons is that the chosen
alternative depends on how decision-makers initially frame a problem [101]. There has been strong criticism of the rational choice
model from the heuristics and biases research program, in which problems are carefully devised to show that one’s intuitions generally depart from the expected optima, and are generally inconsistent with what would be expected as rational. A large number of biases that depart from rational choice have been found (see, for instance, Plous [160]), placing strain on the traditional
rational actor doctrine. Yet the heuristics and biases studies are concentrated on carefully devised questionnaires applied mostly to undergraduate students — not on real world settings with serious skin in the game.
Thus a new field of naturalistic decision-making emerged, in which the focus is centered around real life settings and decisions being made under rapidly changing circumstances. A number of studies have been conducted, from firefighters to nurses to chess players to
8 i n t r o d u c t i o n
military personnel. One of the most interesting theories to emerge from naturalistic decision-making, the recognition-primed decision model, was devised by Klein [117] and his colleagues.
1.2.1.1 Recognition-primed decision
Consider the following cases:
EXAMPLE #1. The Cuban World Chess Champion José Raoul Capablanca once remarked about his personal, subjective, experience: ‘I know at sight what a position contains. What could happen? What is going to happen? You figure it out, I know it!’ In another occasion, talking about the numerous possibilities that less-skilled players usually consider on each board position, he bluntly remarked: ‘I see only one move: The best one.’ Perhaps the reader may think that Capablanca was quite simply being arrogant. But there is evidence to the contrary, that expert decision-makers actually are biased towards very high quality choices. We believe that, in fact, Capablanca was telling us an important fact about expert human psychology and decision-making, which would later be documented in recognition-primed decision studies.
EXAMPLE #2. A baby at an infirmary suddenly turns blue. Within seconds, a nurse has a diagnosis and a potential action. In this case, the nurse thinks the baby has a pneumopericardium, which means the sac surrounding the baby’s heart is inflated with air, and the resulting pressure detracts from the heart’s pumping of blood. There is a problem with this diagnosis, though. The electrocardiogram is showing a healthy 80 beats per minute. If nothing is done, the baby will die within a few minutes. The doctor walks into the room to find the nurse screaming for silence and listening to the baby’s heart with an stethoscope. She is now sure of her diagnosis, and she gives the doctor a syringe: “stick the heart, it’s a pneumopericardium, I know it”. Given the electrocardiogram, other nurses are skeptical, until the x-ray operator screams out: “she’s right!” Her intuitive diagnosis ultimately saves the baby’s life.
Klein [117] conducted a series of studies with decision-makers
under rapidly changing scenarios. During interviews, when questioned how a specific decision (or course of action) was adopted, decision-makers such as the nurse would proclaim, to Klein’s frustration, that they ‘did not make decisions’. One experienced firefighter proclaimed ‘I don’t make decisions–I don’t remember when I’ve ever made a decision’ [117], p.10. Decision-makers did not
seem to be comparing alternative courses of actions, as classical models would predict. ‘It is usually obvious what to do in any given situation’ (p.11). Repeated statements of the sort by different decision-makers led Klein to propose a psychologically plausible model of decision-making which radically departed from the
1.2 sparse distributed memory 9
established view of ‘comparing alternatives and selecting the optimum’.
Klein [117] proposed a model of recognition-primed decision, in
which experienced decision-makers would find themselves
immersed in complex situations and rapidly take adequate courses of action. Decision-makers would rapidly perceive cues from any situation and retrieve from episodic memory similar situations, which would bring assessments and diagnoses and plausible courses of action. Because priming mechanisms are automatic and unconscious [12, 13], these decision-makers reported doing ‘the
obvious’ action in different situations. This ‘obvious’ course of action, Klein proposes, is brought from long-term episodic memory by priming mechanisms. Hence, decision-makers would not be selecting among distinct alternatives, but rather simply performing the automatically-provided action.
Even if the ‘obvious’ action seemed plausible for a theory, another problem remained: if decision-makers did not compare alternatives, then how could they know that a course of action was good? In subsequent interviews, evidence emerged that decision-makers would be using the simulation heuristic, proposed by Kahneman and Tversky [102]. That is, facing a particular situation, experienced
decision-makers would be primed towards a particular course of action, to the detriment of most alternative courses of action. This primed alternative would be ‘simulated’, or ‘run through’, one’s mind, and, if found acceptable during the simulation processing, would be acted upon without further deliberation. If problems emerged during mental simulation, another different course of action would be primed. Thus was born a theory of intuitive decision-making, in which experienced people would not be selecting choices from a vast set of alternatives, but instead ‘testing’ their initially primed predispositions with a simulation heuristic.
This model, of course, applied only to expert decision-makers with years of experience. It involves access to a large episodic memory in order to rapidly retrieve a suitable course of action. This was initially found surprising by Klein:
Before we did this study, we believed the novices impulsively jumped at the first option they could think of, whereas experts carefully deliberated about the merits of different courses of action. Now it seemed that it was the experts who could generate a single course of action, while novices needed to compare different approaches. (p.21)
Because priming mechanisms that brought plausible actions to mind are unconscious, people would report having “done the obvious thing to do”. Decision-makers would be unable to visualize
10 i n t r o d u c t i o n
the cognitive processes underlying their decisions, and would in many cases even believe that they had skills of the ‘fantastic’ persuasion: One firefighter demands that his whole crew abandon operations inside a house, just to see it collapse seconds afterward. A radar operator would ‘chill’ after spotting a new track, and would fire counter missiles against it, based on the ‘feeling’ that it was a hostile missile. It took over a year for this radar operator, after being carefully and repeatedly interviewed, to understand the incredibly subtle cues that he was responding to whenever he perceived the new radar track. Unable to reasonably explain their life-saving, rapid, decisions, both the firefighter and the radar operator thought that they had ESP or other fantastic abilities. Careful probing would show that they were able to unconsciously perceive subtle cues, which primed them towards adequate responses.
Beyond a formalization of this process of memory recall, Sparse Distributed Memory will offer us a plausible, both psychologically and neuroscientifically, path towards artificial intelligence.
1.2.2 Artificial Intelligence
Technology has been one of the underlying engines behind economic growth. It has been changing the whole society – people, companies, and governments. Cities and houses had to be rethought when cars became popular. Trains allowed distant places to exchange high volume of goods. Airplanes and boats opened countries to overseas business. And, finally, the internet has had a profound impact in nearly everyone’s life, as it changed everything – from the way we communicate, behave, do business, do shopping, share ideas, and so forth.
One area of technology that has been redefining business is computer science. Together with the internet, computer science has been one of the most important tools to scale a business model – and create many others which were impossible before. More and more expensive human labor has been replaced by algorithms. Managers are able to make better decisions because they receive real-time information. The supply chain has incredibly evolved thanks to advances in logistics supported by routing algorithms, storage algorithms, and many others optimization algorithms.
Artificial intelligence has been disrupting many businesses. Uber is able to handle hundreds of thousands of requests. Amazon optimizes the location of each product based on demand. Netflix increases the quality of their services offering movies specific to the taste of each customer. Spotify learns which kind of music users like the most and suggests playlists. Banks prevent fraud by classifying which patterns seem to be erratic towards their customers’ previous behavior.
1.3 diffusion of innovation 11
It is gradually becoming impossible to imagine a world without artificial intelligence.
Behind artificial intelligence systems, there is pattern recognition: the capacity to match information from new data with information which has already been seen and is stored in memory. It may be used in classification, face recognition, character recognition, and so forth. Even if AI cannot yet solve numerous hard problems — such as the Turing Test, Bongard Problems or simply understanding when ‘Lawyers are sharks’ [79–81, 129] — it is clear that the technology
must be taken seriously.
The second paper lies at the intersection of cognitive psychology, computer science, neuroscience, and artificial intelligence. Sparse Distributed Memory, or SDM for short, is a theoretical mathematical construct that seems to reflect a number of neuroscientific and psychologically plausible characteristics of a human memory. SDM has already been used to different pattern recognition problems, like noise reduction, handwriting recognition, robot automation, and so forth.
We implement a BW-Complete1
SDM framework that not only shows small discrepancies from previous theoretical expectations, but also may be of use to other researchers interested in testing their own hypotheses and theories of SDM. The computer code has been used in a previous Ph.D. Thesis; the code has shown some small discrepancies from theoretical expectations; the code has been run on a number of different architectures and information-processing devices (e.g., CPUs, GPUs). The framework enables us to have a visual exploration previous experiments and new possibilities for SDM.
1.3 d i f f u s i o n o f i n n ovat i o n
In 2014, a group of Princeton’s researchers predicted that Facebook’s users would abandon the platform by 2017 [37]. The forecast was
done applying a disease spreading model which has correctly predicted the abandonment of “MySpace”. Facebook replied after applying Princeton’s methodology:
“Using the same robust methodology featured in [Princeton’s] paper, we attempted to find out more about this ‘Princeton University’ — and you won’t believe what we found!”. Then, they conclude: “This trend suggests that Princeton will have only half its current enrollment by 2018, and by 2021 it will have no students at all,
agreeing with the previous graph of scholarly
1 ‘BuzzWord-Complete: the model is (i) Open-Source, (ii) Cross-Platform; (iii) highly parallel; (iv) able to execute on CPUs and/or GPUs; (v) it can be run on the ‘cloud’; etc.
12 i n t r o d u c t i o n
scholarliness. Based on our robust scientific analysis, future generations will only be able to imagine this now-rubble institution that once walked this earth”.
Whilst this brouhaha reminds one of the dangers of extrapolation, our third paper will revisit the prospects of our esteemed colleagues in Facebook. Lying at the intersection of Marketing, Diffusion of Technological Innovation, and modeling, the Bass model of diffusion of innovation will be extended, in order to account for users who, after adopting the innovation for a while, decide to reject it later on (possibly bringing down the number of active users—something impossible in Bass’ original model). Four alternative mathematical models are presented and discussed with the Facebook’s users dataset.
1.4 t h e f i n e p r i n t...
Before embarking on the technical topics, small qualifications must be asked from my readers. First, as stated above, though these problems have immense and urgent importance to the fields of study in business, the language in which we will approach them and discuss them most naturally will be that of mathematics and
computer science. There will not be surveys, interviews,
questionnaires, or such methods typically used in the social sciences: This is basically a work of modeling.
A second and final qualification: It is my hope that readers of this thesis will accept the format of self-contained studies, as just as valid as a monograph on a particular topic. With these qualifications, we are ready to venture into the world of computational management science.
Part II
H AT H O R : A N A LT E R N AT I V E T O WA R D S A S C A L A B L E C R Y P T O C U R R E N C Y
2
I N T R O D U C T I O NOnce I understood the logic behind change addresses... ripemd160(SHA256(pubkey))... the inneficiency... the wasted space; the wasted energy... something clicked. This is military-grade cryptography and full-blown paranoia. Other than that, it’s a get-rich-quick-scheme that looks exactly like a get-rich-quick-scheme. — Alexandre Linhares, EBAPE/FGV
We are watching History being made. Or History being repeated. — David Collum, Cornell University, 2013
The primary problem for creating digital money is how to prevent double spending. As the money is digital, and copies can be made ad nauseam, what can prevent counterfeiting? What would prevent users from sending copies of the same money to two (or more) people? That is precisely the problem solved by Bitcoin and its underlying Blockchain technology. The current solution behind fiat money is having a single issuer, a central bank — then trusting the financial institutions and regulators.
The concept of transferring money using cryptography as an underlying technology was briefly presented in 1983 by Chaum [42]
and was deepened in a theoretical paper in 1985 [43]. However, it
was only in 1988 that Chaum et al. [44] created the term electronic
cash and also proposed a basic and practical scheme which yielded untraceability yet allowed to trace double spendings.
According to Barber et al. [11], despite the 30-year literature on
e-cash, most of the proposed schemes requires a central authority which controls the currency issuance and prevents double spending [35, 36, 42, 153]. Some papers even propose solutions in a similar
trajectory to Bitcoin, such as hash chain [202] and preventing double
spending using peer-to-peer networks [91,154]. The no central point
of trust and predictable money supply together with a clever solution
16 i n t r o d u c t i o n
to the double-spending problem is what separates Bitcoin from the previous e-cash philosophies.
Bitcoin (BTC) is a digital currency, also known as digital money, internet money, and cryptocurrency. It is the first currency based on cryptography techniques which are distributed, decentralized, and with no central bank.
Bitcoin is a computer network in which nodes act like clerks performing clearing. A transaction clearing consists of ensuring that the transaction is settled according to the rules. In order to do that, every node stores a copy of Bitcoin’s ledger, which records both all transactions and users’ balance. When new transactions are added to the ledger, the balances are updated. It is said that Bitcoin is distributed because its ledger is public and is stored in thousands of computers. Even though the ledger is public, balances are
anonymous, and no one knows who owns which funds1
. If an attacker tries to change anything, the remaining of the network is able to detect it and ignore the change.
Bitcoin is considered decentralized because there is no authority (or government) who decides its future. Every decision must be accepted by its community, and no one can enforce their will. Every change proposal must be submitted to the community who will discuss the matter and come to a verdict. If the majority of Bitcoin’s community agrees on a decision, they just have to update their clearing process accordingly, and the changes are applied.
The security of Bitcoin relies on digital signature technology and network agreement. While digital signature ensures ownership, i.e., the funds may only be spent by their owners, and nobody else; the network agreement both prevents double spending and ensures that all processed transactions have sufficient funds. In short, every transaction must spend only unspent funds, must have enough funds available, and must be signed by its owners, authorizing its execution. Only when all these requirements are met, the funds are transferred.
Bitcoin provides interesting incentives to all players (users and miners). On the one hand, users may have incentives to use Bitcoin because (i) the fees are small and do not depend on the amount being transferred — but only in the size (in bytes) of the transaction —; (ii) the transfers will be confirmed in a well-known period; (iii) it is not possible to revert an already confirmed transfer, not even with a judicial order; and (iv) and the currency issuance rate is well-known and preset in Bitcoin’s rules, which makes Bitcoin’s supply predictable and trustworthy, different from fiat currencies which depends on decisions of their central banks — i.e., it would be
1 There are some techniques which may de-anonymize transactions in specific situa-tions, even when users are using Tor network. For further information, see Biryukov et al. [18], Jawaheri et al. [98], ShenTu and Yu [175].
i n t r o d u c t i o n 17
virtually impossible to face a hyper inflation in Bitcoin due to currency issuance. On the other hand, miners have incentive to mine Bitcoin because new Bitcoins are found every ten minutes, and they may also collect the fees of unconfirmed transactions. It is important to highlight that anyone can become a miner, and there is no entry cost besides the mining equipment. These incentives have kept the Bitcoin network up and running since 2009 with barely any interruptions (99.99% uptime). For further information about incentives, see Catalini and Gans [38], Ma et al. [133].
Since 2009, Bitcoin has been growing and becoming more and more used all around the world. It started as an experiment based on a seminal work by Nakamoto [145] and expanded to the most
important and successful cryptocurrency with a highly volatile $192 billion market capitalization, as of this writing [51]. There are
hundreds of companies investing in different uses of the technology, from exchanges to debit cards, and billions of dollars being invested in the new markets based on Bitcoin’s technology.
Despite Bitcoin’s huge success, there are still many challenges to be overcome. We will focus on the following challenges: scaling, spamming, and centralization. One important challenge that we will skip is to reduce the size of the ledger (or blockchain), which today is around 125GB and is growing at a rate of 4.5GB per month [22].
The network must scale to support hundreds of transactions per second, while its capacity is around only eight transactions per second. Thus, the more Bitcoin becomes popular, the more saturated the network is. Network saturation has many side effects and may affect the players’ incentive to keep the network running. The transaction fees have to be increased to compete for faster confirmation. The pool of unconfirmed transactions grows indefinitely, which may cause some transactions to be discarded due to low memory space available, as the previously predictable confirmation time of transactions becomes unpredictable.
The scaling problem is not precisely an issue of Bitcoin, but an issue of the Blockchain technology. Hence, all other Blockchain-based cryptocurrencies have the same limitations, such as Litecoin, Bitcoin Cash, and Ethereum. One may argue that increasing the maximum block size is a feasible solution to scaling, but I would say that it is just a temporary solution which buys some time until the next network saturation.
Bitcoin seems to have the most decentralized network among the cryptocurrencies, even so, there are a few miners and mining pools which together control over 50% of the network’s computing (hash)power (for details, see Gencer et al. [83]). Hence, they have an
oversized influence when it comes to changes in the Bitcoin protocol’s behavior. They may also cooperate in an attack, voiding transactions which seemed confirmed. The more decentralized, the
18 i n t r o d u c t i o n
more trustworthy Bitcoin is. This centralization problem is seen as an important challenge.
Generating new transactions in Bitcoin has a tiny computational cost because one only has to generate the transaction itself, digitally sign it, and propagate it in the Bitcoin network. On the one hand, it means that any device is capable of generating new transactions, but, on the other hand, it makes Bitcoin susceptible to spam attacks. One may generate hundreds of thousands of new valid transactions, overloading the unconfirmed transactions pool and saturating the network. This spam problem has happened several times and affects Bitcoin’s trustworthiness. Parker [157] reports a possible spam attack
lasting at least a contiguous 18 months.
The number of ideas and publications focusing on improving Bitcoin’s design and overcoming those challenges is increasing every day. Many of these proposals are organized into BIPs (Bitcoin Improvement Proposals) which are discussed and implemented by the community; while others come in the form of whitepapers and alternative software forks (which would include the need of a protocol upgrade). Other proposals are published in blogs and forums, describing new cryptocurrencies. Bitcoin’s community hardly ever publishes their ideas in academic journals, preferring instead, of BIPs, white papers, and web discussions.
Since the launch of Bitcoin, more than 1,000 other cryptocurrencies have been created [50]. In general, they are Bitcoin-like, which
means they use similar technologies, including the blockchain. Some cryptocurrencies differ a lot from Bitcoin, like the ones which use the Directed Acyclic Graph (DAG) model [65,124,125,161,185,194].
We are especially interested in one of them: Iota.
Iota uses a DAG model, called Tangle, which has a different design than Bitcoin’s blockchain. It has neither mining nor confirmation blocks and transaction fees. Each transaction has its own proof-of-work2
and is used to confirm other transactions, forming a directed acyclic graph of transactions. Thus, a transaction is said to be confirmed when there is enough proof-of-work from the transactions confirming it either directly or indirectly. There is no other way to confirm transactions other than generating new transactions.
In Iota, as transactions confirm transactions, the network benefits from a high volume of new transactions. Therefore, theoretically, it scales to any large number of transactions per second. The scaling problem of Tangle is exactly the opposite of Bitcoin’s: it must have at least a given number of transactions per second; otherwise, the transactions are not confirmed, and the cryptocurrency does not
2 The mechanism that assures the immutability is the proof-of-work, which makes it computationally infeasible to tamper with transactions. It will be explained later in details.