ORIGINAL ARTICLE
Polymeric microparticles for modified release of
NPK in agricultural applications
Ju´nior Olair Chagas
a, Jose´ Messias Gomes
a, Isabela Cristina de Matos Cunha
a,
Nathalie Ferreira Silva de Melo
b, Leonardo Fernandes Fraceto
c,
Gilmare Antoˆnia da Silva
a, Fabiana Aparecida Lobo
a,*a
Department of Chemistry, Institute of Exact and Biological Sciences, Federal University of Ouro Preto, Ouro Preto, MG 35400-000, Brazil
b
Department of Immunology and Molecular Biology, Faculty of Dentistry and Center for Dental Research Sa˜o Leopoldo Mandic, Campinas, SP 13045-755, Brazil
c
Department of Environmental Engineering, State University of Sa˜o Paulo Ju´lio de Mesquita Filho, Sorocaba, SP 18087-180, Brazil
Received 8 August 2017; accepted 5 March 2018
KEYWORDS
Polymeric microparticles; Modified release; Fertilizers; Polyglycerol;
Multivariate optimization
Abstract The aim of this work was to synthesize polymeric microparticles as carriers for nitrogen, phosphorus, and potassium (NPK fertilizer) for agricultural applications, using polyglycerol (PG) to improve the synthesis procedure. Multivariate experimental designs were employed to obtain a satisfactory synthesis. The desirability function identified the best conditions for preparation of the microparticles as being 100.00 mg of poly(e-caprolactone) (PCL), 825.00 mg of PG, 9.25 mL
of chloroform, and 0.9% w/v of polyvinyl alcohol (PVA). This resulted in average encapsulation rates of 94.23% for N, 99.80% for P, and 65.00% for K. The profile of release from the micropar-ticles was according to diffusion following Fick’s Law. These observations confirmed the capacity of the proposed microparticles to sustain a continuous and prolonged release of NPK for the pur-pose of plant fertilization.
Ó2018 Production and hosting by Elsevier B.V. on behalf of King Saud University. This is an open access
article under the CC BY-NC-ND license (http://creativecommons.org/licenses/by-nc-nd/4.0/).
1. Introduction
Fertilizers are inorganic or organic chemical compounds, alone or in mixtures, which are produced naturally or synthet-ically, with the capacity of supplying some of the thirteen essential nutrients necessary for plant development. They are extensively applied in agriculture to improve crop yields (de Urzedo et al., 2013).
Among the principal essential plant nutrients, nitrogen, phosphorus, and potassium (NPK) are required in higher con-centrations (mmol/kg dry mass) for plant growth, relative to
* Corresponding author.
E-mail address:[email protected](F.A. Lobo). Peer review under responsibility of King Saud University.
Production and hosting by Elsevier
King Saud University
Arabian Journal of Chemistry
www.ksu.edu.sa
www.sciencedirect.com
the other elements. Nitrogen is crucial because it is needed for vigorous plant growth and protein production. Phosphorus is important in cell division and the formation of cellular struc-tures in the plant. It also stimulates healthy root growth, is essential for seed germination, and aids in the conversion of solar energy into chemical energy for photosynthesis. Finally, potassium is necessary for fruit formation, confers resistance against diseases and winter, is essential for photosynthesis, and maintains the hydric levels in plants (Ghormade et al., 2011; Carson and Ozores-Hampton, 2013).
Studies have demonstrated that most of the fertilizers used lose part of their nutrients to the environment, which can lead to environmental contamination. Fertilizers containing nitrates and phosphates can lose these compounds by leaching, generating eutrophication processes in surface waters and groundwater. Furthermore, when fertilizers are not applied correctly, they can cause an imbalance in the ecosystem and increase the number of acute toxicity and carcinogenic sources for humans, especially in the case of sandy soils exposed to high rainfall or intense irrigation (Lezcano et al., 2002; Manolikar and Sawant, 2003; Azeem et al., 2014; Hanafi et al., 2000). Therefore, fertilizer usage is an activity that should take into consideration the economic, environmental, and social sustainability of the agricultural sector.
Over the last few years, controlled/modified nutrient release technology has emerged as an important way to mitigate prob-lems associated with the use of substances such as anesthetics, antibiotics, herbicides, and pesticides, among others (Carson and Ozores-Hampton, 2013; Lezcano et al., 2002; Manolikar and Sawant, 2003; Azeem et al., 2014; Hanafi et al., 2000; Grillo, 2011; Silva de Melo et al., 2010). This technology can be used to modify the physical-chemical properties of fertiliz-ers, assisting in soil management and supplying the nutritional needs of plants.
Several studies reported in the literature describe the devel-opment of formulations for the modified release of fertilizers, notably natural or synthetic organic fertilizers and low solubil-ity inorganic compounds (Azeem et al., 2014). However, to the best of our knowledge, there have been no studies involving the association of nitrogen, phosphorus, and potassium in microstructured polymeric systems. The term ‘‘controlled microstructured release system”is used for those that present particles in the size range 1–1000µm and that have the capacity to release the active substance(s) in a continuous and prolonged manner. Due to these properties, such systems present advan-tages including the ability to reduce the amount of the chemical substance necessary and hence diminish contamination risks; the capacity to reduce energy consumption by reducing the number of applications needed; and the ability to maintain ele-vated concentrations for longer periods than achieved with conventional applications, this being one of the main goals of new fertilization strategies (Silva de Melo et al., 2010; Grillo et al., 2014; Guo et al., 2014; Assis et al., 2012).
Biodegradable polymers are the materials most widely used in the preparation of modified release systems, since they degrade to carbon dioxide, water, and biomass (organic matter) as a result of the action of enzymes or microorganisms (Martins Franchetti and Marconato, 2006; Schaffazick et al., 2003), avoiding adverse effects in the environment. These polymers have been exhaustively studied for the synthesis of micro- and nanostructures, with aliphatic polyesters being the most attrac-tive, due to their biodegradability, biocompatibility, lack of
tox-ins, and capacity to incorporate a wide range of hydrophobic substances. Poly(e-caprolactone) (PCL) is a biodegradable
polymer that is water-insoluble and degrades slowly without damaging the environment, which are the reasons for its selec-tion in the synthesis of carrier systems (Smidsrod and Skjakbraek, 1990; Espevik et al., 1993; Fialho et al., 2008).
Polyglycerol (PG), with properties similar to those of the alginate polymers, is obtained by the polymerization of glyc-erin, which is generated in abundance during biodiesel produc-tion. For this reason, the development of processes for the management of this residue is of great value, especially from the environmental perspective. One way to use PG is to incor-porate this polymer in the synthesis of modified release sys-tems, providing a way of using/recycling an industrial waste
that would otherwise have few relevant applications
(Medeiros et al., 2010; Eliana et al., 2012).
The aim of this study was to develop and characterize PCL/ PG microparticles as nutrient transport systems for NPK, in order to produce an alternative fertilizer for agricultural usage. A new formulation is proposed that employs glycerin, an industrial waste that still has few important applications in industrial processes, to produce polyglycerol.
2. Experimental
2.1. Materials
The following reagents were used in the synthesis and charac-terization of the microparticles: ammonium molybdate, boric acid, copper sulfate, chloroform, ethanol, methyl blue; methyl red, methyl orange, nitric acid, PCL, PVA, NPK standard solution (999 ± 4 mg/L), stannous chloride, and sodium hydroxide (all from Sigma-Aldrich); glycerol, sodium carbon-ate, sulfuric acid, and phenolphthalein (from Synth); and polyglycerol (70% m/m, from Verti Ecotecnologias UFMG).
All solutions were prepared with analytical grade reagents and deionized water from a Milli-Q (Millipore Corporation) system. All glassware was previously soaked for 24 h in baths containing 10% (v/v) HNO3 (Synth). All the solutions used
were stored at 8°C for preservation.
2.2. Instrumentation
The following instruments were used in this study: Aname Q150R S metalizer, Biospectro ABB Model MB 3000 IV infra-red spectroscope, Du Pont SDT2960 thermogravimetric anal-ysis (TGA) system, Excelsa II 206 BL centrifuge, Hidrosan 50–320°C heating plate, Hot Lab II Nalgon magnetic agitator, incubator with orbital agitation, JEOL 1200 scanning electron microscope (SEM), Quimis Kjeldahl Macro distillation device, Nova E´tica 404/D oven with range 50–200°C, Pike Technolo-gies Crushir press, SpectrAA 50B atomic absorption spec-trophotometer, Thermo Scientific Orion Star A221 pH meter, and Varian 220-2000UV UV–Vis spectrophotometer.
2.3. Multivariate optimization of the preparation of NPK-loaded PCL/PG microparticles
2009; Souto et al., 2012) and involves the interfacial deposition of a polymer after the displacement of a semi-polar solvent, miscible in water, from a lipophilic solution.
For this study, the organic phase contained suitable amounts of the PCL and PG polymers, chloroform, and an ali-quot of water for PG dissolution. The aqueous phase was com-posed of PVA, deionized water, and a 1.00 mL aliquot of NPK standard solution. The solubilization of PVA was performed in water at 70°C, under constant magnetic agitation. After disso-lution of the components of both phases, the organic phase was added to the aqueous phase, using a syringe. The resulting suspension was homogenized under magnetic stirring for 4 h and was then kept at atmospheric pressure for 24 h for com-plete evaporation of the organic solvent (chloroform). A con-trol formulation was prepared without the nutrients.
The proposed particle synthesis procedure involved several variables that directly influenced the system under investiga-tion. Therefore, it was essential to use statistically designed multivariate experiments to determine the effects of the vari-ables and obtain the optimum conditions for preparation of the particles. The synthesis was performed according to the multivariate experimental approaches presented inTables S1 and S2(Supplementary Information).
Definition of the levels at which the variables were studied in the screening was based on preliminary tests in the labora-tory and literature reports for similar samples, since there have been no previous studies concerning the specific synthesis pre-sented here. A 25-1fractional factorial design with resolution V was performed (Table S1), with triplicate of the central point. The independent variables investigated were PCL mass (mPCL), PG mass (mPG), chloroform volume (VChl), water
vol-ume (VH2O), and PVA concentration (CPVA).
Electronic spreadsheets were employed (Teofilo and Ferreira, 2006) to generate the codification of the experiments, taking into consideration the combinations between the pro-posed levels, and also for the statistical treatment of the results. The response parameter was the percentage rate of NPK nutrient association (NA%) with the microparticles. This was of great importance, because it indicated the degree to which the polymeric particles were able to associate with the target substances for future modified release; particles with poor degrees of association tend to have a short useful life, with the concentration available being insufficient for slow and continuous controlled release (Grillo, 2011; Silva de Melo et al., 2010; Grillo et al., 2014).
The NPK percentages associated with the microparticles were determined by specific methods for each chemical ele-ment. Samples of 100 mL of suspensions of microparticles con-taining NPK were slowly filtered through Nalgon 3552 blue ribbon quantitative paper filters. The NA% value was then determined by the difference between the quantified nutrient concentration in the filtered solution and the total concentra-tion (100%) of the nutrient present in the microparticle sus-pension (Eq.(1)) (Grillo, 2011; Silva de Melo et al., 2010).
NA%¼ðXo XfÞ
Xo
100% ð1Þ
where Xois the nutrient concentration in the microparticle
sus-pension and Xfis the quantified nutrient concentration in the
filtered solution.
For nitrogen quantification, 100 mL of the sample was digested on a hotplate at 320°C with 50 mL of a solution
con-taining 134 g/L potassium sulfate, 7.3 g/L copper sulfate, and 134 mL/L sulfuric acid. Following the digestion, addition was made of 300 mL of distilled water and 50 mL of a solution containing sodium hydroxide (50% m/v) and sodium thiosul-fate (2.5% m/v). This mixture was filled into a Kjeldahl flask using a dosage cup, followed by traditional Kjeldahl distilla-tion. The product of the reaction was placed in an Erlenmeyer flask containing a boric acid solution. This acidic solution was made with 20 mg of methyl red, 10 mg of methyl blue, and 20 g of boric acid, in an acetic medium. Finally, the distilled solu-tion was titrated with 0.01 mol/L sulfuric acid (A modified kjeldahl flask for determining soil nitrogen, 1914).
Phosphorus was quantified according to the stannous chlo-ride method (Davies et al., 1973). The filtrate was diluted 100 times and the diluted sample was digested with 1.00 mL of concentrated sulfuric acid and 5 mL of concentrated nitric acid on a plate heated to 250°C. After that, 20 mL of distilled water and 0.05 mL of phenolphthalein were added to the fil-trate. This solution was neutralized with a solution of 6.0 mol/L sodium hydroxide and was then titrated with a solution obtained by mixing concentrated sulfuric acid with concen-trated nitric acid. Finally, addition was made of 4.00 mL of ammonium molybdate solution (35 g of ammonium molyb-date and 280 mL of sulfuric acid for one liter of solution) and 0.5 mL of stannous chloride medium (2.5 g of stannous chloride in 100 mL of glycerol). The solution obtained was analyzed using a UV–Vis spectrophotometer, at 690 nm, in a 10 mL glass cuvette. The analytical curve was constructed using serial dilutions of a 100 mg/L phosphorus standard solution.
Quantification of potassium was performed using a flame atomic absorption spectrophotometer. The operational condi-tions were 5 mA lamp current, air/acetylene flame and air aux-iliary gas, oxidizing flame stoichiometry, wavelength of 766.55 nm, and slit width of 1.0 nm. A multivariate study (Chagas et al., 2016) was performed to determine the ideal conditions for sample preparation, with the most efficient digestion achieved with 5 mL of filtrate and 10 mL of concentrated nitric acid, at 60°C, under magnetic agitation for 90 min. The result-ing solutions were made up to 100 mL in volumetric flasks, prior to subsequent analysis of potassium.
The quantification methods were validated according to the protocol (DOQ-CGCRE-008: Revision 03 – Feb/2010) of the Brazilian National Institute of Metrology, Quality, and Tech-nology (INMETRO).
The conditions that generated the best NA% values were selected and the significant variables and levels were studied using response surface methodology.
A central composite design (CCD) was used for optimiza-tion of the synthesis process for the polymeric microparticles loaded with NPK. The variables and levels evaluated in this step are provided inTable S2.
2.4. Size measurements
Size measurements of the microparticles synthesized under the optimum conditions was performed using 100 mL of suspen-sion completed with a volume of 200 mL of deionized water, with half of the suspension being filtered through a JP 40 white quantitative filter paper. The material retained on the paper fil-ter was stored in a desiccator. Affil-ter drying completely, a 10 mg portion of the sample was placed on a carbon strip. The sam-ples were metalized by the deposition of gold (100–200 nm) under vacuum, followed by morphological analysis using a scanning electron microscope (SEM). The size distributions were measured and expressed as the average of three determinations.
2.5. Chemical stability measurements
The chemical stability of the optimized formulation was eval-uated by measuring the pH of the suspension of PCL/PG microparticles loaded with NPK, as a function of time, since a change in pH can be indicative of particle degradation. The pH measurements were made during a period of 90 days, using a potentiometer calibrated with standard buffer solu-tions (pH 4.01, 7.00, and 10.01). Measurements were also made of particle size and NA% during the same period, in order to evaluate degradation of the microparticles.
2.6. NPK release experiments
The profile of release of the NPK from the microparticles was performed undersinkconditions, using a modified methodol-ogy described by Asrar et al. (2004) and Ramos Campos et al. (2015). The assays were performed with a system of tubes, where the microparticle formulations were placed in contact with deionized water in order to release the nutrients. A volume of 400 mL of microparticle suspension was pre-pared, with 10 mL aliquots being transferred to Falcon tubes that were closed and shaken at 150 rpm, at room temperature. The samples were collected at times of 0, 10, 15, 30, 60, 120, 240, 480, 960, and 1440 min. At each time, three tubes were removed from the shaker and centrifuged in order to sediment the microparticles. The supernatant was filtered through quan-titative filter paper and the nutrients were analyzed. The con-centrations obtained were converted into released nutrient percentages, using a solution of free nutrients as a standard.
Analysis of the mechanism of NPK release from the PCL/ PG microparticles employed the theoretical models proposed by Higuchi and Korsemeyer-Peppas, with determination of the kinetic parameters (Grillo, 2011; Silva de Melo et al., 2010; Schaffazick et al., 2003; Ramos Campos et al., 2015; Lobo et al., 2011).
2.7. Characterization using infrared spectroscopy
The KBr tablet method was used for analysis of the samples by infrared spectroscopy. Approximately 100 mg portions of the PVA and PCL polymers, microparticles without associated NPK (controls), and microparticles loaded with NPK were dried in an oven for 15 min at 85°C. Approximately 2.0 mg of the polymers and microparticles were macerated separately using a quartz mortar and pestle, followed by compressing in
an 8-ton press. Fourier transform infrared spectroscopy (FTIR) analyses were then performed in the range from 4000 to 400 cm 1, at 4 cm 1 resolution, with 32 scans of each sample.
2.8. Characterization by thermogravimetric analysis
Thermogravimetric analysis (TGA) enabled evaluation of the release of water, using a heating rate of 20°C/min from 0 to 600°C. Masses of approximately 10 mg were uniformly dis-tributed in aluminum crucibles to ensure fine and homoge-neous layers. The analyses of PCL and PVA were performed in an atmosphere of synthetic air at a flow rate of 100 mL/ min, while an atmosphere of nitrogen at a flow rate of 100 mL/min was used for PG and the microparticles.
3. Results and discussion
3.1. Multivariate optimization of the synthesis of microparticles loaded with NPK
Preparation of the PCL/PG microparticles was performed according to Fessi’s method, involving the mixing of an organic phase into an aqueous phase, with some modifications (Besheer et al., 2009; Souto et al., 2012). This method is advan-tageous, compared to other synthesis methods with pre-formed polymers, since it is easy and fast, with no need for high energy homogenization (Schaffazick et al., 2003).
For the variables mPCLand mPG, the principle adopted was
that the greater the polymer mass, the greater the NA% of NPK, since it is known that the higher the polymer concentra-tion, the higher is the adsorption/association of the active agent (Silva de Melo et al., 2010; Lobo et al., 2011; Grillo et al., 2012). In addition, combinations of masses of PCL and PG were defined that were able to provide formation of the microparticles. In preliminary tests, it was observed that for masses below 100 mg of PCL and 300 mg of PG, precipita-tion of the particles was inefficient (with a lack of opacity of the suspension indicating that negligible quantities of particles had been formed), even after 6 h of mechanical agitation. This effect was even more pronounced when the system was kept at temperatures higher than room temperature (60–80°C).
Due to the insolubility of PG in chloroform, a water-chloroform mixture was added during preparation of the organic phase, resulting in increased efficiency of the precipita-tion process after 4 h. Since the literature does not describe the presence of water in the organic phase, only small water vol-umes were used in the mixtures (Silva de Melo et al., 2010; Souto et al., 2012; Grillo et al., 2012).
For CPVA, different concentrations were tested in order to
define the levels at which this variable should be investigated. It was found that the precipitation process was hindered when the PVA concentration was below 0.3% m/v, resulting in an absence of particles. Therefore, the PVA concentration was set at 0.3% m/v for the lowest level ( 1) of the factorial design in the screening phase.
methods described in Section2.3, and the results obtained are presented inTable 1.
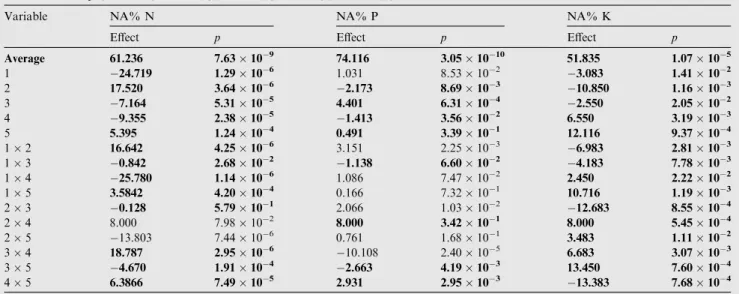
The NA% results for N (Table 1) showed that all five stud-ied variables had significant effects on the system (Table 2), with mPCL having the greatest influence, followed by mPG, VH2O, VChl, and CPVA. For the NA% of P (Table 2), only
mPGdid not have a significant effect on the system, while the
variable with the greatest influence was VChl, followed by VH2O, mPCL, and CPVA. For the NA% of K (Table 2), all the
variables had significant effects on the system, with the most
influential being CPVA, followed by mPG, VH2O, mPCL, and
VChl. The errors associated with each effect were evaluated
using thettest (a= 0.05).
Analysis of the influence of the PCL mass showed that this variable had a significant effect on the NA% of NPK, with the best results obtained at 100 mg. Due to its high molar mass, PCL precipitates more rapidly, compared to the polymers with low molar mass, when the internal phase is added to the exter-nal phase, leading to increased incorporation of the active agents. Given the requirement for smaller particles, a suitable
Table 1 Results (NA% values for nitrogen, phosphorus, and potassium) of the 25-1fractional factorial design with resolution V, including three replicates at the central point (assays 17–19), for optimization of the experimental conditions for synthesis of the microparticles loaded with NPK. The values in parentheses represent the decodified levels. mPCL(g) = poly(e-caprolactone) mass; mPG
(g) = polyglycerol mass; VChl(mL) = chloroform volume;VH2O(mL) = water volume; CPVA(% m/v) = polyvinyl alcohol solution
concentration.
Assay mPCL mPG VChl VH2O CPVA NA% N NA% P NA% K
1 1 (0.1) 1 (0.3) 1 (9.0) 1 (3.0) +1 (0.7) 79.28 70.87 56.66 2 +1 (0.5) 1 (0.3) 1 (9.0) 1 (3.0) 1 (0.3) 47.06 69.34 53.73 3 1 (0.1) +1 (0.9) 1 (9.0) 1 (3.0) 1 (0.3) 79.65 63.91 48.26 4 +1 (0.5) +1 (0.9) 1 (9.0) 1 (3.0) +1 (0.7) 88.07 69.13 55.46 5 1 (0.1) 1 (0.3) +1 (15.0) 1 (3.0) 1 (0.3) 45.07 87.82 53.00 6 +1 (0.5) 1 (0.3) +1 (15.0) 1 (3.0) +1 (0.7) 36.79 77.61 85.73 7 1 (0.1) +1 (0.9) +1 (15.0) 1 (3.0) +1 (0.7) 36.03 79.78 48.80 8 +1 (0.5) +1 (0.9) +1 (15.0) 1 (3.0) 1 (0.3) 72.36 86.08 10.33 9 1 (0.1) 1 (0.3) 1 (9.0) +1 (9.0) 1 (0.3) 56.09 76.74 53.73 10 +1 (0.5) 1 (0.3) 1 (9.0) +1 (9.0) +1 (0.7) 20.05 82.17 46.06 11 1 (0.1) +1 (0.9) 1 (9.0) +1 (9.0) +1 (0.7) 70.50 74.78 53.00 12 +1 (0.5) +1 (0.9) 1 (9.0) +1 (9.0) 1 (0.3) 34.84 74.34 60.80 13 1 (0.1) 1 (0.3) +1 (15.0) +1 (9.0) +1 (0.7) 90.68 72.60 59.26 14 +1 (0.5) 1 (0.3) +1 (15.0) +1 (9.0) 1 (0.3) 1.78 70.43 52.73 15 1 (0.1) +1 (0.9) +1 (15.0) +1 (9.0) 1 (0.3) 88.45 68.26 57.13 16 +1 (0.5) +1 (0.9) +1 (15.0) +1 (9.0) +1 (0.7) 47.06 73.91 61.00 17 0 (0.3) 0 (0.6) 0 (12.0) 0 (6.0) 0 (0.5) 82.44 71.95 49.26 18 0 (0.3) 0 (0.6) 0 (12.0) 0 (6.0) 0 (0.5) 82.29 70.87 49.80 19 0 (0.3) 0 (0.6) 0 (12.0) 0 (6.0) 0 (0.5) 83.03 73.04 50.73
Table 2 Effect values for the 25 1fractional factorial design with resolution V, for the association rates (NA%) of N, P, and K in the investigation of the synthesis of microparticles loaded with the nutrients. The values in bold are those found to be significant according to the value ofp(a= 0.05). 1 = mPCL, 2 = mPG, 3 = VChl, 4 = VH2O, 5 = CPVA.
Variable NA% N NA% P NA% K
Effect p Effect p Effect p
Average 61.236 7.6310 9 74.116 3.0510 10 51.835 1.0710 5
1 24.719 1.2910 6 1.031 8.5310 2
3.083 1.4110 2
2 17.520 3.6410 6 2.173 8.69
10 3 10.850 1.16
10 3
3 7.164 5.3110 5 4.401 6.31
10 4 2.550 2.05
10 2
4 9.355 2.3810 5 1.413 3.56
10 2 6.550 3.19
10 3
5 5.395 1.2410 4 0.491 3.39
10 1 12.116 9.37
10 4
12 16.642 4.2510 6 3.151 2.25
10 3 6.983 2.81
10 3
13 0.842 2.6810 2 1.138 6.60
10 2 4.183 7.78
10 3
14 25.780 1.1410 6 1.086 7.47
10 2 2.450 2.2210 2
15 3.5842 4.2010 4 0.166 7.3210 1
10.716 1.1910 3
23 0.128 5.7910 1 2.066 1.0310 2
12.683 8.5510 4
24 8.000 7.9810 2 8.000 3.4210 1 8.000 5.4510 4
25 13.803 7.4410 6 0.761 1.6810 1 3.483 1.1110 2
34 18.787 2.9510 6 10.108 2.4010 5 6.683 3.0710 3
35 4.670 1.9110 4 2.663 4.1910 3 13.450 7.6010 4
polymer concentration is necessary to enable rapid solvent dif-fusion, reducing the average size of the drops of the resulting dispersion and leading to smaller particles with greater NA % values (Eliana et al., 2012). It could therefore be inferred that the increase of NA% observed during the screening was directly related to the PCL concentration during the process of formation of the microparticles.
As a rule, the solvent emulsification/evaporation method is used to prepare nano/microspheres containing lipophilic active principles. The hydrophilic active principles considered here (NPK) have lower affinity for the PCL, generating nano/ microspheres with a low rate of encapsulation, since these types of active compounds tend to disperse from the internal phase to the external one during the process of spontaneous emulsification (Eliana et al., 2012; Besheer et al., 2009). Hence, it is necessary to diminish the diffusion using other strategies. Here, a hydrocarbon chain (PG) was used, as justified by the fact that the PG mass was significant for the association rates of N and K, since it decreased the tendency of the nutrients to disperse to the external phase, consequently increasing the NA % values.
Considering the effects of the chloroform and water vol-umes, it was observed that these variables were significant for all the NA% values (15.00 mL (+1) for VChl and 3.00
mL ( 1) for VH2O). This was due to the polar/non-polar
(water/chloroform) co-solvents system used, with an increase of the organic solvent volume creating microspheres with smal-ler dimensions, consequently hindering the incorporation of the active agents (Eliana et al., 2012; Lobo et al., 2011; Grillo et al., 2012). Therefore, in this study, the use of greater volumes of organic solvent led to reduced NA% values.
Finally, it was observed that an increase of CPVAgenerally
favored the NA% of NPK, since it altered the interfacial energy so that it did not remain constant and, consequently, there was the formation of ideally sized particles for incorpo-ration of the three active nutrients (Besheer et al., 2009). In other words, the highest CPVAvalues studied led to a reduction
of the interfacial energy for formation of the particles. After the initial screening, all the influences investigated were subjected to evaluation using response surface methodol-ogy. However, for the systems that used chloroform and water as co-solvents, higher water volume values hindered interac-tion of the nutrients (NPK) with PCL, leading to low NA% values (Eliana et al., 2012; Besheer et al., 2009). Therefore, due to the significance of theVH2Ovariable, it was set at the
lowest level studied (3.00 mL, negative effect; Table 2) for the response surface (Hanafi et al., 2000; Grillo, 2011; Silva de Melo et al., 2010; Ramos Campos et al., 2015; Fialho et al., 2008), since the preliminary tests showed that values below 3 mL were unfavorable for the precipitation process.
With the purpose of obtaining the greatest NPK encapsula-tion rate of the microparticles after the synthesis, a central composite design (CCD) was performed as part of the response surface evaluation stage. A CCD is a set of technical and mathematical statistics used for the development, improvement, and optimization of chemical, physical, and bio-logical processes, among others (Teofilo and Ferreira, 2006; Silva, 2007; Ferreira et al., 1999). This technique evaluates the significant variables in more detail, because it presents a greater number of levels and allows the evaluation of modeling using higher orders, such as in the case of quadratic models (Teofilo and Ferreira, 2006).
For the microparticles synthesis presented here, a model was established correlating the association rates for N, P, and K with the variables PCL and PG masses, chloroform vol-ume, and PVA concentration in the solution.
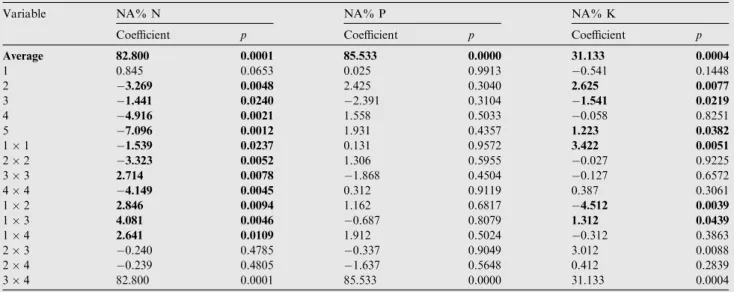
All the synthesized particles were analyzed using the meth-ods described in Section 2.3. The results (Table 3) confirmed the significance of the variables mPG, VChl, and CPVAfor the
NA% of N, with a greater encapsulation rate (assay 24) observed at the mPGcentral point of 450 mg, the VChlcentral
point of 15.5 mL, and a CPVAlevel of 1.05% (m/v). It was also
observed that the system presented nonlinear behavior, since the quadratic interactions of all the variables were significant Table 3.
For the NA% of P (Table 3), the results of the CCD demonstrated that none of the variables significantly affected the system. The highest association rate of the microparticles (assay 6) was observed at the second lowest level studied for mPCL (100 mg, negative effect), at the second highest level
for mPG (600 mg, positive effect), at the second lowest level
for VChl(13.00 mL, negative effect), and at the second highest
level for CPVA(0.90% m/v, positive effect).
For the NA% of K (Table 3), the CCD results confirmed the significance of the variables mPGand VClo, with the highest
microparticle encapsulation rate observed at the highest level studied for mPG(750 mg, positive effect) and the central point
for VChl(15.5 mL). It was also noted that the system exhibited
nonlinear behavior, since the quadratic interactions of the vari-ables 1 (mPCL) and 2 (mPG) were significant.
The errors associated with each coefficient were evaluated using thettest (a= 0.05).Table 4presents the effect of each
variable on the nutrient association rate.
Analysis of variance was applied to the models in order to determine the statistical significance of the coefficients (Teofilo and Ferreira, 2006; Silva, 2007; Rodrigues and Sanson, 2014) related to the parameters mPCL; mPG, VChl, and CPVA.
ANOVA calculations were used to examine the overall signif-icance of each term in the model, compared to the residual error (Teofilo and Ferreira, 2006; Rodrigues and Sanson, 2014). Terms with p below 0.05 were considered significant (a= 0.05).
For all the nutrients, the ANOVA coefficients were statisti-cally valid (at the 95% confidence level), although most of them showed lack of fit at the same confidence level. Although the models had not been fitted (p= 0.0066, 0.0012, and 0.0139, for N, P, and K, respectively), it was possible to find regions indicative of the optimum experimental conditions.
Fig. 1 compares the results of the screening experiments, performed according to the 25 1 fractional factorial
experi-mental design, with those for the CCD, under the operational conditions that provided highest NA% for NPK. The compar-ison showed that there were improvements in most of the NA % values when the response surface methodology was used. Although the NA% of K was lower when this procedure was used, relative to the response obtained in the screening, the values for the other elements increased, reflecting improved optimization. Furthermore, the NA% value achieved for K was sufficient for subsequent satisfactory release.
24-1fractional design was used, followed by a Doehlert design. No significant regressions were obtained in the response sur-faces constructed for almost all the contaminants, although significant improvements were observed in terms of increased
chromatographic peak areas of the analytes. In the present case, the optimization procedure could be considered highly successful, since it was possible to achieve enhanced nutrient association rates.
Table 4 Coefficient andpvalues (a= 0.05) of the spherical central composite design for the NA% of nitrogen, phosphorus, and
potassium in the study of the synthesis of the PCL/PG microparticles. The values in bold are those that showed significance, according to the value ofp. 1 = PCL mass; 2 = PG mass; 3 = chloroform volume; 4 = PVA solution concentration.
Variable NA% N NA% P NA% K
Coefficient p Coefficient p Coefficient p
Average 82.800 0.0001 85.533 0.0000 31.133 0.0004
1 0.845 0.0653 0.025 0.9913 0.541 0.1448
2 3.269 0.0048 2.425 0.3040 2.625 0.0077
3 1.441 0.0240 2.391 0.3104 1.541 0.0219
4 4.916 0.0021 1.558 0.5033 0.058 0.8251
5 7.096 0.0012 1.931 0.4357 1.223 0.0382
11 1.539 0.0237 0.131 0.9572 3.422 0.0051
22 3.323 0.0052 1.306 0.5955 0.027 0.9225
33 2.714 0.0078 1.868 0.4504 0.127 0.6572
44 4.149 0.0045 0.312 0.9119 0.387 0.3061
12 2.846 0.0094 1.162 0.6817 4.512 0.0039
13 4.081 0.0046 0.687 0.8079 1.312 0.0439
14 2.641 0.0109 1.912 0.5024 0.312 0.3863
23 0.240 0.4785 0.337 0.9049 3.012 0.0088
24 0.239 0.4805 1.637 0.5648 0.412 0.2839
34 82.800 0.0001 85.533 0.0000 31.133 0.0004
Table 3 NA% results for nitrogen, phosphorus, and potassium from the experiments of the central composite design with three replicates at the central point (assays 25–27) used for synthesis of the microparticles loaded with NPK. The values in parentheses represent the decodified levels. mPCL(g) = poly(e-caprolactone) mass; mPG(g) = polyglycerol mass; VChl(mL) = chloroform volume; VH2O(mL) = water volume; CPVA(% m/v) = polyvinyl alcohol solution concentration.
Assay mPCL mPG VChl CPVA NA% N NA% P NA% K
Overall, in the approach used for construction of the response surface, the variables behaved in a similar manner to the results of the screening. However, the effect of mPG
deserves special attention. According to the results obtained
in the screening, the use of higher PG mass values improved the NA% of N and K, with this effect being directly related to decreased diffusion of the nutrients from the organic phase to the aqueous phase (Besheer et al., 2009; Teofilo and Ferreira, 2006). A similar effect was evidenced in the response surface analysis, although evaluation of the variables at a greater number of levels indicated that PG mass values lower than those tested could provide the system with conditions for the formation of microparticles.
Evaluation of the effects of the variables in the CCD for the NA% of NPK revealed that the polyglycerol mass had a greater influence on the NA% of P and K, compared to the other variables (Table 4). This demonstrated that the presence of polyglycerol was crucial for increasing the encapsulation of the nutrients in these microparticles. In commercial terms, it would therefore be strategically important to consider the use of polyglycerol in the production of microparticles loaded with NPK. As far as is known, there are currently no systems using this polymer available for the release of NPK in agricul-tural applications.
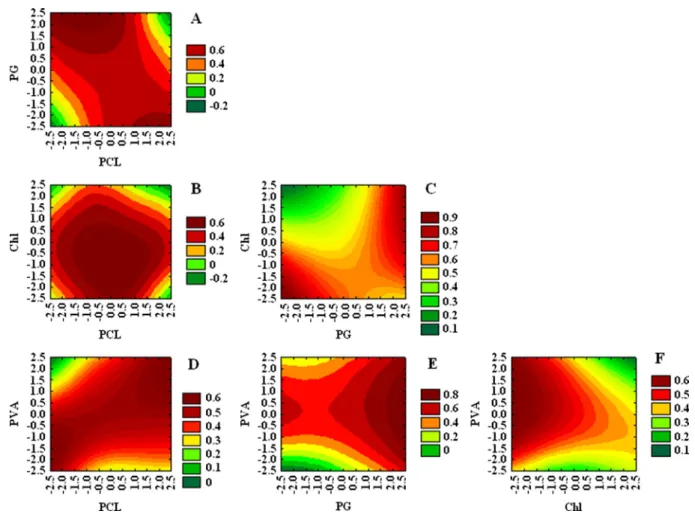
From the NPK NA% results (Table 4), the desirability function (Fig. 2) was used to simultaneously obtain the responses for the elements studied and identify the optimal synthesis conditions.
0 20 40 60 80 100 120
No multivariate experimental design
Screening CCD
Association rates for
NPK (%
) NA% N NA% P NA% K
Fig. 1 Comparison of the association rates (NA%) for nitrogen, phosphorus, and potassium, without application of any experi-mental design, under the best conditions of the screening step, and under the optimized conditions obtained using the central com-posite design.
Fig. 2 Desirability graphs for obtaining the simultaneous optimum association rates of the NPK nutrients in the poly(e-caprolactone)/
polyglycerol microparticles. NA% for the interactions: (A) mPGwith mPCL; (B) VChlwith mPCL; (C) VChlwith mPG; (D) CPVAwith mPG;
(E) CPVAwith mPG; (F) CPVAwith VChl. mPCL(g) = poly(e-caprolactone) mass; mPG(g) = polyglycerol mass; VChl(mL) = chloroform
By simultaneous analysis of the results for the NPK nutri-ent association rates (Fig. 2, where the intense red regions indi-cate the highest nutrient encapsulation rates), it was possible to obtain the optimum condition for the synthesis of the PCL/PG microparticles loaded with NPK, which was as follows: 100.00 mg of PCL, 825.00 mg of PG, 9.25 mL of chloroform, and 0.9% w/v of PVA. This condition resulted in encapsulation rates of 94.23% (N), 99.80% (P), and 65.00% (K), correspond-ing to increases of NA% of 59.68% for N, 50.00% for P, and 18.64% for K. These values could be considered satisfactory, especially since there have been no previous reports in the lit-erature concerning the evaluation of NA% for nutrient sub-stances in formulations produced based on the use of glycerol. On average, the values obtained were generally simi-lar to those reported in the literature for other substances (Table S3).
Use of the experimental multivariate methodologies and the desirability function enabled the simultaneous achievement of satisfactory encapsulation rates for the three nutrient elements, especially considering that in the preliminary tests, the NA% values obtained were 60.00% for N, 66.66% for P, and 12.11% for K. The higher values for the encapsulation of N and P in the PCL/PG microparticles could be attributed to the fact that these nutrients present high solubility in water, which enhances the interaction with PG. A possible reason for the lower encapsulation rate of K, relative to the other nutrients, could have been related to competitive interactions among the nutrients.
3.2. Microparticle size measurement and chemical and physical stability
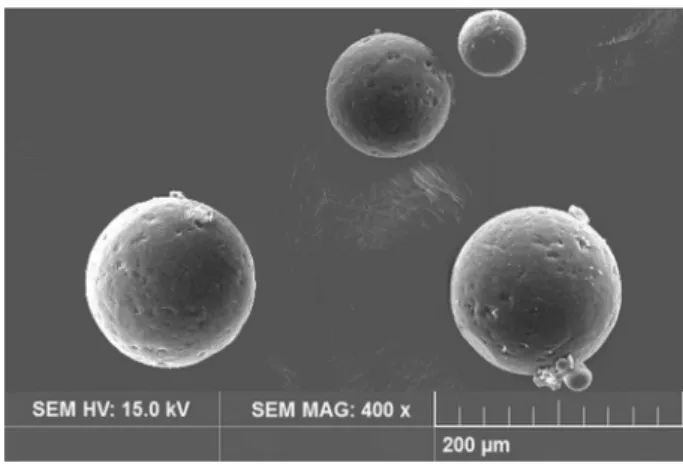
Fig. 3 shows the morphology of the surfaces of PCL/PG
microparticles loaded with NPK, obtained by SEM analysis. The SEM images (Fig. 3) showed that the methodology adopted for the synthesis was effective, with the formation of slightly rough spherical microparticles with diameters between 5 and 60µm. The particles could be classified as microspheres, because there was no presence of oil in the organic phase employed for their formation (Eliana et al., 2012; Souto et al., 2012).
Evaluation of the chemical stability of the PCL present in the microparticles was performed by monitoring the pH of the suspensions, as a function of time (Fig. S1). This analysis provides an important means of determining the chemical sta-bility of this polymer, since a change in the pH can indicate its degradation in the solution (Grillo, 2011; Silva de Melo et al., 2010). The results (Fig. S1) showed that the microparticle for-mulation containing NPK had an initial pH of 2.18 and that there was no significant pH change during 60 days (a deviation of 0.02 could be attributed to the variability of the instrumen-tal response). It has been found that changes in the pH of car-rier particles can be explained by the presence of oil in the organic phase, with polymer aggregation leading to the con-comitant release of the oil into the surrounding medium (Eliana et al., 2012). However, this did not occur in the present study, because the microparticles produced did not contain oil. Therefore, it could be concluded from the pH measurements that the particles developed in this study presented good stability.
The morphological features of the microparticles and the nutrient encapsulation rates were also evaluated (Figs. S2 and S3), concomitant to the pH study. The initial average size of the microparticles containing NPK was 8.00 ± 0.15µm, while the initial NA% values were 96.27 ± 0.40% for N, 96.58 ± 0.50% for P, and 59.62 ± 0.53% for K. During the course of 60 days, both the microparticle size and the NA% values for the three nutrients decreased, for which a possible explanation was the release of nutrients to the external medium.
3.3. Release experiments
The release experiments enabled observation of the effects of the association of NPK with the PCL/PG microparticles on the release profiles of these nutrients. In these assays, the free nutrients (control) and the microparticles loaded with NPK were placed in direct contact with deionized water, enabling determination of the effect of the association on the release kinetics of the nutrients.Fig. 4 shows the release percentage curves for free NPK and for the nutrients associated with the microparticles, as a function of time.
It can be seen fromFig. 4that compared to the free forms of the nutrients, the associated K and P presented slower and more continuous release during the period up to approxi-mately 800 min, while faster release was observed for N, with a maximum reached after around 500 min. The results
con-Fig. 3 Scanning electron microscope images of the poly(e
-caprolactone)/polyglycerol microparticles containing the nutrients nitrogen, phosphorus, and potassium, at 400 magnification. SEM HV = Scanning Electron Microscope High Vacuum; MAG = Magnification.
Fig. 4 Cumulative release (%) of nitrogen, phosphorus, and potassium, free and loaded into poly(e-caprolactone)/polyglycerol
firmed that the association of NPK with the microparticles modified the release profiles of these nutrients, relative to the free forms.
In order to obtain information about the possible mecha-nisms involved in NPK release from the PCL/PG micro-spheres, linearization of the release curves was performed using the Korsemeyer-Peppas and Higuchi mathematical mod-els (Silva de Melo et al., 2010; Schaffazick et al., 2003). The possible mechanisms include desorption from the surface, dif-fusion through the pores of the matrix or polymeric wall, and disintegration or erosion (Eliana et al., 2012; da Costa, 2002). The model that provided the best fit (correlation coefficient > 0.9) to the profile of N release from the PCL/PG microparticles developed here was the Korsemeyer-Peppas model, while the Higuchi model provided the best fits to the P and K release profiles.
The Higuchi model is a semi-empirical model that describes the release of a substance according to a diffusion mechanism based on Fick’s Law (ft) (Silva de Melo et al., 2010; Schaffazick et al., 2003; da Costa, 2002), and can be used to evaluate the modified release from polymeric materials (Silva de Melo et al., 2010; Grillo et al., 2014). According to this model (Eq. (2)), the results showed that the nutrients P and K were released by diffusion based on Fick’s Law.
For N, the slopen(linear coefficient, B) obtained by fitting using the Korsemeyer-Peppas model was determined by the natural logarithm of the release rate as a function of the natu-ral logarithm of the release time. Fitting of the data using the Korsemeyer-Peppas model resulted in a release exponent value ofn= 0.49, indicating that N was released by diffusion based on Fick’s law.
The results showed that the mechanism controlling the release of NPK from the PCL/PG particles was diffusion according to Fick’s Law. This is a process whereby the mate-rial is transported from one place to another in the interior of the system itself, with random molecular movements that occur within short distances. Therefore, the release of NPK from the PCL/PG particles occurred in the following manner: water diffused into the polymeric matrix of the particles, the nutrients dissolved, and they were then transported out of the matrix (Souza et al., 2007).
3.4. Characterization by FTIR and TGA
The FTIR analysis provided important structural information, including the chemical composition and the conformational and configurational features.Fig. 5 presents the IR spectra for PG, PVA, PCL, and the microparticles. The PCL spectrum showed main absorption bands at 1150–1200 cm 1(OACAO symmetric vibration), 1240 cm 1(C
AOAC asymmetric vibra-tion), and 1700–1760 cm 1 (carbonyl vibration). The PVA spectrum presented bands at 3440 cm 1 (stretching of the
OH group), 2900 cm 1 (asymmetric vibration of the OH group), 1375 cm 1 (coupling between the OH groups), and 1420 cm 1(CH vibration). The polyglycerol presented bands characteristic of the glycerol groups, at 3386 cm 1 (OH stretching), 1215 cm 1(secondary alcohol CAO bond symmet-ric stretching), and 1045 cm 1 (primary alcohol CAO bond stretching).
The microparticles developed in this study presented bands characteristic of PCL and PVA, indicating that there was no
chemical interaction between these polymers and the polyglyc-erol; in other words, the NPK carrier microparticles were com-posed only of PCL. However, the polyglycerol was very important in the synthesis of the particles, as observed in the multivariate optimization. The presence of this polymer hin-dered diffusion of the NPK nutrients towards the aqueous phase (polyvinyl alcohol) during the synthesis procedure, as previously discussed, and in doing so, significantly increased the NA%.
Fig. 6presents the curves obtained in the thermogravimet-ric analyses of PCL, PG, PVA, and the microparticles synthe-sized in this study.
During heating up to 100°C, there were continuous initial mass losses of 0.28% for PCL, 9.91% for PG, 4.78% for PVA, and 0.92% for the microparticles, which could be attributed to the loss of absorbed water. The main thermal event for polyg-lycerol, with a maximum mass loss rate at approximately 220 °C, could be attributed to decomposition of the compound. At
600°C, almost 80% of the total polyglycerol sample mass had been lost.
PCL showed a maximum rate of mass loss at around 405 °C, with the degradation starting at approximately 250°C.
This process resulted in complete degradation and loss of the poly(e-caprolactone).
The thermogravimetric curve for the NPK-loaded PCL/PG microparticles presented a mass loss profile similar to that
Fig. 5 Infrared spectra of polyglycerol (PG), polyvinyl alcohol (PVA), poly(e-caprolactone) (PCL), and the PCL/PG
microparticles.
Fig. 6 Thermogravimetric analysis plots of the masses of polyglycerol (PG), polyvinyl alcohol (PVA), poly(e-caprolactone)
obtained for PCL. This similarity in thermal behaviors indi-cated that the carrier microparticles were composed only of PCL, in agreement with the infrared spectra (Fig. 5) and the statistical results for optimization of the synthesis of the NPK-loaded microparticles.
Emphasis should be given to the importance of polyglycerol in the microparticle synthesis, since it reduced the tendency of the nutrients to disperse to the external phase and conse-quently increased the NA% values for the nutrients. The use of polyglycerol was crucial for achieving the high encapsula-tion values and the modified nutrient release profiles, which were the main goals of this work.
4. Conclusions
Optimization of an emulsification/evaporation technique was achieved using chemometric approaches (fractional and cen-tral composite designs, and desirability function) to study the influence of the different variables in the system and define the conditions that led to the greatest response in terms of the simultaneous NA% values for nitrogen, phosphorus, and potassium present in the PCL/PG polymeric microparticles. The multivariate experimental designs and the desirability function enabled identification of a suitable experimental con-dition that led to high nutrient associations in the microparti-cles. The NA% values were sufficiently high to ensure the controlled and continuous release of NPK from the micropar-ticles. In addition, the PCL/PG microparticles containing NPK presented high chemical stability (little pH variation), as well as small changes in particle size and nutrient associa-tion rates during a 60-day period. Analysis of the release pro-files using the Higuchi and Korsemeyer-Peppas models showed that NPK was released from the PCL/PG microparticles by diffusion according to Fick’s Law. This study provides support for further investigations of the use of the new formulation for encapsulating NPK in microparticles, and also indicates possi-ble research directions involving the administration of this for-mulation to the soil. In addition, this study has considerable environmental relevance, since it demonstrates a possible application for the glycerin wastes that are produced in very large quantities worldwide.
Acknowledgements
All financial support was Brazilian. Scholarships and financial support for this work were provided by the National Council for Scientific and Technological Development [Conselho Nacional de Desenvolvimento Cientı´fico e Tecnolo´gico (CNPq, grant 479273/2013-8)], the Research Support Founda-tion of Minas Gerais [Fundac¸a˜o de Amparo a` Pesquisa de Minas Gerais (FAPEMIG)], the Minas Chemical Network [Rede Mineira de Quı´mica (RQMG, FAPEMIG CEX -RED-00010-14)] and the Vice-Chancellor’s Office of Research and Graduate Studies [Pro´-Reitoria de Pesquisa e Po´s-Gradua c¸a˜o (PROPP)] of the Federal University of Ouro Preto. The authors also express their gratitude to the Environmental San-itation Laboratory under the coordination of Prof. Dr. Anı´bal da Fonseca Santiago and Prof. Dr. Hubert Mathias Roeser; to the Thermal Analysis Laboratory under the coordination of Prof. Dr. Ka´tia Monteiro Novack; to the Infrared Spec-troscopy Laboratory under the coordination of Prof. Dr.
Lau-rent Fre´de´ric Gil and Prof. Dr. Leandro Vinı´cius Alves Gurgel; and to Verti EcoTecnologias (Minas Gerais, Brazil).
Appendix A. Supplementary material
Supplementary data associated with this article can be found, in the online version, athttps://doi.org/10.1016/j.arabjc.2018. 03.007.
References
A modified kjeldahl flask for determining soil nitrogen, J. Am. Chem. Soc. 36 (1914) 2541–2542.
Asrar, J., Ding, Y.W., La Monica, R.E., Ness, L.C., 2004. Controlled release of tebuconazole from a polymer matrix microparticle: release kinetics and length of efficacy. J. Agric. Food. Chem. 52, 4814–4820.
Assis, L.M.d., Zavareze, E.d.R., Prentice-Herna´ndez, C., Souza-Soares, L.A.d., 2012. Review: characteristics of nanoparticles and their potential applications in foods. Braz. J. Food Technol. 15, 99– 109.
Azeem, B., KuShaari, K., Man, Z.B., Basit, A., Thanh, T.H., 2014. Review on materials & methods to produce controlled release coated urea fertilizer. J. Control. Release 181, 11–21.
Besheer, A., Vogel, J., Glanz, D., Kressler, J., Groth, T., Maeder, K., 2009. Characterization of PLGA nanospheres stabilized with amphiphilic polymers: hydrophobically modified hydroxyethyl starch vs pluronics. Mol. Pharm. 6, 407–415.
Bock, N., Dargaville, T.R., Woodruff, M.A., 2014. Controlling microencapsulation and release of micronized proteins using poly (ethylene glycol) and electrospraying. Eur. J. Pharm. Biopharm. 87, 366–377.
Bosio, V.E., Cacicedo, M.L., Calvignac, B., Leo´n, I., Beuvier, T., Boury, F., Castro, G.R., 2014. Synthesis and characterization of CaCO3-biopolymer hybrid nanoporous microparticles for con-trolled release of doxorubicin. Colloids Surf. BBiointerfaces 123, 158–169.
Carson, L.C., Ozores-Hampton, M., 2013. Factors affecting nutrient availability, placement, rate, and application timing of controlled-release fertilizers for Florida vegetable production using seepage irrigation. HortTechnology 23, 553–562.
Chagas, J.O., Sousa, H.G.L.d., Cunha, I.C.M., Froes-Silva, R.E.S., Silva, G.A.d., Lobo, F.A., 2016. Otimizac¸a˜o multivariada de metodologia para digesta˜o de micropartı´culas polime´ricas car-readoras de ca´tions meta´licos. Quı´mica Nova, 20.
da Costa, P.J.C., 2002. In vitro evaluation of the lyoequivalence of pharmaceutical formulations. Revista Brasileira de Ciencias Far-maceuticas 38, 141–153.
Davies, J.L., Andrews, G.S., Miller, R., Owen, H.G., 1973. Compar-ison of the stannous chloride and vanadate methods for estimation of serum inorganic phosphorus by use of the ‘‘SMA 12–60”. Clin. Chem. 19, 411–414.
de Urzedo, D.I., Franco, M.P., Pitombo, L.M., Do, J.B., 2013. Carmo, Effects of organic and inorganic fertilizers on greenhouse gas (GHG) emissions in tropical forestry. For. Ecol. Manage. 310, 37–44.
Eliana, B.S., Patrı´cia, S., Maria Helena, A.S., 2012. Preparation of polymeric nanoparticles from pre-formed polymers: part II. Polı´meros 22, 101–106.
Espevik, T., Otterlei, M., Skjakbraek, G., Ryan, L., Wright, S.D., Sundan, A., 1993. The involvement of cd14 in stimulation of cytokine production by uronic-acid polymers. Eur. J. Immunol. 23, 255–261.
Fialho, S.L., Behar-Cohen, F., Silva-Cunha, A., 2008. Dexametha-sone-loaded poly(epsilon-caprolactone) intravitreal implants: a pilot study. Eur. J. Pharm. Biopharm. 68, 637–646.
Fialho, S.L., Behar-Cohen, F., Silva-Cunha, A., 2008. Dexametha-sone-loaded poly(epsilon- caprolactone) intravitreal implants: a pilot study. Eur. J. Pharm. Biopharm. 68, 637.
Ghormade, V., Deshpande, M.V., Paknikar, K.M., 2011. Perspectives for nano-biotechnology enabled protection and nutrition of plants. Biotechnol. Adv. 29, 792–803.
Grillo, R., Santo Pereira, A.d.E., Silva de Melo, N.F., Porto, R.M., Feitosa, L.O., Tonello, P.S., Dias Filho, N.L., Rosa, A.H., Lima, R., Fraceto, L.F., 2011. Controlled release system for ametryn using polymer microspheres: preparation, characterization and release kinetics in water. J. Hazard. Mater. 186, 1645–1651.
Grillo, R., Dos Santos, N., Maruyama, C.R., Rosa, A., de Lima, R., Fraceto, L., 2012. Poly(epsilon-caprolactone) nanocapsules as carrier systems for herbicides: Physico-chemical characterization and genotoxicity evaluation. J. Hazard. Mater. 231, 1–9.
Grillo, R., Pereira, A., Nishisaka, C.S., de Lima, R., Oehlke, K., Greiner, R., Fraceto, L., 2014. Chitosan/tripolyphosphate nanoparticles loaded with paraquat herbicide: an environmen-tally safer alternative for weed control. J. Hazard. Mater. 278, 163–171.
Grillo, R., Pereira, A.E.S., Nishisaka, C.S., de Lima, R., Oehlke, K., Greiner, R., Fraceto, L.F., 2014. Chitosan/tripolyphosphate nanoparticles loaded with paraquat herbicide: an environmentally safer alternative for weed control. J. Hazard. Mater. 278, 163–171.
Guo, Y., Yang, Q., Yan, W., Li, B., Qian, K., Li, T., Xiao, W., He, L., 2014. Controlled release of acetochlor from poly(butyl methacry-late-diacetone acrylamide) based formulation prepared by nanoemulsion polymerisation method and evaluation of the efficacy. Int. J. Environ. Anal. Chem. 94, 1001–1012.
Hanafi, M.M., Eltaib, S.M., Ahmad, M.B., 2000. Physical and chemical characteristics of controlled release compound fertiliser. Eur. Polym. J. 36, 2081–2088.
Lezcano, M., Al-Soufi, W., Novo, M., Rodriguez-Nunez, E., Tato, J. V., 2002. Complexation of several benzimidazole-type fungicides with alpha- and beta-cyclodextrins. J. Agric. Food. Chem. 50, 108– 112.
Lobo, F.A., Aguirre, C.L., Santos Silva, M., Grillo, R., Melo, N.F.S., Oliveira, L.K., Morais, L.C., Campos, V., Rosa, A.H., Fraceto, L. F., 2011. Poly(hydroxybutyrate-co-hydroxyvalerate) microspheres loaded with atrazine herbicide: screening of conditions for prepa-ration, physico-chemical characterization, and in vitro release studies. Polym. Bull. 67, 479–495.
Manolikar, M.K., Sawant, M.R., 2003. Study of solubility of isoproturon by its complexation with beta-cyclodextrin. Chemo-sphere 51, 811–816.
Martins Franchetti, S.M., Marconato, J.C., 2006. Biodegradable polymers - a partial way for decreasing the amount of plastic waste. Quimica Nova 29, 811–816.
Medeiros, M.d.A., Rezende, J.d.C., Araujo, M.H., Lago, R.M., 2010. Influence of temperature and nature of the catalyst on glycerol polymerization. Polimeros - Ciencia e Tecnologia 20, 188–193.
Needham, C.J., Shah, S.R., Mountziaris, P.M., Kasper, F.K., Mikos, A.G., 2014. Modulation of polyplex release from biodegradable microparticles through poly(ethylenimine) modification and vary-ing loadvary-ing concentration. Pharm. Res. 31, 77–85.
Prabhakaran, M.P., Zamani, M., Felice, B., Ramakrishna, S., 2015. Electrospraying technique for the fabrication of metronidazole contained PLGA particles and their release profile. Mater. Sci. Eng., C 56, 66–73.
Ramos Campos, E.V., de Oliveira, J.L., Goncalves da Silva, C.M., Pascoli, M., Pasquoto, T., Lima, R., Abhilash, P.C., Fraceto, L.F., 2015. Polymeric and solid lipid nanoparticles for sustained release of carbendazim and tebuconazole in agricultural applications. Sci. Rep. 5.
Rodrigues, K.L.T., Sanson, A.L., Quaresma, A.d.V., Gomes, R.d.P., Da Silva, G.A., Afonso, R.J.d.C.F., 2014. Chemometric approach to optimize the operational parameters of ESI for the determina-tion of contaminants of emerging concern in aqueous matrices by LC-IT-TOF- HRMS. Microchem. J. 117, 242–249.
Schaffazick, S.R., Guterres, S.S.U., Freitas, L.D., Pohlmann, A.R., 2003. Physicochemical characterization and stability of polymeric nanoparticle systems for drug administration. Quimica Nova 26, 726–737.
Silva de Melo, N.F., Grillo, R., Rosa, A.H., Fraceto, L.F., Dias Filho, N.L., de Paula, E., de Araujo, D.R., 2010. Development and characterization of poly(l-lactide) nanocapsules containing benzo-caine. Quimica Nova 33, 65–69.
Silva, G.A., 2007. Utilizac¸a˜o de metodos quimiometricos em cro-matografia gasosa com microextrac¸a˜o em fase solida; Utilization of chemometric methods in gas chromatography with solid phase microextraction. Ph.D thesis, Universidade Estadual de Campinas, Instituto de Quı´mica.
Smidsrod, O., Skjakbraek, G., 1990. Alginate as immobilization matrix for cells. Trends Biotechnol. 8, 71–78.
Souto, E.B., Severino, P., Santana, M.H.A., 2012. Preparation of polymeric nanoparticles by polymerization of monomers - Part I. Polimeros - Ciencia e Tecnologia 22, 96–100.
Souza, J., Freitas, Z.M.F., Storpirtis, S., 2007. In vitro models for the determination of drug absorption and a prediction of dissolution/ absorption relationships. Braz. J. Pharm. Sci. 43, 515–527.