(Annals of the Brazilian Academy of Sciences) ISSN 0001-3765
www.scielo.br/aabc
Uranium-lead dating method at the Pará-Iso isotope geology laboratory,
UFPA, Belém – Brazil
ROBERT S. KRYMSKY, MOACIR J.B. MACAMBIRA, JEAN-MICHEL LAFON and GÉRSON S. ESTUMANO
Universidade Federal do Pará (UFPA), Pará-Iso, Centro de Geociências Rua Augusto Corrêa 01, Caixa Postal 8608, 66075-110 Belém, PA, Brasil
Manuscript received on March 3, 2005; accepted for publication on March 22, 2006;
presented byALCIDESN. SIAL
ABSTRACT
Analytical procedures for U-Pb isotope dilution analyses at the Pará-Iso isotope geology laboratory of the Federal University of Pará (UFPA) are described in detail. The procedures are applied to zircon, titanite, rutile, apatite, columbite-tantalite and whole rock. Reagent preparation and chemical processing are done in clean-room conditions. Samples are dissolved using Teflon™ microcapsules in steel jacket Teflon™ Parr Instrument™ bomb or Teflon™ screw cap containers. U and Pb are separated using anion exchange AG 1x8 resin columns. Typical blanks for mineral sample amounts of 0.01 to 1.0 mg are less than 1 pg U and 20-30 pg Pb. Isotope analysis of the U and Pb from the same filament are carried out using a Finnigan MAT 262 mass-spectrometer in static and dynamic modes. The current analytical level is demonstrated on analyses of international standard zircon 91500 with three different235U-205Pb and 235U-208Pb isotope tracers and whole rock standards. Results of analyses of two zircon samples are also presented. Key words:U-Pb dating, zircon, accessory mineral, isotope dilution.
INTRODUCTION
The installation of U-Pb method began in October 1999 at the Pará-Iso laboratory of isotope geology (Federal University of Pará, Brazil). Before this time, the radio-metric methods performed in routine were Rb-Sr, Sm-Nd, Pb on sulfide, feldspar and whole-rock, and Pb-Pb zircon evaporation. During the first two years, the U-Pb clean room infrastructure was constructed and the necessary equipments were acquired. For base proce-dure, it was used the methodology of Krogh (1973, 1982) for U-Pb analysis of zircon and the technique of Tera and Wasserburg (1975) and Chen and Wasserburg (1981) for analysis of whole rock. During 2000-2001, U-Pb tech-niques for analyses of whole rock and multigrain frac-tions of zircon were installed. Along 2002-2003, U-Pb methods were developed for the analysis of single grain
Correspondence to: Jean Michel Lafon E-mail: [email protected]
of zircon and accessory minerals (apatite, titanite, rutile, tantalite and others). During the first two years, a235 U-208Pb tracer has been used for determination of U and Pb concentrations; the following year we used a235U-205Pb tracer prepared at the University of Brasília, and after, a new235U-205Pb tracer was prepared in the Pará-Iso lab-oratory. Some improvements of analytical procedures aiming blank reduction are in course.
MINERAL SEPARATION
The laboratory for mineral separation is equipped with DensitestTM and turbulent water flux tube for
pre-con-centration of heavy mineral fraction, heavy liquids for final concentration of heavy minerals and FrantzTM
For zircon separation, rock fraction of 125-250µm
is passed through turbulent water flux for pre-concen-tration of heavy minerals. Another way for heavy min-eral pre-concentration for zircon separation is using Densitest® device. For the grain size of 90-125µm,
the conditions are inclination 9◦, pulsating voltage
12V, air flux voltage 7.5V. For a grain size between 125 and 250µm, the conditions are: inclination 9◦,
pulsat-ing voltage 13V, air flux voltage 9.0V. After that, heavy minerals are separated with bromoform and washed in ethanol. After separation of highly magnetic minerals by hand magnet, the non-magnetic fraction is separated by the Frantz magnetic separator with a frontal incli-nation of 20-25◦ and successive lateral inclinations of
15◦ (0.5 A), 15◦ (1.0 A), 15◦ (1.2 A), 10◦ (1.2 A),
5◦ (1.2 A) and 1-5◦ (1.2 A). Finally, individual zircon
grains are handpicked with needle under the binocular microscope. Selected grains are loaded in small drop of immersion oil (ND= 1.515) on glass plate for digital
photo imaging using a Leica DMLP microscope equip-ped with DC 300F camera.
Some zircon (and other mineral) fraction or indi-vidual grains can be polished in an air abrasion mill with pyrite powder following the technique of Krogh (1982). A pressure of 1.8 psi for zircon abrasion and of 1.2 psi for titanite and rutile abrasion is normally used. The time of abrasion varies between 20-60 min, depending on min-eral size and resistance. Abraded grains are leached in warm 2-3 N HNO3until complete dissolution of pyrite. Another micro air abrasion mill with a chamber of 10 mm diameter and 5 mm high (design of A.N. Ko-marov, IPGG RAS, Russia) is used for a rapid abrasion of single crystals of zircon without using pyrite powder (pressure: 0.1-0.2 psi, duration: 30-80 sec).
CLEAN LAB FACILITIES
The clean chemistry laboratory consists of four separate rooms for (1) U-Pb chemistry, (2) acid distillation and water purification, (3) Rb-Sr, common Pb and Sm-Nd chemical procedures and (4) balances. All these rooms have temperature and humidity control, positive air pres-sure and high efficiency particulate air (HEPA) filters. These clean rooms are equipped with custom-made or-ganic glass hoods, clean boxes with their own HEPA filters and air source and, laminar flow hoods (VECO®
HLFS-09M) with class 100 HEPA filters. Laboratory air is not recirculated, and minimum metal is exposed.
The weighting room is equipped with Sartorius® CS-2 and R180D balances. The CS-2 balance has quoted precision of±0.1µg, linearity of±0.9µg with a
max-imum limit of 2.1 g. This balance is used to weight small quantity of mineral (<2 mg) and tracer (1-10 mg).
To weight smaller fractions (1-500µg) and single grains,
a small hand-made aluminum boat (1-1.5 mg) is used; for bigger mass of sample (0.5-2 mg), microcapsules of Teflon (model of Ludwig) are directly used. The R180D balance, with precision of±0.02 mg and mass limit of 33 g is used for 30-100 mg of mineral or whole rock samples.
For dissolution of zircon and some other miner-als by method of Parrish (1987), we use Parr Instru-ment Company steel bomb (Model 4748) with 120 mL PTFE Teflon liner, equipped with two floor PTFE Teflon holder for 12 PFA Teflon microcapsules of Ludwig model (#7226, Savillex®). For other chemical operation (lower
temperature dissolution, collection of U, Pb during ion exchange separation etc.), 3 mL and 6 mL Savillex® screw cup vessels are used. Centrifugation is performed in polypropylene 1.5 and 2 mL Eppendorf® centrifuge tubes and 0.2 mL PCR® tubes. Acid are stored in FEP Nalgene® bottles and drop dispensers.
REAGENT PURIFICATION
Water purification is carried out in three main steps: 1) pre-cleaning with cellulose filters; 2) Millipore® RiOs–5 system (pre-cleaning, reverse osmosis), and 3) Millipore® Milli-Q Academic final treatment (organic absorption, mixed-bed deionization, and 0.22 micron membrane filtration). The lead and uranium concen-trations in water from our system are 1-3 pg/mL and
<0.1 pg/mL, respectively.
The different inorganic acids of Merk® (“for ana-lysis” quality) are multi-step distilled. We have three quartz sub-boilers and four Savillex® PFA Teflon bottle-to-bottle sub-boilers with heating blankets. Each acid is distilled in different ways: HCl is passed twice trough quartz sub-boiler and once trough the SavillexTM
us-ing principles of distillation by Mattinson (1972). The lead and uranium concentrations in purified concentrated acids are, respectively: HCl: 5 pg/mL and<0.1 pg/mL;
HNO3: 7 pg/mL and <0.1 pg/mL; HF: 5 pg/mL and
0.2 pg/mL, and HBr: 13 pg/mL and<0.1 pg/mL.
Sil-ica gel and H3PO4 mixture was obtained from Max-Planck-Institute Mainz for Chemistry and used for mass-spectrometric analysis of Pb and U (3-5µL for each
sam-ple; blank of 2 pg of Pb and 0.01 pg of U). This mixture was added in SavillexTMcollection beakers before
evap-oration of samples on hot plate.
U-Pb SPIKES AND STANDARDS
In modern U-Pb geochronological laboratories, differ-ent types of spike are widely used: 235U-208Pb, 235 U-205Pb, 233U-235U-202Pb-205Pb and 233U-235U-230 Th-205Pb. The spike with artificial205Pb isotope was firstly used by Krogh and Davis (1975b). The use of 235 U-205Pb spike, instead of235U-208Pb, allows reducing by half the quantity of columns for chemical separation and in three times the quantity of filament locations in mass-spectrometer, which gives a great advantage in economy of time and materials. Other advantages of205Pb are a reduction of pollution introduced by aliquoting of sample and an increasing precision of lead isotope analysis.
For determination of U and Pb concentrations by isotope dilution analysis, the Pará-Iso laboratory has two 235U-208Pb mixed spike solutions named “IPGG” and “A”, respectively from the Institute of Precambrian Ge-ology and GeochronGe-ology (St. Petersburg, Russia) and prepared in our laboratory and two 235Pb-205Pb spike solutions (“B” from the University of Brasília and “PARA”, prepared in our laboratory).
The 235U-208Pb spike is used for U -Pb analysis of whole rock and sulfide samples and any quantity of mineral fractions higher than 2 mg. The characteris-tics of spike “A” are: [235U] = 9.19 nmol/g, [208Pb] = 3.96 nmol/g, 235U/238U = 7766 and 206Pb/208Pb = 0.000096. The235U-205Pb spike is useful for small frac-tions (0.001–2 mg) of zircon and other U-rich miner-als. The characteristics of spike “PARA” are: [205Pb] = 0.0863 nmol/g, [235U] = 7.87 nmol/g, 206Pb/205Pb = 0.000704, 238U/235U = 0.0000123 and235U/205Pb = 91.19. Spikes “A” and “PARA” were calibrated using 5 ppm solution of NBS983 and 10 ppm solution of
nat-ural U, which were previously calibrated with “IPGG” and “B” spikes. Finally, calibration of spikes were veri-fied and adjusted by analyses of the 91500 international standard zircon.
For determination of mass fractionation of Pb and U in the mass spectrometer, 90 ng of NBS982 and 178 ng of NBS500 standards are used. For calibration of the ion counter efficiency in relation to that of Faraday cup, 220 ng of NBS983 is used in every magazine.
The isotope ratios for standards during 2000-2003 period were:
NBS-982 (25 analyses):
204Pb/206Pb = 0.027216 (±0.015%), 207Pb/206Pb = 0.467013 (±0.006%) and 208Pb/206Pb = 0.999829 (±0.005%); NBS-983 (46 analyses):
204Pb/206Pb = 0.000368 (±0.170%), 207Pb/206Pb = 0.071213 (±0.007%) and 208Pb/206Pb = 0.013623 (±0.042%); NBS-U500 (14 analyses):
238U/235U = 1.00037 (±0.015%)
(errors at 2σ level; data corrected from
mass-fractiona-tion). All measured values for NBS-982, NBS-983 and NBS-U500 standards agree with standard values. Thal-lium interference was controlled on203Tl peak by peri-odic scanning of mass spectrum in 200-210 mass range. At work temperature of 1430oC, all Tl from sample was
usually gone.
DISSOLUTION AND CHEMICAL SEPARATION OF Pb AND U
ZIRCONANALYSIS
Selected grains, previously photographed and abraded (Krogh 1982), are transferred to small PTFE Teflon be-akers. In some special cases, zircon grains can be step-wise leached (Krogh and Davis 1975a, Mattinson 1994, 1997, Corfu 2000, Davis and Krogh 2000). The Matti-son (1994) technique is preferred for complex and meta-mictic grains. In usual analysis, samples are consec-utively washed in bi-distilled methanol with ultrasonic bath (20 min), hot (90◦C) 7N HNO3(30 min) and rinsed
tracer, 1-5µl of “PARA” spike are added into each
mi-crocapsule and weight on the same balance. When the 235U-208Pb tracer is used, we add it after zircon dissolu-tion and aliquoting.
In each microcapsule, 10µl or 30-50µl of
hydro-fluoric acid are introduced, respectively for single grain and for multi grain fraction. A Set of 12 microcapsules is arranged into a 120 ml PTFE Teflon bomb enclosed in a stainless steel jacket Model 4748 Parr Instrument, following the method outlined by Parrish (1987). Five ml of HF are added to the large PTFE bomb and the whole assembly is closed and heated 24 h in an oven at 240-245◦C. The complete dissolution of the zircon grains
is checked under a stereomicroscope and the sample so-lutions evaporated to dryness. Then, the fluoride salts are digested overnight at 200◦C with 30-60µL of 3N HCl
in the capsules and 5 ml in the large bomb.
There are 5 main ways to separate U and Pb from zircon solution:
1) direct analysis without separation of Pb and U (Lancelot et al. 1976, Van Schmus and Chemale Jr. 1996);
2) classical method of Pb-U separation on columns with anionic resin AG 1x8 in HCl and H2O (Krogh 1973, Roddick et al. 1987, Parrish et al. 1987);
3) the Pb-U separation on columns with mixture of specific resins TRU Spec and Sr Spec of EichromTM
in HCl (Paquette and Pin 2001);
4) single bead separation of Pb by resin AG 1x8 in 0.6 M HBr (Manton 1988), and
5) separation on columns with AG 1x8 in HBr, HCl for Pb and HNO3and H2O for U (Tera and Wasserburg 1975).
The Pará-Iso laboratory uses either the Parrish et al. (1987) or the Paquette and Pin (2001) methods, both with modifications.
Description of modified method of Parrish et al. (1987)
For this procedure hand-made shrinkable Teflon micro-columns with internal diameter of 1.8 mm and height of 11 mm with reservoir for 1.5 ml (diameter is 6 mm) are used. The columns are washed with hot HNO3and
hot water for 3 days and they are filled with 40 µl of
Dowex® 1x8 200-400 mesh resin, previously washed. When new, the resin is washed 20-40 times with 6N HCl and H2O, alternately. Between analyses, the columns are washed 8-10 times with 6N HCl and H2O. The resin usually is not disposable because of long period of pre-washing and it can be used up to 20 times, if the lead blank does not increase. For counting the acid volume, 30 ml NalgeneTMdrop-dispensers are used, which drop
is about 30µl. The sequence of elements separation with
consists of:
Resin media equilibration: 2x3 drops of 3N HCl; Loading in column: 3N HCl sample solution; Sample washing: 1+2+2 drops of 3N HCl;
Pb elution: 10 drops of 6N HCl (collection in 3 ml PFA Teflon beaker);
U elution: 10 drops of H2O (collection in the same beaker as Pb);
Addition of 5µl of silica gel–H3PO4mixture and
evap-oration;
Sample loading on Re filament.
Total blanks for this zircon procedure are 20-30 pg of Pb and 0.1-0.5 pg of U.
Description of Paquette and Pin (2001) modified method
For this technique, PFA Teflon micro-columns (Savillex model #7272) are used, with 8 mm capillary (internal diameter = 1.5 mm) and 2 ml reservoir. The columns are washed in the same way as for the procedure described above. The resin mixture consists of 0.5 g of Eichrom Sr Specific resin (50-100µ)and 1.5 g of Eichrom TRU
Spe-cific resin (50-100µ). After being pre-washed in 10 ml
plastic column with 300 ml three-distilled 6N HCl, about 22-25µL of this mixture are introduced into each
micro-column in 6N HCl media. The resin mixture serves only for one separation procedure. The sequence of elements separation is the following:
Resin washing: 2 ml of 6N HCl;
Resin media equilibration: 2x2 drops of 2.5N HCl; Loading in column: 2.5N HCl sample solution; Sample washing: 1+1+2+2+2 drops of 2.5N HCl; Pb elution: 4 drops of 6N HCl (collection in micro-capsule);
(collection in the same microcapsule) and evaporation; Sample loading on Re filament with 3µl of silica gel–
H3PO4mixture.
Total blanks for this zircon procedure are 4 pg of Pb and 0.05 pg of U. This procedure also can be applied for analysis of other accessory minerals (titanite, rutile, apatite), but separation of Ca and Fe from the sample is not ideal.
After analysis, the PFA Teflon beakers are washed on hot plate at 90◦C in HF, H2O, HNO3, H2O, HCl
and H2O during 1 day for each step. Microcapsules are washed in similar manner, but with three-distilled HF and HCl in Parr bomb at 230◦C additional washing, during
one night with each acid.
OTHERACCESSORYMINERALSANALYSIS
Depending on the characteristics of accessory mineral, we different procedures of washing are applied. Apatite is washed with methanol, 5% Na-EDTA solution and water. Rutile, titanite, garnet, other oxides and silicates are washed with methanol, 0.5-2N HCl and water. The mineral fractions may be previously polished by air abra-sion mill without pyrite powder.
The U-Pb analysis of mineral small quantities (<1 mg) is carried out with235U-205Pb tracer. For
big-ger samples the 235U-208Pb tracer is utilized. For di-gestion of 10-50 mg of apatite we use 14N HNO3 in 3 ml PFA Teflon closed beakers. Parrish-type PFA Teflon microcapsules (#7235 SavillexTM) on hot plate at 100◦C
during 6-8 h are used for digestion of 0.2-1 mg sam-ples. For dissolution of oxides and silicates it is used Ludwig-type or Parrish-type PFA Teflon microcapsules or 3 ml PFA Teflon screw-cup vials (depending on sam-ple weight) inside Parr bomb. HF or a HF+HNO3 mix-ture (from 60µl up to 500µl) is used in the
microcap-sules or vials. Then, the Parr bomb liner is filled with 5 ml HF and introduced in an oven for 15-20 h at 245◦C.
Samples are evaporated, and re-equilibrated with 3N HCl during 10h at 200◦C in Parr bomb. In case of using235
U-208Pb spike, aliquoting is made and spike is added after dissolution. Some minerals, such as carbonates, phos-phates and Fe oxides are dissolved in HCl or HCl-HNO3 mixture in the 3 ml PFA Teflon screw-cup vials at 100◦C
on hot plate.
Depending on U and Pb concentrations and weight
of samples, micro-columns (the same as for zircon sep-aration) or small columns (120µl of AG 1x8 resin) are
used. The micro-column is used for 0.001-1 mg samples, whereas the small column is used for 1-50 mg samples. Small amounts of titanite, apatite and monazite are pro-cessed in micro-columns using the same technique used for zircon (with HCl and H2O). The oxides and silicate mineral solutions are separated with HBr using a mod-ified technique of Tera and Wasserburg (1975). In the case of HBr medium, the chloride solution is evaporated, 10µl of concentrated HBr are added and evaporated to
dry; then 3-5 drops of 0.6N HBr are added. The HBr solution, after being heated on hot plate at 100◦C, stay
for about 20 min in ultrasonic bath and is centrifuged in 0.2 ml PCR® tube. The Pb separation sequence is the following:
Resin media equilibration: 2x3 drops of 0.6 N HBr; Loading: 0.6 N HBr sample solution / collecting solution for U separation;
Sample washing: 2+2+2+10 drops of 0.6N HBr / col-lecting solution for U separation;
Pb elution: 10 drops of 6N HCl (collection in a PFA Teflon 3 ml beaker);
Addition of 5µl of silica gel–H3PO4mixture and
evap-oration.
Uranium can be separated by the same method as mentioned for zircon separation with HCl and H2O or by the following HNO3technique:
Evaporation of solution and conversion of the salts to ni-trate by 2 drops 14N HNO3, evaporation;
Addition of 5 drops of 7N HNO3, transfer to microcap-sule, heating for 30 min at 100◦C and centrifugation in
PCR® tube;
Column washing 3 times with H2O and 6N HCl; Resin media equilibration: 3x5 drops of 7N HNO3; Loading: 7N HNO3sample solution;
Sample washing: 2+2+2+4 drops of 7N HNO3; U elution: 15 drops of 0.25N HNO3(collection in a 3 ml PFA Teflon beaker);
Addition of 3µl of silica gel–H3PO4mixture in a beaker with U and evaporation.
When using the same analytical procedures for accessory mineral as for zircon analysis, the total blanks are<30
pg for Pb and<0.5 pg for U. The next step for Pará-Iso
laboratory will be the implantation of Paquette and Pin (2001) U-Pb separation technique for accessory minerals dating, which will permit to obtain Pb blank level smaller than 10 pg, using current acid quality.
WHOLEROCKANALYSIS
Fifty mg powdered whole rock samples can be dissolved by different ways, depending on their mineralogical com-position: in Teflon steel jacket bombs at 150◦C in an
oven; in 6 ml PFA Teflon (Savillex®)screw-cup vials
at 150◦C in an oven or on hot plate, or in special PTFE
Teflon bombs in microwave oven. Ordinary digestion in oven normally takes 3-7 days and, in some cases, even more. For dissolution in Savillex® vial it is used 3 ml of HF+HNO3(5:1) mixture.
In case of microwave digestion, a BOLA-digestion vessel with PTFE Teflon liner (A250-04 model; Bohlen-der GmbH, Germany) is used with 4 ml HF+HNO3(3:1) mixture. The microwave digestion conditions are: 36 min at 400 W; 3 min cooling, 15 min at 400 W; 3 min cooling. After digestion first steps, the sample is evapo-rated, and the procedure is repeated. Then the solution is evaporated, 3 ml 6N HCl are added and the sample is processed in the microwave oven at the same conditions as for the HF+HNO3mixture.
After dissolution and cooling, the solution is weighed and splitted in two aliquots: 2/3 volume for isotope composition and 1/3 volume for U-Pb concen-tration. The concentration aliquot is spiked with235 U-208Pb tracer “A”. Both aliquots are evaporated, 0.6 ml of concentrated HBr are added and evaporated again. Then, 1.2 ml of 0.6N HBr is added to sample beakers, passed in ultrasonic bath, heated in closed beakers at 100◦C for 2 hours, and centrifuged.
The separation of Pb and U are carried out on small columns (internal diameter = 3 mm, height = 20 mm and reservoir = 1.5 ml) filled with 120 µl of AG 1x8
resin (200-400 mesh). The Pb separation sequence is the following:
Resin media equilibration: 2x3 drops of 0.6 N HBr; Loading: 0.6 N HBr sample solution / collecting solution for U separation;
Sample washing: 1+0.5 mL drops of 0.6N HBr / collect-ing solution for U separation;
Pb elution: 1.5 mL of 6N HCl (collection in a PFA Teflon 3 mL beaker);
Addition of 5µL of silica gel–H3PO4mixture in a beaker
with Pb and evaporation.
The U separation procedure using the same columns is following:
Evaporation of solution for U separation, conversion of the salts to nitrate by 10 drops 14N HNO3 and evapo-ration;
Addition of 40 drops 7N HNO3, transfer to beaker, heat-ing for 30 min at 100◦C and centrifugation in 2 ml tube;
Washing column: 3 times with H2O and 6N HCl; Resin media equilibration: 3x10 drops of 7N HNO3; Loading: 7N HNO3sample solution;
Sample washing: 1+5+5+5 drops of 7N HNO3; U elution: 90 drops of 0.25N HNO3(collection in PFA Teflon 6 ml beaker);
Addition 3µl of silica gel–H3PO4 mixture and
evapo-ration.
The blanks for total whole rock procedure are 0.5 ng of Pb and 10 pg of U.
MASS SPECTROMETRY
Isotopic compositions of Pb and U are measured on a Finnigan MAT 262 variable multicollector mass spec-trometer equipped with 7 Faraday cups and 1 ion counter. The numbers of Faraday cups are 2, 3, 4, 5, 6, 7 and 8, the ion counter position corresponding to the cup 5.
The lead-uranium fraction mixed with the silica gel– phosphoric acid solution is loaded under HEPA laminar flow on a single outgassed rhenium filament. The trans-fer of the sample to the filament is done using 1µl pure
water. For procedure with Eichrom resins, the sample is loaded to filament by 3µl of silica gel – phosphoric acid
mixture. The filament is heated slowly from 0.8 to 2.2 A, until glow rose color.
sig-nal of 204 mass is received on the ion counter. In case of using235U-205Pb tracer, the configuration of this 7-collector mass-spectrometer does not permit the analy-sis of all necessary lead mass in a static mode, because only three cups adjacent to ion counter (IC) are available in one side. Therefore, the following dynamic mode is applied: first run – 204 (IC), 205 (cup 4), 206 (cup 3) and 207 (cup 2) (measured ratios are 206/204, 206/205 and 206/207); second run – 206 (cup 4), 207 (cup 3) and 208 (cup 2) (measured ratio is 206/208). In case of low signal of lead (I206<10 mV) all masses are
ana-lyzed on ion counter in peak jumping mode. The ion counter gain is calibrated in each magazine with NBS-983 standard by “IC-deflection” operation and adjusted for 206/204 ratio by comparison with the same ratio, ob-tained on Faraday cups. The filament with sample is heated during 10 min and analyzed at temperature in-terval of 1400-1500◦C with maximal signal at 1470◦C.
The total time required for acquisition of 5 blocks of data is about 30 min. The mass fractionation correction for lead is 0.12% a.m.u.−1, calculated from 25 analyses of
NBS 982 standard.
The U is analyzed as UO2 just after lead meas-urement from the same filament, by measmeas-urement of masses: 267 (235U16O
2)and 270 (238U16O2). Depend-ing on signal level, UO2is analyzed in static mode on Faraday cups (#6 for 267 and #5 for 270) or peak jump-ing mode on ion counter. The initial temperature for UO2 measurement is 1500-1530◦C and maximal temperature
is 1570◦C. The time for collection of 3 blocks is 15 min.
The mass fractionation correction for UO2 was not ap-plied because of its insignificant small value (∼ 0.002-0.03% a.m.u.−1)obtained from NBS-500 analyses.
DATA REDUCTION
The first step of statistical data reduction is carried out using the custom made laboratory software named “Fin-res2” and developed by Thomas Scheller. This program calculates the measured isotope ratios and their 2 sigma errors. After that, the data set is processed by PbDat program (version 1.24; Ludwig 1993), which give Pb/U and Pb/Pb isotope ratios corrected for blanks, spike con-tribution and common lead. Finally, the data are pro-cessed with Isoplot for Excel program (version 2.49e; Ludwig 2001) and plotted in the concordia diagram.
Er-rors on final results are quoted at a 2σ level.
The measured lead isotope composition of total blank in the Pará-Iso laboratory is generally close to com-mon lead isotope composition by Stacey and Kramers (1975) model for t = 0 Ma. Therefore, for most zircon samples, the correction of measured lead on contami-nation by common lead by Stacey and Kramers (1975) model gives satisfactory results. For zircon and acces-sory minerals with measured206Pb/204Pb ratio<1000 it is necessary to do distinct correction on blank and sam-ple common lead, which can be estimated from Stacey and Kramers (1975) model for adequate age or from the K-feldspar lead isotope composition.
The current precision of determination of U and Pb concentration is 1% (2gσ ), precision of Pb/U isotope
ratios is 0.5-0.1 % (2σ ). The best precision of U-Pb
age determination achieved in the laboratory is 1 Ma for 91500 standard zircons and for some other zircons, which have not been included in the paper as, for example, for zircons from Mid Atlantic ridge.
STANDARD ZIRCON 91500 DATA
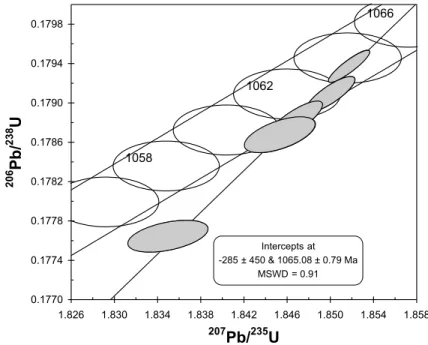
For testing the U-Pb procedures installed in our lab, we used the international standard 91500 Canadian zircon. The international standard 91500 is a concordant zircon with an age of 1065.4±0.3 Ma and concentrations of U and Pb of 71-86 ppm (mean value: 81.2 ppm) and 13-16 ppm (mean value: 14.8 ppm), respectively (Wiedenbeck et al. 1995). Three sets of analyses of this standard were carried out using three different U-Pb spikes. The results are displayed in Table I.
The first test was performed using the235U-208Pb “IPGG” spike. The chemical procedures include spiking after digestion and aliquoting. U-Pb results from five fragments yielded an upper intercept age of 1065.1± 0.8 Ma (Fig. 1), which is good agreement with previ-ously published values for this standard. Some variations on the Pb/U ratios are observed, which are probably due to the high content of common lead or to the fact that the zircon fragments were not polished in the air-abrasion device.
TABLE I
Results from U-Pb analyses of 91500 standard zircons.
N Weight, U, Pb, 206Pb/204Pb 207Pb*/206Pb* 207Pb*/235U 206Pb*/238U Rho Age, Ma Age, Ma Age, Ma
mg ppm ppm 206/238 207/235 207/206
Using235U-208Pb “IPGG” spike
215 0.821 74.1 13.7 2751±5 0.07492±11 1.8350±30 0.17765±13 0.46 1054.1 1058.1 1066.3 216 0.744 71.0 13.2 3851±10 0.07487±3 1.8517±15 0.17937±13 0.90 1063.6 1064.1 1065.1 217 0.533 79.1 14.5 9085±16 0.07492±4 1.8500±18 0.17909±15 0.82 1062.0 1063.4 1066.4 218 0.641 77.7 14.3 4539±6 0.07490±5 1.8466±22 0.17881±17 0.82 1060.5 1062.2 1065.9 219 0.937 77.0 14.2 5347±27 0.07491±9 1.8454±27 0.17868±15 0.58 1059.7 1061.8 1066.0
Using235U-205Pb “B” spike
324 0.234 70.6 13.0 4170±11 0.07486±2 1.8538±8 0.17961±6 0.82 1064.8 1064.8 1064.7 325 0.460 80.1 14.7 8735±33 0.07487±1 1.8538±7 0.17957±6 0.91 1064.6 1064.8 1065.1 326 0.453 92.1 16.9 9982±25 0.07488±2 1.8559±15 0.17975±14 0.96 1065.6 1065.5 1065.4 327 0.410 78.3 14.3 9386±23 0.07487±1 1.8536±12 0.17955±12 0.97 1064.5 1064.7 1065.1
Using235U-205Pb “PARA” spike
569 1.102 70.2 12.8 10583±109 0.07489±2 1.8568±16 0.17983±15 0.94 1066.0 1065.9 1065.5 571 1.077 74.0 13.6 11818±17 0.07492±2 1.8582±18 0.17988±17 0.94 1066.3 1066.3 1066.4 572 0.937 82.0 15.1 11768±14 0.07495±2 1.8606±15 0.18005±14 0.95 1067.3 1067.2 1067.1 573 1.010 80.0 14.7 19828±20 0.07495±2 1.8608±21 0.18005±20 0.98 1067.3 1067.3 1067.2
*Radiogenic isotopes. / Pb corrected for common lead using Stacey and Kramers (1975) model for t = 0 Ma.
Fig. 1 – The U-Pb concordia diagram for 91500 standard using235U-208Pb “IPGG” spike.
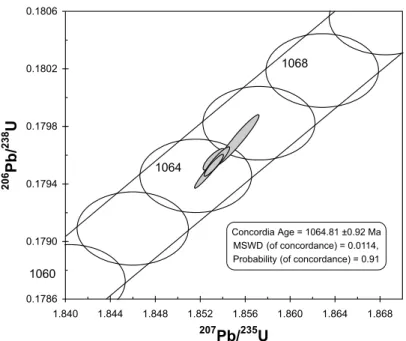
first test. All the analytical points are concordant and an U-Pb Concordia age of 1064.8±0.9 Ma (Fig. 2) was obtained from four zircon fragments, which is undistin-guishable from the accepted value for this standard.
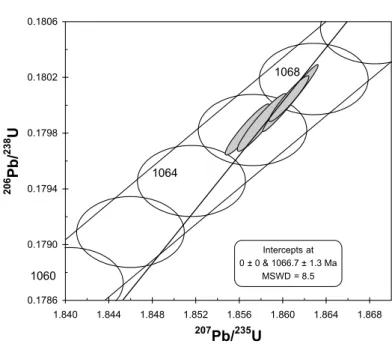
The third test was made with235U-205Pb “PARA”
Fig. 2 – The U-Pb concordia diagram for 91500 standard using235U-205Pb “B” spike.
(2001). The larger scattering of data ellipses relatively to those on figure 2 is possibly caused by not ideal cali-bration of ion counter gain, or by too strong washing of zircon fragments with HNO3.
The ages calculated from all three sets of 91500 standard are excellent agreement within error limit with the standard value previously published (Wiedenbeck et al. 1995). However, as it was shown on these three figures, the best results in respect to reproducibility of Pb/U isotopic ratios and concordance are provide by 235U-205Pb spike in comparison with235U-208Pb spike. Also, it is necessary to underline the variations in con-centrations of U (70-92 ppm) and Pb (13-17 ppm), which slightly exceed the interval yielded by Wiedenbeck et al. (1995).
ANALYSES OF STANDARDS OF GRANITE GH AND BASALT BHVO-1
In order to test the238U-208Pb “A” tracer for determina-tion of the concentradetermina-tion of U and Pb contents in whole rock samples we analyzed the international USGS stan-dards of granite (GH) and basalt (BHVO-1). The first standard has high U and Pb concentrations, while the sec-ond has low concentrations of these elements. The val-ues of concentration for these standards were determined
by analytical procedures described above for whole rock samples, and compared with values published by Govin-daraju (1989) (see Table II). The mass of standards used for analyses was about 17-18 mg. The obtained values are similar to those of Govindaraju (1989), which permit to conclude that the installed procedures are sufficient for a precise determination of U and Pb contents in whole rock samples.
TABLE II
Concentrations of U and Pb in standards GH
and BHVO-1.
Results Values by Values by
Govindaraju 1989 Pará-Iso
Standard BHVO-1 GH BHVO-1 GH
U, ppm 0.4 18 0.405 17.7
Pb, ppm 2.6 45 2.49 45.8
EXAMPLES OF ANALYSES OF ZIRCONS
meta-Fig. 3 – The U-Pb concordia diagram for 91500 standard using235U-205Pb “PARA” spike.
volcano-sedimentary sequences of the northern Carajás Province, eastern Amazonian craton, Brazil. The re-gional geological setting of the Carajás Province and the main geological features of the Carajás Formation have been exhaustively described (Machado et al. 1991, Macambira and Lafon 1995, Nogueira et al. 1995, Pin-heiro and Holdsworth 1997, Trendall et al. 1998, Tassi-nari et al. 2000). The second sample came from a granitic body of the Proterozoic Khanka Lake supert-errain (Far East, Russia). This specimen was collected during regional geological survey of 1999-2000 field sea-sons. Regional geological background can be found elsewhere (Khanchuk et al. 1995, Rub and Rub 1988, Ryazantseva 1976). The age of this intrusion was sug-gested to be approximately 480 Ma. based on K-Ar mea-surements (M.D. Ryazantseva, pers. communication).
The considered examples show the capability of the Pará-Iso Laboratory to analyze multi and single grain zircon samples of different ages with appropriate precision.
THEARCHEANMETAVOLCANICROCK OF
GRÃOPARÁGROUP, CARAJÁSPROVINCE, BRAZIL
One sill of volcanic rock, concordant with layers of the Band Iron Formation in the base of Carajás Formation (Grão Pará Group) was collected from the N4E mine.
This rock is strongly weathered, but has numerous eu-hedral crystals of quartz and feldspar in the hematite – kaolin matrix. According to the classification scheme of Pupin (1980, J.P. Pupin, unpublished data), this rock was probably a trachyte. Zircons of sample #10979 are prismatic (elongation 2.4) with rectangular or square sec-tion, bi-pyramidal, transparent, rose color, without zon-ing and containzon-ing dark spherical inclusions.
The analyses U-Pb of multigrain fractions (10-20 crystals in each fraction) were carried out with 235 U-208Pb “IPGG” tracer. A first test showed very low206Pb/ 204Pb ratio (60-300), therefore the following analyses were made with previous leaching using a mixture of acids 10N HF + 14N HNO3(30 min., 100◦C) and by 6N HCl (30 min, 100◦C). After leaching, the zircon
TABLE III
Results from U-Pb analyses of zircon 10979 of volcanic rock, Grão Pará Group, Carajás Province.
N Weight, U, 206Pb, 206Pb/204Pb 207Pb*/206Pb* 207Pb*/235U 206Pb*/238U Rho Age, Ma Age, Ma Age, Ma
mg ppm nmol/g 206/238 207/235 207/206
95 1.09 104 180 4940±5.2 0.18848±5 10.724±11 0.4126±4 0.97 2227 2499 2729 137 0.01** 227 491 598.6±0.7 0.19070±13 13.198±20 0.5019±7 0.90 2622 2694 2748 138 0.01** 283 555 1089±1.2 0.18972±10 12.102±29 0.4626±11 0.97 2451 2612 2740 140 0.01** 362 784 1037±1.4 0.19039±13 13.385±20 0.5098±7 0.89 2656 2707 2746 141 0.01** 162 378 511.0±0.6 0.19113±45 14.230±43 0.5399±10 0.62 2783 2765 2752 142 0.01** 272 571 861.0±1.1 0.19094±67 12.967±54 0.4925±11 0.55 2582 2677 2750 143 0.01** 211 459 879.7±1.2 0.19055±46 13.407±55 0.5103±17 0.81 2658 2709 2747
*Radiogenic isotopes. / **Small fraction of zircon crystals. Excepting point 95, which correspond to a large multi-grain fraction, the average weights were estimated by volume on the base of microphotography of the grain. / Pb corrected for common lead using Stacey and Kramers (1975) model for t = 0 Ma.
Fig. 4 – The U-Pb concordia diagram for zircon 109797 (metavolcanic rock, Grão Pará group) using235U-208Pb “IPGG” spike.
11 Ma achieved by ion microprobe SHRIMP-II (Tren-dall et al. 1998) for the same sample.
THEPALEOZOICGRANITE OFNEVSKYMASSIF, KHANKAREGION, RUSSIA
Sample #3054 was collected from a biotite granite of Nevsky massif, Khanka Lake region, Far East, Russia. Zircons are clear, rose-brown with well developed pris-matic and pyramid faces. Some crystals show zoning and cracks; gas-liquid inclusions are rare. The crystal
3054-10 has short prismatic shape; others have long pris-matic form. The single zircon grains, weighting from 2.5 to 9.4µg, were analyzed using 235U-205Pb tracer.
These zircons are characterized by high uranium (3200-5600 ppm) and lead (260-410 ppm) concentrations (Table IV). The 206Pb/204Pb ratio varies from 685 to 1654. The four analytical points lie on a discordia line with an upper intercept at 482.5±1.8 Ma (Fig. 5), and
TABLE IV
Results from U-Pb analyses of zircon 3054 of Nevsky granite massif, Khanka region, Far East, Russia.
N Weight, U, Pb, 206Pb/204Pb 207Pb*/206Pb* 207Pb*/235U 206Pb*/238U Rho Age, Ma Age, Ma Age, Ma
µg ppm ppm 206/238 207/235 207/206
3054-2 2.5 3243 256 685±2 0.05679±12 0.5957±14 0.07608±6 0.44 473 475 483 3054-8 9.4 3679 280 1655±4 0.05672±8 0.6042±10 0.077258±6 0.48 480 480 481 3054-9 4.2 5678 413 1334±6 0.05680±6 0.5836±8 0.074521±6 0.62 463 467 484 3054-10 8.4 3851 300 1451±5 0.05679±6 0.6093±11 0.077809±11 0.79 483 483 483
*Radiogenic isotopes./ Pb corrected on common lead using Stacey and Kramers (1975) model for t = 0 Ma.
Fig. 5 – The U-Pb concordia diagram for zircon 3054 (Nevsky granite massif) using235U-205Pb “B” spike.
varied between 481-484 Ma. The age of 482 Ma was interpreted as crystallization age of Nevsky granite mas-sif. Such ages were obtained for different granite bodies in this region mainly by the Rb-Sr method on whole-rock samples and interpreted as a time of main Paleozoic magmatic activity in the Khanka terrain (Gerasimov et al. 1990, Govorov et al. 1994, Ryazantseva et al. 1995, Khetchikov et al. 1994).
CONCLUSIONS
During the time period between 2000 and 2003, the U-Pb experimental procedures, including mineral separation, chemical digestion, chromatography extraction and mass spectrometry measurements, were installed at the
tools in a wide variety of Earth science projects. An im-provement of this analytical technique in the laboratory is currently under progress with testing procedure for U and Pb separation with TRU-Sr specific Eichrom resins for accessory mineral dating. The reduction of blank level is also a challenge for the laboratory.
ACKNOWLEDGMENTS
This work was supported by grant of Conselho Nacional de Desenvolvimento Científico e Tecnológico – CNPq (n◦ 300795/01-7). Thanks are due to anonymous
re-viewers for their constructive comments which signifi-cantly improved the paper. This is a contribution to Pro-grama de Apoio a Núcleos de Excelência (PRONEX) 103-98 project “Magmatismo, metalogênese e evolução crustal da Província Mineral de Carajás e províncias adjacentes”.
RESUMO
Os procedimentos analíticos para análises U-Pb por diluição isotópica no Laboratório de Geologia Isotópica (Pará-Iso) da Universidade Federal do Pará (UFPA) são descritos detalhada-mente. Esses procedimentos são aplicados para análises de zircão, titanita, rutilo, apatita, columbita-tantalita e rocha total. A purificação dos reagentes e os procedimentos químicos são feitos em salas limpas. As amostras são dissolvidas em mi-crocápsulas de Teflon em bombas do tipo Parr Instrument™. U e Pb são separados em colunas com resina de troca iônica AG 1x8. Os brancos de procedimento para amostra típica (0,01-1 mg) são menores que 1 pg de U e 20-30 pg de Pb. As análises isotópicas de Pb e de U são feitas em um único filamento de Re em um espectrômetro de massa Finnigan MAT 262 nos modos estático e dinâmico. O nível analítico atual é comprovado pelas análises do padrão internacional de zircão 91500, usando três diferentes traçadores de U-Pb e nas análises de padrões de rocha total. Resultados geocronológicos obtidos em cristais de zircão de duas amostras de rochas arqueana e paleozóica são também apresentados e comentados.
Palavras-chave: geocronologia U-Pb, zircão, minerais aces-sórios, diluição isotópica.
REFERENCES
CHENJHANDWASSERBURGGH. 1981. Isotopic determina-tions of uranium in picomole and sub-picomole quantities. Anal Chem 53: 2060–2067.
CORFUF. 2000. Extraction of Pb with artificially too-old ages during stepwise dissolution experiments on Archean zircon. Lithos 53: 279–291.
DAVISDWANDKROGHTE. 2000. Preferential dissolution
of 234 U and radiogenic Pb from alpha-recoil damaged sites in zircon: implications for thermal histories and Pb isotopic fractionation. Chem Geol 172: 41–58.
GERASIMOVNS, RODIONOVSMANDKOMPANICHENKO
VN. 1990. Rb-Sr age dating of tin-bearing granites from the Central Sikhote-Alin. Reports of USSR Academy of Sciences 312: 1183–1185.
GOVINDARAJUK. 1989. Compilation of working values and
sample description for 272 geostandards. Geost Newsl 16: 111–300.
GOVOROV IN, GERASIMOVNSANDRYAZANTSEVAMD.
1994. Rb-Sr isochrons and petrogenetic patterns of mag-matic rocks from the Voznesenka ore district, Primorye. Geol Pacific Ocean 4: 60–73.
KHANCHUKAI, RATKINVV, RYAZANTSEVAMD, GOLO
-ZUBOVVVANDGONOKHOVANG. 1995. Geology and mineral deposits of Primorsky Krai, Dalnauka, Khanchuk ed., Vladivostok, Russia, 65 p.
KHETCHIKOVLN, GERASIMOVNSANDPAKHOMOVAVA.
1994. Rb-Sr age data and results of quartz inclusions study of Grigor’evsky granite complex, Khanka Lake terrain. Reports of the Russian Academy of Sciences 343: 91–93.
KROGH TE. 1973. A low contamination method for hy-drothermal decomposition of zircon and extraction of U and Pb for isotopic age determination. Geochim Cos-mochim Acta 37: 485–494.
KROGHTE. 1982. Improved accuracy of U–Pb zircon ages by
the creation of more concordant systems using air abrasion technique. Geochim Cosmochim Acta 46: 636–649. KROGHTEANDDAVISGL. 1975a. Alteration in zircons
and differential dissolution of altered and metamict zircon. Carnegie Inst Wash Yearb 73: 560–567.
KROGH TE ANDDAVIS GL. 1975b. The production and preparation of 205Pb for use as tracer for isotope dilution analyses. Carnegie Inst Wash Yearb 75: 416–417. LANCELOTJR, VITRACAANDALLEGRECJ. 1976.
Ura-nium and lead isotopic dating with grain by grain zircon analysis: a study of complex geological history with a single rock. Earth Plan Sci Lett 29: 357–366.
LUDWIGKR. 2001. User’s manual for Isoplot/ Ex Version 2.49. A geochronological toolkit for Microsoft Excel. Berkeley Geochronology Center, Berkeley, CA, USA, Spec Pub 1a, 59 p.
MACAMBIRA MJB AND LAFON JM. 1995.
Geocronolo-gia da Província Mineral de Carajás. Síntese dos dados e novos desafios. Bol Mus Para Emílio Goeldi, Série Ciên-cias da Terra 7: 263–288.
MACAMBIRA JB, MACAMBIRA MJB, SCHELLER T AND
GOMESACB. 1996. Geocronologia Pb/Pb e tipologia de zircões de rochas vulcânicas da formação Carajás-Pará; indicador da idade dos BIF. In: CONGRESSOBRASILEI -RO DEGEOLOGIA39, Salvador, BA, Brasil 6: 516–519.
MACHADO N, LINDENMAYER Z, KROGH TE ANDLIN -DENMAYER D. 1991. U-Pb geochronology of Archean magmatism and basement reactivation in the Carajás area, Amazon shield, Brazil. Precambrian Research 49: 329– 354.
MANTONWI. 1988. Separation of Pb from young zircons by single-bead ion exchange. Chem Geol 73: 147–152. MATTINSONJM. 1972. Preparation of hydrofluoric,
hydro-chloric and nitric acids at ultralow lead levels. Anal Chem 44: 1715–1716.
MATTINSONJM. 1994. A study of complex discordance in
zircons using step-wise dissolution techniques. Contrib Mineral Petrol 116: 117–129.
MATTINSONJM. 1997. Analysis of zircon by multi-step par-tial dissolutions: the good, the bad, and the ugly. Geol Assoc Can Meet, Ottawa, Abstract, A98.
NOGUEIRA ACR, TRUCKENBRODT W, COSTA JBS AND
PINHEIRO RVL. 1995. Formação Águas Claras,
Pré-Cambriano da Serra dos Carajás. Redescrição e redefi-nição. Bol Mus Para Emilio Goeldi, Série Ciências da Terra 7: 177–197.
PAQUETTEJL ANDPINC. 2001. A new miniaturized ex-traction chromatography method for precise U-Pb zircon geochronology. Chem Geol 176: 311–319.
PARRISHRR. 1987. An improved micro-capsule for zircon dissolution in U–Pb geochronology. Chem Geol 66: 99– 102.
PARRISHRR, RODDIKJC, LOVERIDGEWDANDSULLIAN
RW. 1987. Uranium-lead analytical techniques at the geochronology laboratory, Geological Survey of Canada. In: RADIOGENIC AGE AND ISOTOPIC STUDIES: Report 1, Geological Survey of Canada, Paper 87-2: 3–7. PINHEIRORVLANDHOLDSWORTHRE. 1997. The
struc-ture of the Carajás N-4 ironstone deposit and associated
rocks: relationship to Archaean strike-slip tectonics and basement reactivation in the Amazon region, Brazil. J South Amer Earth Sci 10: 105–119.
PUPINJP. 1980. Zircon and granite petrology. Contrib
Min-eral Petrol 73: 207–220.
RODDICKJC, LOVERIDGE WDANDPARRISH RR. 1987.
Precise U/Pb dating of zircon at the sub-nanogram Pb level. Chem Geol (Isot Geosci Sect) 66: 111–121. RUBM ANDRUBAK. 1988. New data referring
geologi-cal and geochemigeologi-cal peculiarities of magmatic intrusions within Khanka region. Geol Pacific Ocean 5: 57–67. RYAZANTSEVA MD. 1976. Comparative characteristics of
the Voznesenka and Grodekovo granites of the south part of the Khanka terrain. Igneous rocks of the Eastern Asia, Vladivostok, Far East Scientific Center, USSR Academy of Sciences, p. 69–73.
RYAZANTSEVAMD, GERASIMOVNSANDGOVOROV IN. 1995. Rb-Sr isotopes and petrogenesis of igneous rocks in the Voznesenka ore district, Primorye. Geol Pacific Ocean 11: 579–596.
STACEY JS ANDKRAMERSJD. 1975. Approximation of terrestrial lead isotope evolution by a two-stage model. Earth Planet Sci Lett 26: 207–221.
TASSINARI CCG, BETTENCOURT JS, GERALDES MC,
MACAMBIRAMJBANDLAFONJM. 2000. The
Ama-zonian Craton. In: CORDANIUG ET AL. (Eds), Tec-tonic Evolution of South America, 31st Int Geological
Congress, p. 41–96.
TERAFANDWASSERBURGGJ. 1975. Precise isotopic anal-ysis of lead in picomole and subpicomole quantities. Anal Chem 47: 2214–2220.
TRENDALLAF, BASEIMAS, DELAETERJRANDNELSON
DR. 1998. SHRIMP zircon U-Pb constraints on the age of Carajás formation, Grão Pará Group, Amazon Craton. J South Amer Earth Sci 11: 265–277.
VANSCHMUSWRANDCHEMALEJRF. 1996. U-Pb isotope dilution analyses of single zircon grains without chemical separation. In: CONGRESSO BRASILEIRO DE GEOLO
-GIA39, Salvador, BA, Brazil 6: 617–619.
WIEDENBECKM, ALLEP, CORFUF, GRIFFINWL, MEIER
M, OBERLI F, VON QUADT A, RODDICK JC AND
SPIEGEL W. 1995. Three natural zircon standards for