Some palaeoecological data
from Rondonia, southern part of the Amazon Basin. (*)
Abstract
Palynological investigations on sediment cores from three localities in Rondonia in the southem part of the Amazon Basin, indicate that marked vegetational changes have ocurred there. The series or samples from Katlra represents the late Cenozoic, probably Quat~:.rnary . The sediments from Capoei-ra might be partly of Holocene age (and possibly Upper Pleistocene as well) . Apparently the climatic changes during severa! intervals or the Late Cenozoic (Quaternary) caused the development of savannas in this region which is now covered in tropical forest .
INT.RODUCTION
lt is now generally accepted that during dry periods in the Pleistocene the Amazon forest was reduced to a number of isolated patches or refuges and the rest of the area was covered with open vegetation. This theory of the existence of forest refuges was postulated by Haffer (1969) from his studies on the speciation of Amazonían birds.
Subsequently Vanzolini and Williams (1970) and Vanzolini (1973) have presented substantial evidence from lizard studies to support this theory, as have Brown and Mielke (1972). Brown (1975), Brown
et ai.
(1974), for Heliconiid butterfl ies and Prance ( 1973) for severa I plant families.However, most of the support for the theo-ry in the papers mentioned above has been collected from studies on the distributions of extant species and the use of the data to in-terpret climatic changes in the Pleistocene is necessarily an extrapolation.
Mar ia Lúci a Absy (1)
Th. van der Hammen (2)
Palynological evidence from cores of sedi· ment samples from Rondonia have shown that grass-savanna replaced the tropical forest during a particular interval of the Pleistocene age (Hammen, 1972 and 1974) .
lt seems that the vegetational changes resulting from the fluctuations in climate caused movements of the populations of indige-nous people as has been suggested by Meggers and Evans ( 1973) .
Recently Journaux ( 1975) h as given geo-morphological data indicating climatic changes during the Ouaternary in the Amazon Basin .
The pollen diagrams presented here are based partially on the same material mentioned by Hammen (1972, 1974).
At the present time the Amazon Basin is largely covered by forest but some areas have a savanna vegetation which may serve as refuges for species of plants and animais that do not live in the forest. The localities from which samples were collected are at presant forested and the nearest area covered with open vegetation type is found at a distance of about 300 Km .
THE PRESENT VEGETATION
The important information on the present vegetation of Rondonia has been given by Dr. Ghillean T . Prance (personal communication).
The present day vegetation of Rondonia is predominantly tropical rain forest except for a few are as of other vegetation types. The forest of the Aio Machado region is one of the
( • ] - Thls research was lnltiated at Hugo de Vries Labo ratory ot Amsterdam wlth o grant ot the Dutch government and carrled out In the Instituto Nacional de Pesqul sas da Amazônia .
( 1 ) - Instituto Nacional de Pesquisas da Amazôni'a, Manaus .
tallest and rlchest in species of the entire Amazon basin. In the South of Rondonia and east of the Chapada dos Parecis there is a line of 1solated patches of savanna that are closely related phytogeographically to the Cerrados of Central Brasil. The hilly part of Rondonia, speci<tlly the Serra do Pacaás Novos and the Chapada dos Parecis has a lower upland scrub vegetation near to the summits. This area is little known botanically and has much locol endemism of plant species. Near to the Rio Madeira at Abunã there ls a large palm swamp with a large number of p'alms and a grassy ground cover.
The thrce areas studied are ali well with in the species rich rain forest area between the Rios Jamari and Machado. They are distant from any open vegetation, but it is interesting that Savanna vegetation occurs at about 300
Km distance both to the North and to the South. To the North are the large savannas of Humaitá which have isolated patches north of the Rio Madeira almost to Porto Velho. To the South are the isolated patches of savanna related to the Cerrados. Perhaps both these Savanna areas North and South of the region studied are relics of the much more widespread Savannas of the dry periods.
METHODS
SAMPLES COLLECTED
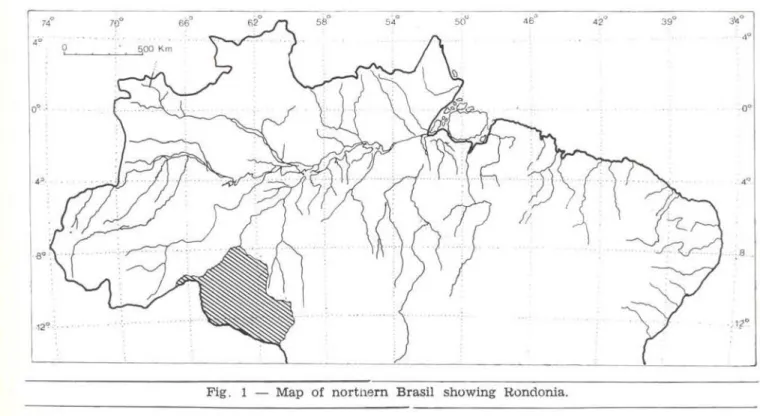
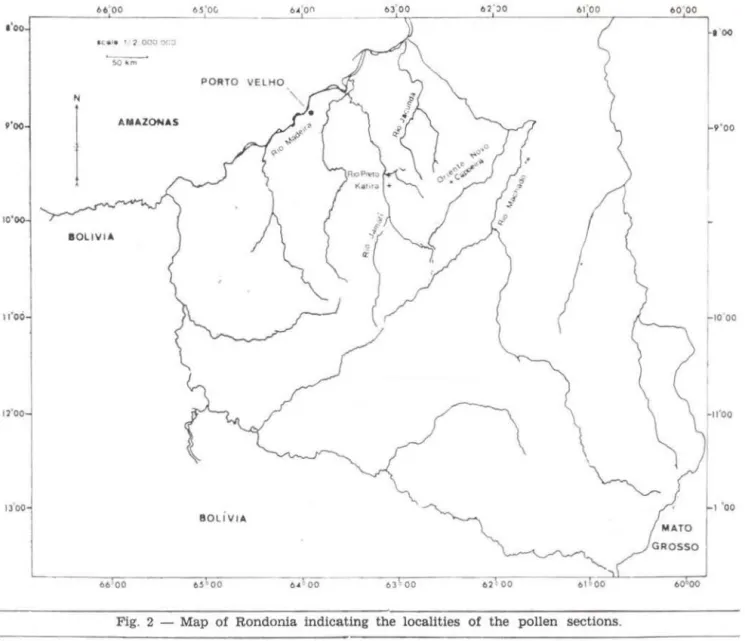
The material was collected in Rondonia (Fig. 1) in three localities : Katira, Capoeira and Rio Preto (Fig. 2).
Ali samples were boíled for 1 O minutes in a 10 percent KOH aqueous solution (Faegri
& lversen, 1966), followed by acetolysis (Erdtman, 1960) and a specific-gravity sepa-ration by use of a bromoform-alcohol mixture (Kummel & Raup. 1965).
The pollen grains were mounted in glycerin jelly for examination at magnification up to
X 1000.
IDENTIFICATI~ OF THE POLLEN GRAINS
Most of the pollen grains were identified with the aid of published descriptions and
294-keys and comparisons with the collectlon of recent pollen in the Hugo de Vries Laboratory, Amsterdam.
ldentification of most types was possible to the family and in some cases to the generic levei.
The pollen grains not so classified were named provisionally according to the type of apertures.
Of the types of pollen mentloned in this study most have been illustrated by Absy
(1975) and some are illustrated here. (Piate
I, 1-7) .
POLLEN DIAGRAM
The method used for the composition and illustration of the diagrams, showing the fluctuations of the pollen belonging to severa! groups of plants was based on Wymstra &
Hammen (1966).
In the diagrams the sum of herb and arboreal pollen was used as a basis for
calcu-lation of the percentage occurrence of pollen. For each sample a minimum of 200 pollen grains were counted. In only one case it was not possible to obtain this total amount be· cause of insufficient pollen.
The spores were excluded from the sum of the total pollen, but their numbers were expressc.d as percentages of that sum.
The spectra of the general diagram repre-sent a cumulative percentage of pollen and thus it is related to 100% of the total counted
pollen grains.
In this diagram the pollen percentages of the following plants were represented from left to right.
RESULTS
1 - Gramineae.
2 - Compositae, Cuphea.
3 - Labiatae, Leguminosae, Ranunculus
and Cyperaceae.
4 - Byrsonima, Curatella.
5 - Mauritia.
8
Fig. 1 - Map of nortl'lern Brasil showing Rondonia.
On the right of the general diagram we find the individual curves of ali pollen and f.pore types studied.
To facilitate the discussion. the diagram has been divided into pollen zones according to marked changes. These pollen zones are represented by letters, followed by the number o f the àiagram.
1 he lithological column of the section sampled is illustrated on the left of the diagram.
For the location of the pollen core sites, see Fig . 2.
Diagram I (Fíg. 3)
Katira
According to marked vegetation changes shown in the diagram it was divíded into three pollen zones : A- I; B- I and C- I.
There is a high percentage of Gramineae in a Qreater part of the diagram.
The percentages of the pollen of the trees . mainly Mauritia, show a dominance compared
---with the pollen of herbaceous elements. A relatively high percentage of Palmae, Myrta-ceae, Alchornea. Miconia and l/ex also
charac-terize this zone.
·rhere is an increase in the curves of
Gra-'
mifleae and Cyperaceae and a general de-crease in the curves of the spores .
The B- I zone is characterized by a high percentage of Gramineae and Cyperaceae which reaches a maximum in the límit of the transition between the zones A- I and B· I .
High numbers of Compositae, Cuphea and
Labiatae pollen are also represented in the B- I zone .
The percentages of the pollen of the trees and of spores decrease considerably .
Thís zone is formed of black clay at the top and grey clay in the basal part.
The C- I zone shows a complete dominance of the herbaceous elements wíth a high percentage of Gram1neae.
The curves of Compositae and Cuphea
uoo 65'0~ 64 OI' 63 00 62 ~o ói OO oo oo
e'o 1 00
u. ele t 1 000 oc:=
.
~-;:-;;---PORTO N
P'OO AMAZ~AS
lO'
8 0LI\IIA
11'00 -1000
I
-1roo
13 00
BOLÍVIA
.
r·
'ooMATO GROSSO
6o oo 65 00 ó3" 00 62 . 00
Fig. 2 - Map of Rondonia indicating the localities of the pollen sections.
There is an increase in the percentages of pollen of Mauritia, Palmae, Myrtaceas and
Malpighiaceae.
The curve of psilate monolete spores rises again in this zone.
Lithologically light clay and black clay form this zone .
Diagram li (Fig. 4)
Capoeira
The pollen zones represented in this diagram are : A- 11. B-11 and C-11.
The percentage of the pollen of the trees ls well represented in the A- 11 zone.
296-Palmae, Jriartea, Didymopanax and
Gutti-ferae pollen curves remained constant _
At the transition point between A-11 and
B- 11 zones the percentage of Symphonla rises to a relatively high proportion and the curves of most of the tree pollen fali. The per-centage of Gramineae is considerably higher. The curves of the psilate monolete and trilete spores show an lncrease .
The A· 11 zone is formed of sandy and humic material.
A dominance of pollen of open vegetatlon, represented by high values of Gramlneae, characterize the B· 11 zone.
There is an increase in the curves of : Palmae, /riartea , Didymopanax, Alchornea,
Anacardiaceae and Protium.
In the B- 11 zone the curves of Artemisia
and Leguminosae rise and the percentage of Gramineae decreases towards the top of this zone .
The curves for psilate monolete and trilete spores are relatively high .
Lithologically this zone is formed of sandy and humic material.
In the C-
11
zone the proportions of most of the pollen of the trees rises until the endot
the zone .
The curves of Mauritia and Palmae in·
crease while the curve of lriartea decreases. The percentages of Alchornea,
Anacar-diaceae, Cecropia, Ficus, Urticaceae, Ulmaceae
and Viro/a , are relatively high in this zone and
the curve of Gramineae decreases sharply. The monolete and trilete spores show high percentages .
Lithologically sandy and humic material forms this zone.
Diagram
111
(Fig. 5)Rio Preto
This zone is formed of a humus with some clay and of a rock basement .
The percentages of Myrtaceae, Didymopa-nax, Byrsonima, Curatel/a, Anacardiaceae,
Ru-biaceae and Urticaceae are high, diminishing towards the top. The curve of Alchornea
remains constant .
The Gramineae are well represented . Of the spores, the curve of the psilate monolate and trilete spores show an increase.
DISCUSSION AND CONCLUSIONS
From the data supplied by the pollen dia-grams it is probable that at least this part of Rohdonia supported a grass savanna during at least some intervals of the Late Cenozoic (Ouaternary . ) This vegetational t:ype ls
ty-picai of tropical regions that receive a more limited rainfall and marked alternation of dry and wet seasons .
The dominance of open vegetation with mainly grasses, e. g. Cuphea and Cyperaceae
in Katira, and their abundance In Capoeira and Rio Preto suggests that savanna existed in this area .
The diagrams examined show marked changes in the vegetation from forest or woodland to open savanna . A rich flora, characterized the tropical torest with Mauritia,
lriartea and other palms, //ex, Symphonia, Miconia, Alchornea, Didymopanax, Myrtaceae,
Melastomataceae, etc.
The presence of Symphonia, Hedyosmum,
and Compositae liguliflorae in the Katira section would indicate a Pliocene to Late Oua-ternary age. The sediments of Capoeira might be a Late Ouaternary. The pollen content ot the uppermost sediments of this section is in agreement with the present vegetation .
Although the results of the present study, provide no detailed evidence of climatic changes, the latter probably caused the de-velopment ot savanna in the area under dis-cussion.
Other evidence on fluctuations of savanna forest boundaries was given by Wymstra & Hammen (1966) with regard to pollen diagrams from the Llanos Orientales (Colombia) and the Rupununi Savanna (Guiana) . Open savanna existed in the first mentioned region particu-larly about 4. 000 BP and in the other region in the I ater part of the .. Last Glacial".
The data presented here support the zoologica l, archeological and botanical
evi-dences for the theory of forest refuges . Howewer, further investigation and C14 analy-sis of the sediments may yield more infor-mation to substantiate this theory.
ACKNOWLEDGMETNS
RESUMO
O conceito de que houve perlodos de clima se-co durante o Plei-.toceno na Amazônia, vem sendo debatido por inúmeros pesquisadores nos últimos anos. A teoria dos refúgios, proposta por Ha!!er, deu inlcio a uma série de estudos para a explica. ção das mudanças climáticas da área amazônica . A maioria desses estudos foram baseados na distri-buição atual de certas espécies de plantas e ani-mais. Entretanto, o uso de dados para interpreta-ção das flutuações climáticas no Pleistoceno exige uma extrapolação. Evidências pallnológicas de Ron-dônia mostraram que savanas de gramíneas substi-tuíram a floresta tropical durante certos periodos do Pleistoceno .
Neste trabalho são discutidos os resultados da análise de pólen de amostras de sedimentos de Ron-dônia. Os diagramas polinicos mostraram mudan-ças na vegetação de floresta para savana c vice-ver-sa. Os sedimentos de Katira devem ser de idade Cenozóica Superior, provavelmente Quaternária. Os sedimentos de Capoeira r epresentam em parte uma idade do Holoceno (e, possivelmente, do Pleistoce. no Superior} . As condições climáticas ocorridas durante certos intervalos do Cenozóico Superior (Quaternário} par~em ter favorecido ao desenvol-vimento de savanas na área em discussão, que é atualmente coberta pela noresta tropical.
LITERATURE Cl'DED
A.BSY, M .L.
1975 - Pólen e esporos do Quaternário de San· tos (Brasil). Hoehnea, 5 : 1-26.
BROWN JR., K .S.
1975 - Geographical pattems of evolution in Neotropical Lepidoptera . Systematics and derivation o! known and new Heliconiini (Nymphalidae: Nymphalioae). J . E n t. (B) 44(3) : 201-242.
BROWN JR., K.S . & MIELICE, O .F.F.
1972 - The Heliconians of Brazil (Lepidoptera: Nymphalidae) Pt. II. Introduction and general comments, with a suplementary revision o! the tribe . Zoologica (N Y . Zoolog!cal Society) .
BROWN JR., K .S.; TURNER, J.R .G . & SHEPPARD, P .M .
1974 - Quaternary refugia in tropical America: evidence from race !ormation in Hellco-nius butter flies . Proc. Royal Soe. Lon-doo B. 187 : 369-378 .
ERDTMAN, G .
1960 - Tbe acetolysis method: - a revised description. Sv. Bot. Tidskr Lund, 54(4) : 561-564.
298-FAEGRI, K . & ] VERSEN, J .
1966 - Textb ook of poUen analysis. 2. ed. Copenhagen: Munksgaard, 228 p., 8 pl., 23 fig. , 8 tab.
HAFFER, J
1969 - Speciation in Amazonian forest birds Sciencc, 165 : 131-137.
H AMMEN, T . VAN DER.
1972 - Chang_,s in vegetation and climate in the Amazon basin and surrounding areas during the Pleistocene Geologie mij nb., 51, 641-643.
1974 - The Pleistocene changes o! vegetation and climate in tropical South America, Journ. Biogeogr., 1 : 3-26.
JOURNAUX, A .
1975 - Recherches géomorphologiques en Ama-zonie brésilienne Bull. Centr. Géo. morph., Cahen. 20 : 3·68
KUMMEL, B . & R~UP, D .
1965 - Handbook of Paleontological techni. ques. San Francisco and London, Free. man and Company, xiii
+
852 p., ilustr.MEGGERS, B .T . & EVANS, C .
1973 - A reconstituição da pré-história amazô-nica. Algumas considerações teóricas. In: O Museu Goeldi no Ano do Sesqu1-centenRrio. Publ. Av. Mus. Pa . Emílio Goeldl, Belém, 20 : 51-69.
PRANCE, G . T .
1973 - Phytogeographic support for the theory o! Pleistocene forest refuges in the Amazon Basin, based on evidence from distribution patterns in Caryocaraceae, Chrysobal:anaceae, Dichapetalaceae and Lecyth\daceae . Acta Amazonica, 3(3) : 5-26 .
VANZOLINI, P . E .
1973 - Paleoclimates, Relie!, and Species Mu\ tiplication in Equatorial Forest . In: Meggers, B . J . et ali i. - Tropical F o. r ests Ecosystem s in Africa and South America. A comparative r eview. Wru:; hlngton. Smithsonian Press. p 255 1 fig.
VANZOLINI, P . E . & WILLJAMS, E .E
1970- South American anoles: the geographic differentiation and evolution o! the Anolis chrysolepis species group ( Sau-ria, Igua.nidae ) Arg. Zool. S. Paulo, 19: 1·240.
WYMSTRA, T . A. & HAMME.N, T . VAN DER.
1966 - Palynological data on the history o! tropical Savannas in Northem South America. Leidse Geol. Meded., 38: 71-90, 15 fig., 7 pl .
..__
·
.
.~
40 14m
40,u.rn
6
1- 401'"'
4' 5
'
,.
7
m 2- 3-4 11 12 13
fiG.3 .· _ O IAGRAM
I
"
QJc :::> o ( ) A-I
+
+
+
+
+
+
i'+
+
tt
+
+
+
+
+
+
+
+
10 20
K A TI
R A
+
30 40 50 60
(]) c ~ O> c .Q! 8.<{
õ
t- '-QJ a:
.D ::J
E <t
~ ~
69
2 19
467
~ -- ~-- ~~ ~t---~ -- ~ ~~ t--- ~ 7~0 -- -;80~--qo~--~ 100 %
.,, 90 I
8b
I f I I I I I I70 60 50 40 Scale for a li c urves
LEGEND
Strati gr. co lumn
3D 20 10 0 °;~
Poll en diagra m
~
GRAMINEAE20
f.>:::-::::
1 COMPOSITAE + CUPHEA30 40
UJ <{ ~ ...l <{ o.
I
50 % UJ <l UJu
<I t-a: > ~ X <{z
<{ o.o
:!!! >o
o
~
YE LLOW-GREY SANDY CLAY§
YELLOW- BROWN CLAY~
BLACK CLAYt:a
GREY CLAYD
LA61ATAE:+ LEGUMINOSAE t RANUNCULUS +CYPERACEAEw
MAU~ITIA
: ~
ot her .tores t e l ementsSome palaeoelogical data ...
FIG. 3
DIAGRAM I
<{ w
z
c::
o
Iu
...l <{ ww
<I<{
w
UJ ~
~ ~
o
Cllo. ~
<1:
o
(/') Cll
UJ <{
w
UJ<{
u
UJ <I~z _<t
IXJ...l
::::>0
c::
r./)(/') ::::> o.
a:
ctu
o
· o
o
o. UJ <I UJz
~ <1:a:
(!)Some palaeoelogical data
···
UJ
<1: UJ
u
<l<l:
~ffi
a..
a.::J >
u u
UJ t-<{ ~
v;
a. UJ...
w ...loc
t-...
i
~
~
w
...
UJ
...l
oc
1-w
~
u
"'~ ;;
o "'
"'
""'"
; I
w
~...
I
3
1 I
···. ·.~ ·· · ··.·:· ..
·:···.· :·.· ·:·.··.·:':
:.·.·.·.:.::.·
..·
..,·
:..
·
..
·:·.:.· :· ··.·:·
.. :~·::-.~ .·...
·
...
:::::::
.. ...
~.. . ... ..
:.
. .· .
: :.:.
-:::::.
;...
·....:~ =::~:
::-:~-::
·:
·:·.
~~:
:. :
·;:-:-::.:-.::.
:: ;
.-:.:~ -~
....
~. :.::~
; :-:· ·_. .. -:
:
.: ::.: ·_.
:·
....
-:
·:
<·: ·: ·:·
.:·:
~
.;
·.~: ·~ ~
s
~
UJ _ .... TO-
8
~
'
õ U)l ...:"
oro
fi) () )lo
z-
oc
c-<
g
)o
z
c
:I:c
~ (5 ~~
m::c
>
r-~
~o
....,
wo
i"'
m
g:s
C)
m
01+-U!
z
o o
c
o o
·+Q)
w
....,
o o
~ ao
o o
...
...
)loI
-
-
...
w
lll ·I....
2
-
--l ... -= -I <= -="""
c-')
-
z>
-c
o
"'"
-:::t!J
>
~mo
.
~ ~~~
·.\'/ ~•
+i;~
~
U)
o o
...
- -8
MUMBER OF POLLEH GRAIHS
o
~ r- () G)c_...,
>
mo
::CQ.i:r G)
m
c
:s:
)lo lO:D
::c
é "1:1 ~~-
:s: o
z
3 -i-
fi)-n
z
mo
>
o
-1>
:IJ fi)>
mm
>
m(JJ
--t m
+
m
r r
~ dP~ ~
•
~OI w
o - (JJ
()
Q)
Ô "" ro
Q
N ~ ~
o
-! n ' c:
COUNTEO
AURITIA
LMAE
m
>
~ tD
m
-z
>
...,
...(/'
>
mwn
~
o <
"'
(JJ ""'" o + ;:c )>z
Ui o ~c
z
()c
rc
fi)COMPOSITAE
I
ARTEMISIA
LEGUMINOSAE (MIMOS.)
í
LEGUMINOSAE(CAESALP.)
-
LABIATAE
I
RANUNCULUS
ONOLETE PSILATE
NOLETE VERRUCATE
NOL ETE ECHINATE
--·
m
2
3
4
5
6
7
FIG.
i -
DIAGIU 111
X X
)C '>< X
>( X X X :X
"
"
(/)
c
RIO PRETO
'iiirn
><
ct
c LU
.!!! c(
z
~
o
a. ct wLU
u
o... ct
~
~õ
ã:
~~-o :J
a::
~
OJ Q) ct ....J >
~
õ
I J
-~ ~
!; c
:J
5
2<..>l~!l! l!:!!-
:::
o
10 20 30 40100 90 80 70 60
.,Stratigr. co1umn
~
HUMUS WITH SOME~
ROCK BASEMENTSome palaeoelogical data .
50 60 70
50 40 30
LEGEND
CLAY
80 90 100% Scale for ali curve s
cO 10 o%
o
10Pollen diagram
- GRAMINEAE
1/~~{;~
; :; q
COMPOSIT AED
LEGUMINOSAE20 30
f=:~-
j
BYRSONI MA +CURA TELLAD
M.AURITIA~ other forest element~
Some palaeoelogical data
ct ct ct
LU z ~ ....J -'
0::
2
wo o
:r:
~
1/')
~ 0:: 0:: ::>
>
<( CXl
u
40 50%
UJ
...
ct
LU LUU
ct 1-:J
w Ul LU LU LU <to:: w
ct c( w
~
~o:: ...ct w ct ct IJ')L.LI ct
ctw w w
~
w LU~ w wa.>
....Jct
~
w~
w w ct-U
u
c(~ w ct ct 1/')v;
Z< LU
õ
coct _w ct ct wo ct 1- w o ww a.z~
u .
w:r::
in
~
...ct ~ ct 0:: o::w
z
u
~
... :!E...
~
z oJJW w\!! ~-
...
ct o~ 1/') >< ct LUIJ'l :Jz
~ o 0:: ~
ôô
1-... z a. o
u
I - ::> U-'u
1-ct ct a. wà
w-' - ....J a. ct a.CD o o i= 0-' ~ 0:: ct ~ a. .z~
=
LU LU<: <: z :::>::> ~ a. Q; 0::