BEVERAGE QUALITY BY ELECTRON SPIN RESONANCE SPECTROSCOPIC
Correlação entre a atividade antioxidante e qualidade de bebida de café por espectroscopia de ressonância de spin eletrônico
Jeam Haroldo Oliveira Barbosa1, Jorge Antonio Gómez Luna2, Angela Mitie Otta Kinoshita3, Oswaldo Baffa Filho2
ABSTRACT
Brazil is the largest producer of coffee in the world and coffee prices are directly linked to grain quality. In this work, the antioxidant activity of coffee was related to its quality through Electron Spin Resonance Spectroscopy (ESR), as an attempt to establish a subjective method to classify the grain quality. For that purpose, the IC50 and temporal monitoring of its non-oxidized fraction were determined for three bean qualities: Soft (High), Hard (Medium) and Rio (Low). Methanolic solution of 2,2-difenil-1-picril-hidrazila (DPPH), that has a stable radical and a JEOL FA-200 (X-Band) spectrometer were used for these tests. The temporal monitoring of reaction between radical and coffee was performed. The rate of reduced or of antioxidated radicals was determined on time and for each coffee beverage quality were found different slopes of curve: Soft (0.32±0.02), Hard (0.47±0.02) and Rio (0.60±0.02). The IC50 result of Rio quality (2.7 ± 0.9) was different from the Soft (7.8 ± 1.9) and Hard (6.5 ± 1.5) values, but there was no difference between the High and Medium results due to the uncertainty associated. Therefore the results found, mainly for monitoring temporal, establish a new quantitative methodology for classifying the coffee beverage quality.
Index terms: Classify, method, IC50.
RESUMO
O Brasil é o maior produtor mundial de café e os preços dessa mercadoria são diretamente influenciados pela qualidade dos grãos. A atividade antioxidante do café foi relacionada com a sua qualidade de bebida através de Espectroscopia de Ressonância de spin eletrônico (ESR), como uma tentativa de estabelecer um método não subjetivo para classificar a qualidade do grão. O teste IC50 e o monitoramento temporal da fração do radical DPPH não reduzida pelas três qualidades de bebida Mole (Alta), Dura (Média) e Rio (Baixa) foram determinados. Uma solução metanólica de 2,2-difenil-1-picril-hidrazila (DPPH), que tem um radical estável e um espectrômetro JEOL FA-200 (banda-X) foram utilizados para os ensaios. O monitoramento temporal da reação entre o radical e o café foi registrado por espectros de ESR. A taxa de radicais reduzidos ou antioxidados foi determinada no tempo e para cada qualidade da bebida do café foram encontrados diferentes inclinações da curva: Mole (0,32 ± 0,02), Dura (0,47 ± 0,02) e Rio (0,60 ± 0,02). O resultado de IC50 de qualidade Baixa (2,7 ± 0,9) foi diferente dos valores de Mole (7,8 ± 1,9) e Dura (6,5 ± 1,5), mas não existiu nenhuma diferença entre os resultados de Mole e Dura, em razão da incerteza associada. Portanto, os resultados encontrados, principalmente para o monitoramento temporal, estabelecem uma nova metodologia quantitativa para classificar a qualidade de bebida dos grãos de café.
Termos para indexação: Classificação, método, IC50.
(Received in september 26, 2013 and approved in october 31, 2013)
1Universidade de São Paulo/USP – FFCLRP – Departamento de Física – Avenida Bandeirantes – 3900 – Monte Alegre – 14040-901 – Ribeirão Preto – SP – Brasil – [email protected]
2Universidade de São Paulo/USP – FFCLRP – Departamento de Física – Avenida Bandeirantes – 3900 – Monte Alegre – 14040-901 – Ribeirão Preto – SP – Brasil 3Universidade do Sagrado Coração/USC – Bauru – SP – Brasil
INTRODUCTION
Coffee has a huge economic importance to Brazil and other producer countries, since it is the second largest item of trade in the international market, with Brazil being the largest producer (NACIF, 2003). Therefore, the search for new technologies that can improve the selection of this product is of great economic value.
Currently in the Brazil, the coffee quality is assessed, among other analyzes (sieving, defects, color), by classification of the beverage based on the sensorial
2008). It should be noted that the characteristics and intensities of taste sensations, as well as flavors and aromas predominating in the drink, are analyzed by a certified technician. Obviously this is a qualitative process and therefore is a subjective classification of quality.
The coffee has several volatile compounds, these make the quantitative classification of coffee quality difficult, because some beans from a specific species or from some regions can have more types of compounds than others, and the sorter can be confused (MARIA; MOREIRA; TRUGO, 1999; MOREIRA; TRUGO; MARIA, 2000).
In the literature, physical techniques have been used for 10 years to study different properties of coffee, such as: quantification of caffeine in coffee beverage via UV-Vis spectrometry (BELAYA et al., 2008); conservation states of caffeinated samples via UV-Vis spectrometry (SOUTO et al., 2010), evaluation of green coffee bean quality using near infrared spectroscopy (SANTOS et al., 2012); authenticity of Instant Coffee via proton nuclear magn etic resonan ce spectroscopy (CHARLTON; FARRINGTON; BRERETON, 2002); differentiation of Arabica and Robusta varieties of coffee with the electronic Aroma-sensing Device (FREITAS; PARREIRA; VILAS-BOAS, 2001); differentiation of coffee flavor via electronic tongue (RIUL et al., 2003). But none of these related the coffee beverage quality with parameters measured by these physical techniques.
Some chemical attributes of Brazilian coffee have been reported relating the bean quality classification to the sensorial analysis. Carvalho et al. (1994) found correlation between the coffee beverage quality with polyphenoloxidase enzyme activity. They suggested that could complement the sensorial test (CARVALHO et al., 1994). However, Mazzafera, Gonçalves and Shimizu (2002) more recently showed that this technique need to be re-evaluated because they found relationship between extr action method an d dosage of th e en zyme (MAZZAFERA; GONÇALVES; SHIMIZU, 2002). Farah et al. (2006) observed th at trigonelline and 3,4-dicaffeoylquinic acid in green and roasted coffee are present in high quality beans, while the caffeoylquinic acids (predominantly 5-caffeoyilquinic acid), feruloylquinic acids, and their oxidation products are present in poor cup quality (FARAH et al., 2006). However, the authors did not applied this methodology to classify the several qualities of coffee.
Abrahão et al. (2010) have attempted to sort the beverage quality by means of the relationship with its
own ch ar acter i sti cs: bi oa ct ive com poun ds a n d antioxidant activity (ABRAHÃO et al., 2010). However, these authors could not find significant difference between these properties and the quality classification. The possible reason can rely on the fact that the antioxidant activity of coffee is very dependent on roasting due to the Maillard reaction (BEKEDAM et al., 2008; MORAIS et al., 2009; BREZOVÁ; SLEBODOVÁ, 2009). Therefore, if the roasting is excessive, it is impossible to differentiate the beverage quality by antioxidant activity.
A previous study of our group differentiated the quality of the coffee beverage using the Electron Spin Resonance (ESR) spectroscopy technique (IKEYA; BAFFA; MASCARENHAS, 1989). High doses of ionizing radiation were applied in different quality beans to create free radicals. These radicals were measured by ESR and a relationship between the amount of free radicals and quality was established. However, the use of ionizing radiation makes this methodology difficult to use in everyday practice.
In this work, we propose a simple method to differ en tiate th e beverage quality th r ough ESR spectroscopy without using ionizing radiation. The methodology is based on the association between antioxidant activity and quality of coffee beverage.
MATERIAL AND METHODS
Samples
Samples of green coffee (Coffea Arabica L.) from the 2010/11 crop season in southern Minas Gerais were provided by SAAG (Sociedade de Armazenamento e Agricultura) at the request of Dr. Flavio Meira Borém of the University of Lavras (UFLA).
Sample preparation
To study the antioxidant activity, the free radical 2,2-diphenyl-1-picryl-hidrazil (DPPH) (Sigma-Aldrich) dissolved in methanol at a concentration of 100 μM was used. A methanol solution of DPPH was chosen from a study of the temporal stability of the ESR signal of these solutions at different concentrations. Figures 2 and 3 show the temporal stability of the ESR signal of methanolic DPPH.
Studied solution
For the preparation of a bulk coffee solution (Rio, Hard, Soft Coffees), we used 50mg of ground coffee (already roasted) in 100 mL of Mili-Q water at 90 °C. Twenty minutes after this preparation, a dilution of this main solution at various concentrations: 50, 25, 10, 8, 6, 5, 4, 3, 2 and 1mg/mL was conducted.
In parallel, we prepared a methanol solution of 100 μM of DPPH and Mili-Q water at room temperature. Thus, the studied solutions comprised of a mixture, at room temperature, of 25μL of the coffee solution (diluted at different concentrations) plus 975mL of DPPH methanol solution.
Temporal monitoring of antioxidant activity
The temporal monitoring of the reaction between the radical (975 μL methanolic solution of DPPH) and coffee (25μL coffee beverage at a 6 mg/ml) was performed by recording the ESR spectrum every 3 minutes after reaction, until 45 minutes. The relative concentration over time (Crel(t)) was defined as the ratio of the double integral of ESR spectrum value over time (DIESR(t)) and the double integral of DPPH solution reacted with water (DIESR(DPPH)):
The rate of antioxidated radicals was determined plotting 1-(Crel(t)) as function of time. This quantity measures the reduction of DPPH as a function of time in comparison to the initial dilution and reduction that would happen in pure water.
IC-50 test
This test consisted of recording the ESR spectra of the coffee solutions (25 μL) at different concentrations mixed with 975 μL of DPPH methanol solution. The recording of these spectra was carried out at room temperature and after 2 minutes of mixing with the methanolic solution. This procedure was performed in triplicate for each coffee quality. The IC-50 value was
( ) ( )
( )
ESR rel
ESR
DI t C t
DI DPPH
(1)
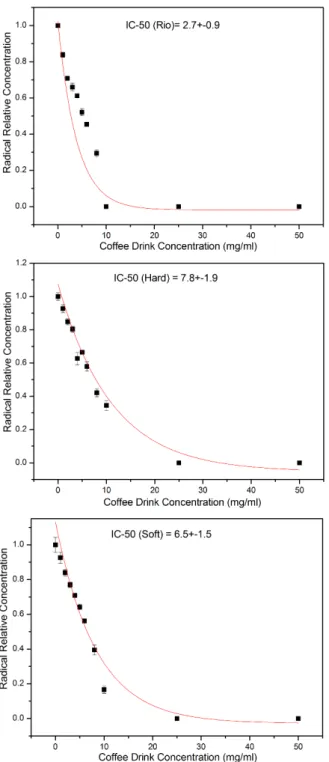
calculated from the values of Crel (t=2 min) as a function of each concentration. Thus, using an approximation of these exponential curves, the value of the concentration of coffee required to reduce 50% of free radicals present in the solution was obtained.
ESR measurements
To assess the relative content of the radicals, all solutions were transferred to a capillary glass tube, which was sealed and placed inside a standard ESR quartz tube (inner diameter 3.00mm). ESR spectra was recorded in an X-Band (Jeol JES-FA-200) with a central magnetic field of 339mT, scanning field of 7mT, scan time of 2 minutes, modulation amplitude of 0.1mT, modulation frequency of 100kHz and microwave power of 1mW.
RESULTS AND DISCUSSION
The solution of the 100 μM DPPH in methanol showed a constant ESR signal in the time span of the experiments (60 minutes) (Figure 1), a small variation of only 7% was noticed (Figures 2).
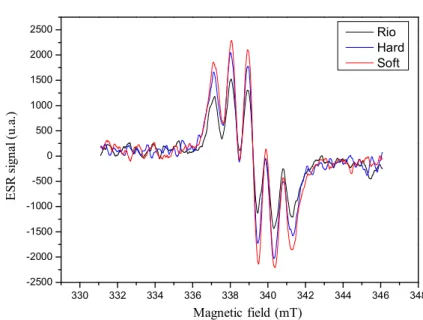
The ESR signal amplitude increased inversely with the beverage quality (Figure 3) after 50 minutes of reaction between DPPH and all the different coffee quality beverages. The coffee beverages classified as Rio was more antioxidant than Hard and Soft ratings.
The plot of the rate of radical reduction (1-Crel) over time for each beverage allowed to better differentiate the coffee quality (Figure 4).
The values of the slope from linear regression of plots in figure 4 are in table 1 that represents the rate of radical reduction per minute.
The inverse relation between the linear regression slope values (Table 1) and the coffee quality was expected, because we selected a specific burn degree to roast the coffee grains, hence this weighted the antioxidant activity differently for each quality beverage. Furthermore, we observed that the roasted Rio quality beans showed a slightly less dark color than the other coffee qualities after roasting. Farah et al. (2006) (FARAH et al., 2006) also observed in the process of roast that color intensity of coffee samples increased significantly with quality, but the authors did not suggested the cause for the behavior of roasted coffee.
Figure 1 – ESR signal for solution with 100M DPPH in methanol. The “2 min” time marks the first measurement. 330 332 334 336 338 340 342 344 346 348
-2500 -2000 -1500 -1000 -500 0 500 1000 1500 2000 2500
Campo Magnético (mT)
2 min 5 min 10 min 15 min 20 min 25 min 30 min 60 min
Figure 2 – Stability of the Double integral of the ESR signal, that measures the concentration, normalized by the average of all signals over time for DPPH methanolic solution of 100 µM versus time.
The results of this work showed that all coffee beverage qualities have an antioxidant behavior against a DPPH radical, in accordance with Abrahão et al. (2010) (ABRAHÃO et al., 2010) and Yanagimoto et al. (2004) (YANAGIMOTO et al., 2004).
As already mentioned, Abrahã, Pereira and Duarte (2010) did not found relationship between antioxidant activity and quality. In this work we established this relation through temporal monitoring
and IC-50 test and we found that antioxidant character varies accor din g to quality bever age coffee. As showed in table 1, the slope of curves are different for each bean quality, the beverage Rio has the highest rate of antioxidant radicals per minute: 0.6/min. Through IC-50 results it was possible the differentiation only the poor quality (Rio) from the others. So, the time monitoring method was more efficient to sort the beverage coffee quality.
E
S
R
s
ig
n
al
(
u
.a
.)
Time (minutes)
D
IES
R
/M
e
an
(D
IES
R
)
Magnetic field (mT)
0 10 20 30 40 50 60
Therefore, the time monitoring method can be used to assist or substitute the quality sorter in the marketing process. However, this method needs standardization and to undergo more validations, for example, by official regulatory.
The method proposed in this work to differentiate the beverage quality was efficient, but some limitations there were: the samples obtained were from a specific 330 332 334 336 338 340 342 344 346 348
-2500 -2000 -1500 -1000 -500 0 500 1000 1500 2000 2500
Magnetic field (mT)
Rio Hard Soft
Figure 3 – Spectra obtained for the reaction of coffee and DPPH after 50 minutes.
0 10 20 30 40 50
0.2 0.4 0.6 0.8
Rio Hard Soft
Time (minutes)
Figure 4 – Rate of radical reduction for different beverage qualities as a function of time. The error of each chart is from the experiment in triplicate.
Table 1 – Slope from linear regression of figure 4.
Magnetic field (mT)
E
S
R
s
ig
n
al
(
u
.a
.)
R
at
e
o
f
an
ti
o
x
id
at
ed
r
ad
ic
al
s
(a
.u
.)
Time (minutes)
Quality Coffee Beverage
Slope [rate of antioxidated radical(a.u.)/minutes]
Standard deviation
Rio 0.60 0.024
Hard 0.47 0.024
CONCLUSIONS
The IC50 test showed that Low quality (Rio) is different from the High and Medium qualities, but there is no difference between the High and Medium results due to the uncertainty associated. On the other hand, the temporal monitoring of the reaction showed a significant different for each bean quality. Therefore, the temporal monitoring results presented a higher specificity than IC-50 and efficient classification the coffee beverage quality. A possible application for this method is in assisting the coffee beverage quality sorter, but it is necessary to consider ways and techniques to perform in a standardized manner.
ACKNOWLEDGEMENTS
This work was supported by CNPq, Conselho Nacional de Desenvolvimento Científico e Tecnológico – Brasil. Fundação de Amparo a Pesquisa de São Paulo (FAPESP) and University of São Paulo (USP) for financial support. Also technical support from Sociedade de Armazenamento e Agricultura (SAAG), Prof. Dr. Flavio Meira Borem, Evandro Galvão Tavares Menezes, Lourenço Rocha e Carlos Alberto Brunello.
REFERENCES
ABRAHÃO, S. A. et al. Compostos bioativos e atividade antioxidante do café (Coffea arabica L.). Ciência e Agrotecnologia, Lavras, v. 34, n. 2, p. 414-420, 2010. BEKEDAM, E. K. et al. Electron spin resonance (ESR) studies on the formation of roasting-induced
antioxidative structures in coffee brews at different degrees of roast. Journal of agricultural and food chemistry, Washington, v. 56, n. 12, p. 4597-604, 2008. BELAYA, A. et al. Measurement of caffeine in coffee beans with UV/vis spectrometer. Food Chemistry, Barking, v. 108, n. 1, p. 310-315, 2008.
BORÉM, F. M. Pós-colheita do café. Lavras:Editora UFLA, p. 631, 2008.
BRASIL. Ministério da Agricultura, Pecuária e Abastecimento. Instrução Normativa n. 8, de 11 de junho de 2003. Aprova o regulamento técnico da identidade e de qualidade para a classificação de café beneficiado grão cru. Brasília, p. 10, 2003. Disponível em: <http://www.ministerio.gov.br>. Acesso em: 20 jan. 20013.
Figure 5 – Graphs of radical relative concentrations versus coffee concentrations.
BREZOVÁ, V.; ŠLEBODOVÁ, A.; STAŠKO, A. Coffee as a source of antioxidants: An EPR study.
Food Chemistry, Barking, v. 114, n. 3, p. 859-868, 2009.
CARVALHO, V. D. et al. Relação entre a composição físico-química e química do grão beneficiado e a qualidade de bebida do café. Pesquisa
Agropecuária Brasileira, Brasília, v. 3, p. 449-454, 1994.
CHARLTON, A. J.; FARRINGTON, W. H. H.;
BRERETON, P. Application of 1 H NMR and Multivariate Statistics for Screening Complex Mixtures: Quality Control and Authenticity of Instant Coffee. Journal of agricultural and food chemistry, Washington, v. 50, p. 3098-3103, 2002.
FARAH, A. et al. Correlation between cup quality and chemical attributes of Brazilian coffee. Food Chemistry, Barking, v. 98, n. 2, p. 373-380, 2006.
FREITAS, A. M. C.; PARREIRA, C.; VILAS-BOAS, L. The Use of an Electronic Aroma-sensing Device to Assess Coffee DifferentiationcComparison with SPME Gas Chromatography Mass Spectrometry Aroma Patterns. Journal of Food Composition and Analysis, San Diego, v. 14, p. 513-522, 2001.
IKEYA, M.; BAFFA, F. O.; MASCARENHAS, S. Quality assessment of coffee beans with ESR and gamma-ray irradiation. International journal of radiation applications and instrumentation. Part A, Applied radiation and isotopes, Oxford, v. 40, n. 10-12, p. 1219-22, 1989.
MARIA, C. A. B. DE; MOREIRA, R. F. A.; TRUGO, L. C. Componentes voláteis do café torrado. Parte I:
compostos heterocíclicos. Quimica Nova, São Paulo, v. 22, n. 2, p. 209-217, 1999.
MAZZAFERA, P.; GONÇALVES, K. V.; SHIMIZU, M. M. Extração e dosagem da atividade da polifenoloxidase do café. Scientia Agricola, Piracicaba, v. 59, n. 4, p. 695-700, 2002.
MORAIS, S. A. L. et al. Compostos bioativos e atividade antioxidante do café conilon submetido a diferentes graus de torra. Química Nova, São Paulo, v. 32, n. 2, p. 327-331, 2009.
MOREIRA, R. F. A.; TRUGO, L. C.; MARIA, C. A. B. Componentes voláteis do café torrado. Parte II. Compostos alifáticos, alicíclicos e aromáticos. Quimica Nova, São Paulo, v. 23, n. 2, p. 195-203, 2000.
NACIF, A. P. O café e a saúde humana. EMBRAPA Café. (Folheto). Brasília, p. 64, 2003.
RIUL, J. A. et al. An electronic tongue using polypyrrole and polyaniline. Synthetic Metals, Lausanne, v. 132, p. 109-116, 2003.
SANTOS, J. R. et al. Evaluation of green coffee beans quality using near infrared spectroscopy: A quantitative approach. Food Chemistry, Barking, v. 135, p. 1828-1835, 2012.
SOUTO, U. T. C. P. et al. UV–Vis spectrometric
classification of coffees by SPA–LDA. Food Chemistry, Barking, v. 119, p. 368–371, 2010.