Printed version ISSN 0001-3765 / Online version ISSN 1678-2690 http://dx.doi.org/10.1590/0001-3765201520140008
www.scielo.br/aabc
Phosphorus availability and microbial immobilization in a Nitisol with
the application of mineral and organo-mineral fertilizers
FRANCISCO A. MORAIS and LUCIANO C. GATIBONI
Departamento de Solos e Recursos Naturais, Universidade do Estado de Santa Catarina, Av. Luiz de Camões, 2090, 88520-000 Lages, SC, Brasil
Manuscript received on January 16, 2014; accepted for publication on April 17, 2015
ABSTRACT
The aim of this study was to evaluate P availability, P and C contained in the microbial biomass, and enzymatic activity (acid phosphatases and β-glucosidases) in a Nitisol with the application of mineral and organo-mineral fertilizers. The experiment was performed in a protected environment with control over air temperature and soil moisture. The experimental design was organized in a “5 x 4” factorial arrangement with five sources of P and four times of soil incubation. The sources were: control (without P), triple superphosphate, diammonium phosphate, natural Arad reactive rock phosphate, and organo-mineral fertilizer. The experimental units consisted of PVC columns filled with agricultural soil. The columns were incubated and broken down for analysis at 1, 20, 40, and 60 days after application of the fertilizers. In each column, samples were taken at the layers of 0-2.5, 2.5-5.0, and 5.0-15.0 cm below the zone of the fertilizers. The application of soluble phosphates and organo-mineral fertilizer temporarily increased P availability in the zone near the fertilizers (0-2.5 cm), with maximum availability occurring at approximately 32 days. Microbial immobilization showed behavior similar to P availability, and the greatest immobilizations occurred at approximately 30 days. The organo-mineral fertilizer was not different from soluble phosphates.
Key words: alternative phosphate fertilizers, phosphorus adsorption, poultry waste management, soil mi-crobial biomass.
Correspondence to: Francisco Alexandre de Morais E-mail: [email protected]
INTRODUCTION
Most Brazilian soils are highly weathered and exhibit great capacity for the adsorption of phosphorus (P),
such as the Nitisols. Due to the high binding energy between the phosphate and the variable charge colloids, and to the low reversibility of this reaction, the efficiency of phosphate fertilization is reduced, especially in soils with high clay content (Bahia
Filho et al. 1983, Gonçalves et al. 1985). Thus, Conte et al. (2002) and Rheinheimer et al. (2008) affirm that stimulating the microbial biomass of the soil by adding carbon (C) and P could increase the immobilized P content in the biomass, preventing its adsorption to the soil, and increasing the efficiency of phosphate fertilization. This increased efficiency would occur due to the dynamism of the biomass in P recycling because studies show that after application of soluble phosphate fertilizers,
inorganic P (Bünemann et al. 2012). Therefore, after the death of the microorganisms, the microbial P would be mineralized and gradually released in the soil solution. This behavior would delay adsorption and would increase the probability of the nutrient use by plants, as long as there was synchronism between the mineralization of microbial P and the uptake by plants (Conte et al. 2002, Martinazzo et al. 2007).
In addition to the immobilization of the P of the soil solution, the microbial biomass may also obtain P from organic forms through the total degradation of organic matter or from specific mineralization of the organic phosphate through the action of phosphatases-type extracellular enzymes (McGill and Cole 1981). This mechanism allows natural systems to be self-sustainable, without the application of phosphate fertilizers (Guggenberger et al. 1996). However, with an increase in the availability of inorganic P in the soil, the importance of the phosphatases diminishes because inorganic P can supply the needs of the microorganisms (Gatiboni et al. 2008). In a similar manner, β-glucosidases are extracellular enzymes related to the C cycle, being present in the soil in greater quantities in relation to the α-glucosidases and the α- and β-galactosidases. It is believed that the products from the hydrolysis of β-glucosidases are important energy sources for soil microorganisms (Tabatabai 1994), and β-glucosidases activity could be an indication of soil microbial activity.
In 2011, Brazil was the world’s third-largest producer of chicken meat, at 13.058 million tons (BPA 2012). Due to this volume, Brazilian poultry raising, annually generates a large quantity of organic residues, especially poultry litter, with an annual estimated production of 5 to 6 million tons (Traldi et al. 2007). In Brazil, poultry litter is traditionally used as an organic fertilizer, but in recent years its use as a raw material in the manufacture of granulated organo-mineral fertilizers has grown. In this process, the poultry litter is mixed with mineral sources of nutrients,
creating mixed fertilizers. According to Brazilian legislation (MAPA 2004), organo-mineral fertilizer is the product resulting from the combination of mineral and organic fertilizers, mandatorily in accordance with the following specifications: total minimum organic C content of 8%, maximum moisture content of 25%, minimum CEC of 20 cmolc kg-1, and 10% minimum content for the sum of N, P2O5, and K2O.
A hypothesis has been raised that organic matter present in organo-mineral fertilizers may encourage growth of the microbial biomass of the soil, increasing the microbial immobilization of phosphorus, and retarding its adsorption into the soil. As the effect of this type of fertilizer on soil attributes is poorly known, the aim of this study was to assess P availability, P and C contained in the microbial biomass, and enzymatic activity (acid phosphatases and β-glucosidases) in a Nitisol with the application of mineral and organo-mineral fertilizers.
MATERIALS AND METHODS
A completely randomized experimental design was used, organized in a “5 x 4” factorial arrangement, with five sources of P and four times of soil incubation, with four replications. For the “sources of P” factor, the following fertilizers were used: control (without application of P), triple superphosphate, diammonium phosphate, natural Arad reactive rock phosphate, and industrialized organo-mineral fertilizer. The organo-mineral fertilizer used contains 6% N, 16% P2O5, and 8% K2O and is made of a mixture of poultry litter, ammonium nitrate, potassium chloride, diammonium phosphate, and triple superphosphate. For the “time of incubation” factor, parts of the experimental units were destroyed for the collection of samples at 1, 20, 40, and 60 days after fertilizer application and soil incubation.
Fertility Commission (CQFS-RS/SC 2004). The same dose of P (1.54 mg cm-2 of P2O5) was used for all the sources (except the control) based on the P availability in the soil, extracted by Mehlich-1 solution, and the grain yield expectation for the maize crop of 6,000 kg ha-1. The quantities of the fertilizers were calculated according to their total P2O5 contents (Table I). Taking as a reference the quantity of N and K2O applied to the plots with organo-mineral fertilizer, the same doses of nitrogen (0.66 mg cm-2 of N) and potassium (0.88 mg cm-2 of K2O) were used in the other plots, including the control. Ammonium nitrate and potassium chloride were used to supply N and K, respectively.
The soil used was collected from the 0-10 cm depth layer of a Nitisol (IUSS WORKING GROUP WRB 2014) that is used to grow maize in a no-till planting system. The soil sampling area
is located in the municipality of Lages, SC, Brazil (27º 49’15.99’’ S; 50º 35’56.89’’ W). Drying was performed in a greenhouse, followed by sieving through a 2 mm mesh. The chemical and physical characterization of the soil before setting up the experiment is shown in Table II.
The experiment was carried out from March to April 2012 in a closed room at the Santa Catarina State University, in the municipality of Lages. Room temperature was controlled using air conditioning in the summer and heating as of the second week of fall (at the beginning of low temperatures). During the experimental period, the mean minimum temperature was 18 ºC, while the mean maximum temperature was 24 ºC.
Each experimental unit consisted of a column made of four sections of PVC tubing of 10 cm diameter and heights of 10, 2.5, 2.5, and 5 cm. The
TABLE I
Characterization of phosphate fertilizers used in regard to contents of P2O5, cation exchange capacity, and total organic C. Sources of P: triple superphosphate (TSP), diammonium phosphate (DAP),
natural Arad reactive rock phosphate (NP), and organo-mineral fertilizer (OM).
Sources of P % of total organic C
Cation exchange capacity (cmolc kg-1
)
% of P2O5 Water-soluble
(ratio of 1:100)
Soluble in 2% citric
acid (ratio of 1:100) Total
TSP - x - - x - 45 48 49
DAP - x - - x - 39 44 47
NP - x - - x - 0 12 30
OM 8 80 6 11 16
TABLE II
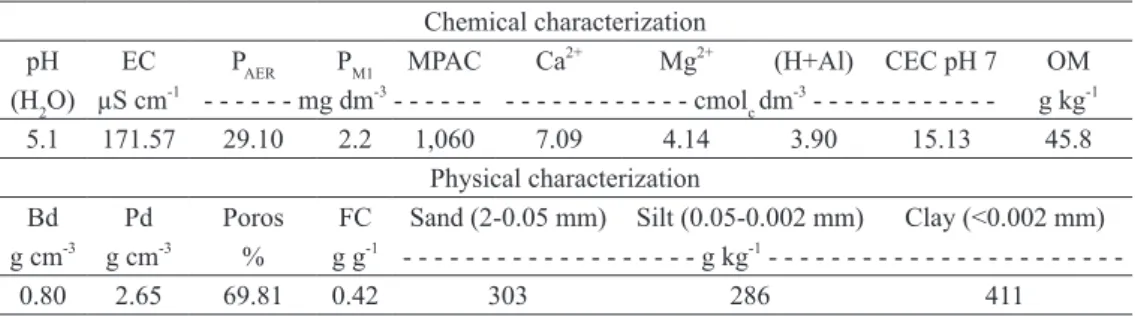
Chemical and physical characterization of the soil before setting up the experiment. Soil attributes: EC = electrical conductivity; PAER = P availability in the soil, extracted by anion exchange resin; PM1 = P availability in the soil, extracted by Mehlich-1 solution; MPAC = maximum P adsorption
capacity; CEC pH 7 = cation exchange capacity at pH 7; OM = organic matter content; Bd = bulk density; Pd = particle density; Poros = total porosity; FC = field capacity.
Chemical characterization
pH EC PAER PM1 MPAC Ca2+
Mg2+
(H+Al) CEC pH 7 OM
(H2O) µS cm-1
- - - mg dm-3
- - - cmolc dm-3
- - - g kg-1
5.1 171.57 29.10 2.2 1,060 7.09 4.14 3.90 15.13 45.8
Physical characterization
Bd Pd Poros FC Sand (2-0.05 mm) Silt (0.05-0.002 mm) Clay (<0.002 mm) g cm-3 g cm-3 % g g-1 - - - g kg-1
sections were juxtaposed in this order and joined by adhesive tape externally (Fig. 1). A polyester
screen (500 µm mesh) was glued to the bottom of the lowest section (10.0 cm height); over this a sheet of quantitative filter paper was added, which allowed drainage of excess water. The columns were completely filled with soil in the three
lower sections, and subsequently, the fertilizers
(previously ground and sieved in a 1 mm mesh) were distributed at the bottom of the upper section
(5.0 cm height) between two sheets of quantitative filter paper. A 1 cm layer of soil was placed over the fertilizers (Fig. 1) for a total of 1,100 g of soil
in each experimental unit.
After being set up, the columns were placed in a protected environment and incubated with moisture near 90% of field capacity, which was corrected daily by weighing the columns and replacing lost moisture with distilled water. During
the incubation period, emerging weeds were pulled
up soon after emergence.
At 1, 20, 40, and 60 days after fertilizer application and soil incubation, a part of the columns was destroyed and the soil of each section was sampled for analysis at the 0-2.5, 2.5-5.0, and 5.0-15.0 cm layers below the fertilizer application zone (Fig. 1). The attributes considered most important were assessed in the 0-2.5, 2.5-5.0, and 5.0-15.0 cm layers, namely, P availability, which was extracted by anion exchange resin, and P
and C contained in the microbial biomass. Other attributes were assessed exclusively in the 0-2.5 cm layer, namely, labile C, pH, and the activity of the acid phosphatases and β-glucosidases enzymes.
P availability extracted by anion exchange resin (in membranes) saturated with HCO3- was determined according to Gatiboni et al. (2008). For the P and C contained in the microbial biomass, the methodologies of Brookes et al. (1982) and Vance et al. (1987) were used, respectively. Labile C corresponds to the “F1” fraction of the fractionation
of C oxidizable by CrO7-2 in an acid gradient, as proposed by Chan et al. (2001). The pH-H2O of the soil was obtained using a potentiometer by means of a combination electrode immersed in a suspension of soil/distilled water at a ratio of 1:2.5 (Silva 2009). The activity of the acid phosphatases and β-glucosidases enzymes was determined according to Tabatabai (1994).
For data interpretation, analysis of variance (F
test) was performed using the SISVAR 5.3 software (Ferreira 2011). When necessary, a regression test
was applied for the “times of soil incubation” factor,
while the Scott-Knott grouping test was applied for
the “sources of P” factor (Scott and Knott 1974)
at 5% probability of error. For the P and C of the
microbial biomass and P availability, each layer
was considered separately.
RESULTS AND DISCUSSION
p availaBility
The sources of P (p < 0.01), the times of soil incubation (p < 0.01), and the interaction between “sources” and “time periods” (p < 0.05) affected the P availability in the 0-2.5 cm layer. Temporal variation was quadratic in the cases of triple superphosphate, diammonium phosphate, and organo-mineral fertilizer (Fig. 2a). In the 2.5-5.0
cm layer, P availability was affected only by times of soil incubation (p < 0.01), showing a similar temporal variation in relation to the overlying layer (Table III). In the 5.0-15.0 cm layer, P availability was not affected by the sources of variation.
P availability did not differ among the sources on the first day after soil incubation. At 20 days, the P availability increased, and the sources of P were divided into two groups: triple superphosphate = diammonium phosphate = organo-mineral
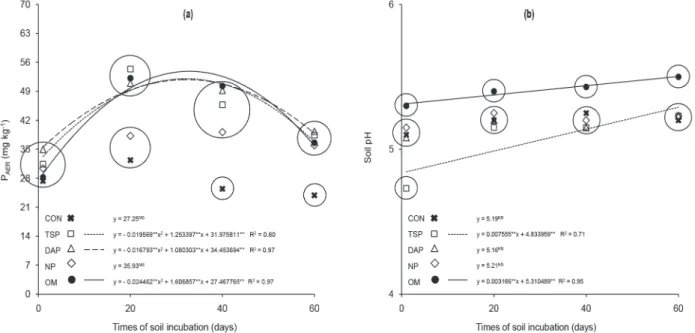
Figure 2 - P availability in the soil, extracted by anion exchange resin (PAER) (a) and soil pH (b) in the 0-2.5 cm layer below the zone of the fertilizers at 1, 20, 40, and 60 days after soil incubation (CON: control, without the application of P; TSP: triple superphosphate; DAP: diammonium phosphate; NP: natural Arad reactive rock phosphate; OM: organo-mineral fertilizer); the circles indicate the groups formed due to the breakdown of the sources of P at each time of soil incubation according to the Scott-Knott grouping test (at 5% probability of error); NS = the interaction between “sources” and “time periods” was not significant.
TABLE III
Equations fitted to P availability in the soil, extracted by anion exchange resin (PAER), P and C contained in the microbial
biomass of the soil (Microbial P and Microbial C, respectively) as a function of times of soil incubation (1, 20, 40 and 60 days) after application of sources of P (control, without the application of P; triple superphosphate; diammonium
phosphate; natural Arad reactive rock phosphate; organo-mineral fertilizer).
Average of all sources of P Equations R2
PAER - mg dm-3
(layer of 2.5 to 5.0 cm) y = - 0.013209**x2
+ 0.746064**x + 29.870403** 0.99 Microbial P - mg dm-3
(layer of 2.5 to 5.0 cm) y = 0.007021**x2
- 0.669258**x + 19.297114** 0.89 Microbial P - mg dm-3
(layer of 5.0 to 15.0 cm) y = 0.007422**x2
- 0.739426**x + 22.238849** 0.88 Microbial C - µg g-1
(layer of 2.5 to 5.0 cm) y = - 3.800601**x + 417.077543** 0.70 Microbial C - µg g-1
fertilizer > natural phosphate = control. At 40 and 60 days, there was a decrease of P availability, and the sources of P were divided into two groups: triple superphosphate = diammonium phosphate = organo-mineral fertilizer = natural phosphate > control (Fig. 2a). The estimated peaks of P availability in the 0-2.5 cm layer exhibited the following values in mg dm-3: 52 at 32 days for triple superphosphate; 52 at 32 days for diammonium phosphate; and 54 at 33 days for organo-mineral fertilizer (Fig. 2a).
The effect of the sources on P availability was restricted to the 0-2.5 cm layer because the fertilizers were not mixed with the soil and because P has little diffusivity in soil (Parfitt 1989). It should be noted that the soil samples were collected below the fertilizer application zone, that is, only the quantities solubilized and spread to underlying layers were estimated. Through the high interaction of P with the colloids, its diffusion is low in highly weathered soils such as the Nitisol of the present study, which has high maximum P adsorption capacity (Table II). Initially, the soil exhibited a “high” status (from 20.1 to 40.0 mg dm-3) in regard to the ranges of interpretation of the P availability contents extracted by the anion exchange resin (CQFS-RS/SC 2004). The application of triple superphosphate or diammonium phosphate or organo-mineral fertilizer temporarily increased P availability in the 0-2.5 cm layer, in addition to altering the soil status to “very high” (> 40.0 mg dm -3
). For natural phosphate and the control, the status was not altered over time. Nevertheless, after the peaks of the P availability for triple superphosphate, diammonium phosphate, and organo-mineral fertilizer has been reached at approximately 32 days, the values decreased rapidly, showing the negative effect of P adsorption in the soil for the efficiency of phosphate fertilization over time. At 60 days, the P availability was already near the initial condition of the soil.
It was expected that the presence of organic anions in the organo-mineral fertilizer would reduce P adsorption in the soil due to competition with the phosphate for the adsorption sites (Andrade et al. 2003, Haynes 1984), which would be reflected in an increase in P availability, at least in areas adjacent to the granules. However, this hypothesis was not confirmed. The organic matter contained in the organo-mineral fertilizer was insufficient to differentiate it from the soluble mineral sources (triple superphosphate and diammonium phosphate) with regard to P availability. Likewise, the increase of soil pH (Fig. 2b) with the application of organo-mineral fertilizer did not achieve sufficient magnitude to affect the values of the P availability.
process of soil adsorption of the P released by the soluble phosphates.
The soil status in regard to the ranges of interpretation of the P availability was not altered over time in the 2.5-5.0 and 5.0-15.0 cm layers. We suggest that the temporal variation of the P availability in the 2.5-5.0 cm layer, reaching a peak of 40 mg dm-3 at 28 days (Table III), was due to the low mobilization of the nutrient at depth in the plots with the application of P, though in an irregular manner because the control and the other phosphate fertilizers did not differ among themselves. In the 5.0-15.0 cm layer, P availability was not affected by the sources, most likely because of the low diffusion of P in the soil, as has already been mentioned. In this layer, the P availability values ranged from 30 to 43 mg dm-3 (data not shown).
The soil pH in the 0-2.5 cm layer was affected by the sources of P (p < 0.01), by the times of soil incubation (p < 0.01), and by the interaction between “sources” and “time periods” (p < 0.01). The temporal variation showed an increasing linear effect for triple superphosphate and organo-mineral fertilizer, while the other sources of P did not exhibit a defined pattern (Fig. 2b). The reduction of pH following 1 day after application of triple superphosphate was a result of the release of H+ ions during the dissolution process (Ernani et al. 2001), and the initial condition was re-established in the second time period of evaluation. The increase of pH with the application of the organo-mineral fertilizer (with poultry litter in its composition) was due to the presence of carbonates originating from poultry feed (Montalvo Grijalva et al. 2010) and from NH3, which is transformed into NH4+, consuming H+ ions.
In contrast to the present study, Ernani et al. (2001) observed that the application of triple superphosphate, maintained a lower soil pH for a period of 32 days, just as the application of diammonium phosphate maintained a higher pH in the same period (this behavior was attributed to
the consumption of H+ ions by the transformation of HPO42- molecules into H
2PO4
-). Nevertheless,
in this case, the soil was mixed with a large quantity of fertilizers (200 g of SFT or DAP per kg of soil), precisely to obtain measurable values in an expressive volume of soil. Under normal conditions, changes in pH occur in the initial periods after fertilizer application, in small magnitude and in areas adjacent to the granules, as observed in the present experiment.
The labile C of the soil in the 0-2.5 cm layer was not affected by the sources of variation. The values ranged from 4.0 to 10.8 g kg-1 (data not shown), showing that the organic matter contained in the organo-mineral fertilizer was insufficient to differentiate it from the soluble mineral sources (triple superphosphate and diammonium phosphate) in regard to the labile C content of the soil.
miCroBial immoBilizationof p
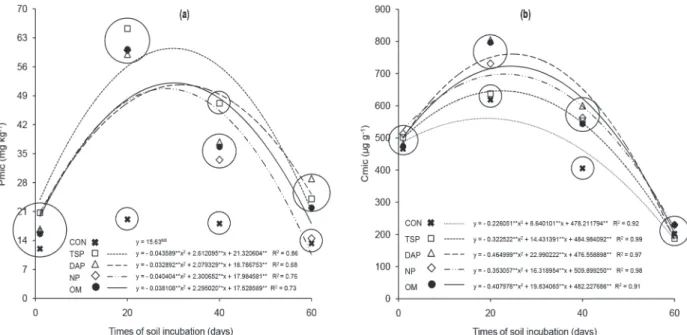
The sources of P (p < 0.01), the times of soil incubation (p < 0.01), and the interaction between “sources” and “time periods” (p < 0.05) affected the microbial P (Pmic) and the microbial C (Cmic) in the 0-2.5 cm layer. Both exhibited quadratic temporal variation, with the exception of Pmic in the control (Fig. 3).
> natural phosphate = control (Fig. 3a). In regard to magnitude, the estimated peaks of Pmic were similar to those found for P availability (with the exception of natural phosphate), exhibiting the following values in mg dm-3: 60 at 30 days for triple superphosphate; 52 at 32 days for diammonium phosphate; 51 at 28 days for natural phosphate; and 52 at 30 days for organo-mineral fertilizer (Fig. 3a).
The Cmic did not differ among the sources of P in the first and last evaluations. At 20 days, the Cmic contents increased and the sources of P were divided into two groups: diammonium phosphate = natural phosphate = organo-mineral fertilizer > triple superphosphate = control. At 40 days there was a decrease of Cmic in relation to the previous evaluation, and the sources of P were also divided into two groups, though with a subtle change: triple superphosphate = diammonium phosphate = natural phosphate = organo-mineral fertilizer > control (Fig. 3b). At 60 days, the Cmic decreased in all the sources of P; however, there was no
difference among themselves. The estimated Cmic peaks exhibited the following values in µg g-1: 561 at 19 days for the control; 646 at 22 days for triple superphosphate; 761 at 25 days for diammonium phosphate; 698 at 23 days for natural phosphate; and 723 at 24 days for organo-mineral fertilizer (Fig. 3b).
It is suggested that the soil microbial biomass dynamic was determined by the availability of P (Gatiboni et al. 2008). As may be observed in Fig. 3b, the Cmic in the control increased temporarily, reaching a peak at 19 days, showing that the increase of microbial biomass occurred due to incubation of the soil under favorable moisture and temperature conditions as well as the application of N and of K. However, the Cmic was greater in the plots that received P, providing evidence that the addition stimulated the microbial biomass. As has already been mentioned, the organo-mineral fertilizer was not a differentiated source of P availability, or of labile C. For that reason, the presence of organic
matter was insufficient to differentiate it from the soluble mineral sources (triple superphosphate and diammonium phosphate) in regard to the immobilization of P (in the mean of all the times of soil incubation). It is noteworthy that the Cmic was limited by the reduction of soil pH soon after the application of triple superphosphate, which ended up being reflected in a lower mean value at 20 days in relation to the other phosphate fertilizers (despite not having affected the Pmic).
In the 2.5-5.0 and 5.0-15.0 cm layers, the Pmic and Cmicwere affected only by the times of soil incubation (p < 0.01), decreasing through time (Table III). The Pmic exhibited quadratic temporal variation, reaching the minimum estimated values of 3 mg dm-3 at 48 days and 4 mg dm-3 at 50 days in the 2.5-5.0 and 5.0-15.0 cm layers, respectively. The Cmic ranged from 413 to 189 µg g-1 in the 2.5-5.0 cm layer and from 414 to 173 µg g-1 in the 5.0-15.0 cm layer. It is probable that the decrease of
the Pmic and Cmic in the layers more distant from the zone of application of the fertilizers (2.5-5.0 and 5.0-15.0 cm) occurred due to the combination of a lack of P availability for the biomass and inadequate aeration. It is believed that if there were no restrictions on soil aeration in the deeper layers, the behavior in these layers would have been similar to that observed for the control in the 0-2.5 cm layer.
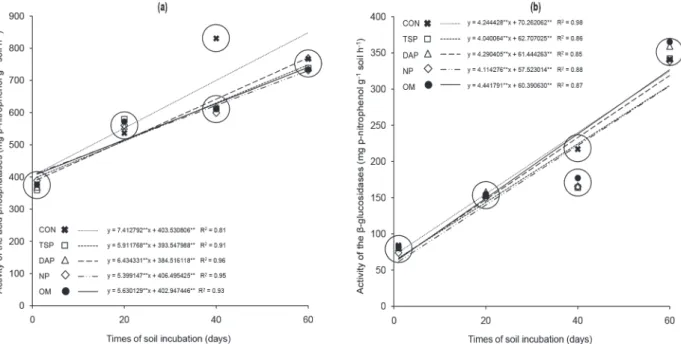
The activity of acid phosphatases and of β-glucosidases was affected by the sources of P (acid phosphatases p < 0.01; β-glucosidases p < 0.05), by the times of soil incubation (p < 0.01), and by the interaction between “sources” and “time periods” (acid phosphatases p < 0.01; β-glucosidases p < 0.05). Enzymatic activity exhibited an increasing linear temporal variation for all the sources of P (Fig. 4).
The activity of the acid phosphatases, in mg p-nitrophenol kg-1 soil h-1, ranged from 411 to 848 for the control, 399 to 748 for triple superphosphate,
391 to 771 for diammonium phosphate, 412 to 730 for natural phosphate; and 409 to 741 for organo-mineral fertilizer (Fig. 4a). The only difference for the activity of acid phosphatases within the times of soil incubation occurred at 40 days (Fig. 4a). The activity of the β-glucosidases, in mg p-nitrophenol kg-1 soil h-1, ranged from 75 to 325 for the control, 67 to 305 for triple superphosphate, 66 to 319 for diammonium phosphate, 62 to 304 for natural phosphate; and 65 to 327 for organo-mineral fertilizer (Fig. 4b). The activity of the β-glucosidases for the sources of P within each time of soil incubation was similar with regard to the acid phosphatases (Fig. 4b).
The temporal variation of the enzymatic activity was different in relation to the P availability and labile C. Therefore, it is suggested that the observed behavior occurred predominantly by release of the enzymes continually over time as a result of the lysis of active cells, which were later complexed and stabilized by the organic matter and by the clay in the soil (Rao et al. 2000, Knight and Dick 2004, Nannipieri et al. 2012).
From the results obtained, in a non-rhizospheric soil, the application of mineral and organo-mineral phosphate fertilizers altered, in different ways, the chemical attributes within the proximity of the zone of application of the fertilizers (P availability and pH), stimulating the occurrence of populational peaks of the microorganisms (differing according to the type of fertilizer), which use simple and readily available substrates. The increase of C in the microbial biomass was accompanied by an increase in the microbial immobilization of P, the magnitude of which was dependent on the availability of P provided for by the solubilization of the fertilizers (the results show that the use of organo-mineral fertilizer did not increase P availability and P immobilization in the microbial biomass in comparison with the other soluble fertilizers). This behavior was temporary because there was a decline in the microbial population after the nutrients were consumed. Thus, P adsorption
was delayed, which would demonstrate the ability of the microorganisms to compete with inorganic soil colloids for the added inorganic P.
ACKNOWLEDGMENTS
We thank Paulo R. Ernani and Juliano C. Corrêa for insightful observations. This study was supported by Coordenação de Aperfeiçoamento de Pessoal de
Nível Superior (CAPES) and Conselho Nacional de Desenvolvimento Científico e Tecnológico (CNPq).
RESUMO
O objetivo deste estudo foi avaliar o P disponível, o P e C contidos na biomassa microbiana e a atividade enzimática (fosfatases ácidas e β-glucosidases) em um Nitisol com aplicação de fertilizante mineral e organomineral. O experimento foi realizado em ambiente protegido com controle da temperatura do ar e da umidade do solo. O delineamento experimental foi organizado em esquema fatorial “5 x 4”, com cinco fontes de fósforo e quatro tempos de incubação do solo. As fontes foram: controle (sem fósforo), superfosfato triplo, diamônio fosfato, fosfato natural reativo de Arad e fertilizante organomineral. As unidades experimentais constaram de colunas de PVC preenchidas com solo agrícola. As colunas foram incubadas e destruídas para análise em 1, 20, 40 e 60 dias após aplicação dos fertilizantes. Em cada coluna foram amostradas as camadas de 0-2,5, 2,5-5,0 e 5,0-15,0 cm abaixo da zona dos fertilizantes. A aplicação dos fosfatos solúveis e do fertilizante organomineral aumentou temporariamente a disponibilidade de P nas adjacências dos grânulos (0-2,5 cm), com máxima disponibilidade ocorrendo em aproximadamente 32 dias. A imobilização microbiana apresentou comportamento similar ao P disponível, e as maiores imobilizações ocorreram em aproximadamente 30 dias. O fertilizante organomineral não diferiu dos fosfatos solúveis.
RERERENCES
andrade fv, mendonça es, alvarez-v vH and
novais rf. 2003. Adição de ácidos orgânicos e húmicos em latossolos e adsorção de fosfato. Rev Bras Cienc Solo 27: 1003-1011.
BaHia filHo AFC, BraGa Jm, resende m and
riBeiro aC. 1983. Relação entre adsorção de fósforo e componentes mineralógicos da fração argila de latossolos do Planalto Central. Rev Bras Cienc Solo 7: 221-226. BPA - Brazilian poultry assoCiation. 2012. Annual
report. São Paulo: BPA, 115 p.
Brookes pC, powlson ds and Jenkinson ds. 1982. Measurement of microbial biomass phosphorus in soil. Soil Biol Biochem 14: 319-329.
Bünemann ek, oBerson a, lieBisCH f, keller f, annaHeim ke, HuGuenin-elie o and frossard
e. 2012. Rapid microbial phosphorus immobilization dominates gross phosphorus fluxes in a grassland soil with low inorganic phosphorus availability. Soil Biol Biochem 51: 84-95.
CHan ky, Bowman a and oates a. 2001. Oxidizible organic carbon fractions and soil quality changes in an oxic paleustalf under different pasture leys. Soil Sci 166: 61-67.
Conte e, anGHinoni i and rHeinHeimer ds. 2002. Fósforo da biomassa microbiana e atividade de fosfatase ácida após aplicação de fosfato em solo no sistema plantio direto. Rev Bras Cienc Solo 26: 925-930.
CQFS-rs/sC - Comissão de químiCae fertilidade do solo - núCleo reGional sul. 2004. Manual de adubação e de calagem para os estados do Rio Grande do Sul e de Santa Catarina, 10a
ed., Porto Alegre: SBCS, 400 p. ernani pr, steCklinG C and Bayer C. 2001.
Características químicas de solo e rendimento de massa seca de milho em função do método de aplicação de fosfatos, em dois níveis de acidez. Rev Bras Cienc Solo 25: 939-946.
ferreira df. 2011. SISVAR: a computer statistical analysis system. Cienc Agrotec 35: 1039-1042.
GatiBoni lC, kaminski J, rHeinHeimer ds and Brunetto
G. 2008. Fósforo da biomassa microbiana e atividade de fosfatases ácidas durante a diminuição do fósforo disponível no solo. Pesq Agropec Bras 43: 1085-1091.
GonçalvesJLM, firme dJ, novais rf and riBeiro aC. 1985. Cinética de adsorção de fósforo em solos de cerrado. Rev Bras Cienc Solo 9: 107-111.
GuGGenBerGer G, Haumaier l and tHomas rJ. 1996. Assessing the organic phosphorus status of an oxisol under tropical pastures following native savanna using 31P NMR spectroscopy. Biol Fertil Soils 23: 332-339.
Haynes rJ. 1984. Lime and phosphate in the soil plant system. Adv Agron 37: 249-315.
iuss workinG GroupWRB. 2014. World reference base for soil resources 2014. Rome: World Soil Resources Reports 106, FAO, 181 p.
kniGHt tr and diCk rp. 2004. Differentiating microbial and stabilized β-glucosidase activity relative to soil quality. Soil Biol Biochem 36: 2089-2096.
mapa - ministério da aGriCultura, peCuária e
aBasteCimento. 2004. Instrução normativa SARC nº 15, de 22 de dezembro de 2004. Brasília: Diário Oficial da União, 23 p.
martinazzo r, rHeinHeimer ds, GatiBoni lC, Brunetto G and kaminski J. 2007. Fósforo microbiano do solo sob sistema plantio direto em resposta à adição de fosfato solúvel. Rev Bras Cienc Solo 31: 563-570. mCGill wB and Cole Cv. 1981. Comparative aspects
of cycling of organic C, N, S and P through soil organic matter. Geoderma 26: 267-286.
montalvo GriJalva df, Crozier Cr, smytH tJ and
Hardy dH. 2010. Nitrogen, phosphorus, and liming effects of poultry layer manures in coastal plain and piedmont soils. Agron J 102: 1329-1339.
nannipieri p, GiaGnoni l, renella G, puGlisi e, CeCCanti B, masCiandaro G, fornasier f, mosCatelli mC and marinari s. 2012. Soil enzymology: classical and molecular approaches. Biol Fertil Soils 48: 743-762.
novais rf, alvarez-v vH, Barros nf, fontes rl, Cantarutti rB and nevesJCL (Eds). 2007. Fertilidade do solo. Viçosa-MG: SBCS, 1017 p.
parfitt rl. 1989. Phosphate reactions with natural allophane, ferrihydrite and goethite. J Soil Sci 40: 359-369.
rao ma, violante a and Gianfreda l. 2000. Interaction of acid phosphatase with clays, organic molecules and organo-mineral complexes: kinetics and stability. Soil Biol Biochem 32: 1007-1014.
rHeinHeimer ds, GatiBoni lC and kaminski J. 2008. Fatores que afetam a disponibilidade do fósforo e o manejo da adubação fosfatada em solos sob sistema plantio direto. Cienc Rural 38: 576-586.
sCott aJ and knott m. 1974. Cluster-analysis method for grouping means in analysis of variance. Biometrics 30: 507-512.
silva fC (Ed). 2009. Manual de análises químicas de solos, plantas e fertilizantes, 2a
ed., Brasília: Embrapa Informação Tecnológica; Rio de Janeiro: Embrapa Solos, p. 112-113. taBataBai ma. 1994.Soil enzymes. In: Weaver RW, Angle
JR and Bottomley PS (Eds), Methods of soil analysis. Part 2: microbiological and biochemical properties. Madison: SSSA, p. 775-833.
traldi aB, oliveira mC, duarte kf and moraes
VMB. 2007. Avaliação de probióticos na dieta de frangos de corte criados em cama nova ou reutilizada. Rev Bras Zootec 36: 660-665.