CASE-STUDY ON PRICE SETTING OF BEER
Pedro Rui Ortins Leite
Master of Science in Business Administration
Supervisor:
Prof. Manuel Lopes da Costa, Prof. Auxiliar Convidado, ISCTE-IUL Business School, Departamento Marketing, Operações e Gestão Geral
CA
SE
-ST
U
D
Y
O
N
P
RICE
SE
T
T
IN
G
O
F
BE
E
R
P
edro
R
ui
Or
ti
n
s Le
ite
“The reward of a thing well done is to have done it.” (Ralph Waldo Emerson)
I Price is such an ordinary concept in everyday life. As a customer, price is what you pay in exchange for the value that you obtain. As a business manager, price is what drives your sales, having a direct impact in profitability. In the current economic context, creating an effective price-setting approach could represent an important tool to strengthen the business.
Beer represents a globally appreciated product, which is particularly interesting in what concerns with pricing. Being placed in several differentiated markets, and not having a specific moment of consumption, beer is a good example of a product that do not have a standard price. Consequently, the price-setting process in beer market is complex, taking into account the large number of sellers (retailers).
The study was focused on Sociedade Central de Cervejas, more specifically on Sagres beer brand. A complete analysis of the Portuguese beer market was carried out, enhancing the competitive oligopoly in the industry (SCC vs. Unicer), presenting the recent evolution of the market, and characterizing the different market segments.
Therefore, analysing the on-trade sector average retail prices charged in Lisbon, and comparing with consumers‟ perception about the beer price, the goal of this study was to understand the price-setting approaches and the most common pricing strategies adopted by points of sale.
Key words: Pricing, Beer Market, Segmentation, Strategy.
JEL Classification System:
M10 – Business Administration General M20 – Business Economics General
II
R
ESUMOO preço é um termo muito comum no dia-a-dia. Na perspetiva do cliente, o preço representa o que se paga, em troca da obtenção de valor. Na perspetiva de um gestor de empresas, o preço é o que impulsiona as vendas, tendo impacto direto na rentabilidade. No atual contexto económico, adotar estratégias de preço eficazes pode representar uma ferramenta importante para fortalecer o negócio.
A cerveja é um produto globalmente muito apreciado, que é particularmente interessante no que respeita ao pricing. Estando presente em diversos mercados, e não tendo um momento de consumo específico, a cerveja é um bom exemplo de produtos que não têm o preço uniformizado. Consequentemente, o processo de criação de preço no mercado da cerveja é complexo, tendo em conta o elevado número de vendedores (retalhistas).
O estudo foi desenvolvido com a colaboração da Sociedade Central de Cervejas, utilizando a marca Sagres como objeto de estudo. Foi levada a cabo uma análise completa do mercado de cerveja em Portugal, realçando a concorrência “oligopolísta” na indústria (SCC vs. Unicer), apresentando a evolução recente do mercado, e caracterizando os diferentes segmentos de mercado.
Dessa forma, analisando os preços médios de venda ao público, praticados em Lisboa no sector on-trade (HORECA), e comparando com a perceção dos consumidores sobre o preço da cerveja, o objetivo deste estudo centra-se na compreensão dos processos de criação de preço e das estratégias de preço mais utilizadas, nos pontos de venda.
Key words: Pricing, Mercado da Cerveja, Segmentação, Estratégia.
JEL Classification System:
M10 – Business Administration General M20 – Business Economics General
III The completion of this study represents the end of my academic background. I would like to express my gratitude to those who have contributed to the culmination of this remarkable phase of my life:
My family and friends, especially to my parents, that provided me the financial conditions and moral support during my academic experience.
All my professors and colleagues in ISCTE-IUL, especially the group of friends who accompanied me throughout the last five years.
In respect to this study, I would like to highlight the importance of:
Professor Manuel Lopes da Costa, for the orientation, knowledge, expertise, networking and friendship expressed during this challenge.
Sociedade Central de Cervejas, for the vital support in terms of information and documentation. A sincere word of gratitude to Dr. Pedro Duarte, for spending a couple of hours of his full agenda, that made a huge contribution to this study. Also, an infinite thanks to my friend João Cardoso, and all his SCC colleagues, that gave me all the support asked.
All my interviewees, for the availability and kindness in receiving me in their establishments.
Professor José Maria Duarte, for his critical view and total availability.
All the respondents of the online questionnaire conducted.
Caixa Geral de Depósitos, my current employer, for the valuable insights that professional experience gave me. And also a word to my working team, for their support and care.
At last, but not least, my friends and family, especially my girlfriend, for the enthusiasm and support given during the last few months.
Any others, that might have contributed directly or indirectly to the success of this study.IV
T
ABLE OFC
ONTENTS 1. Introduction ... 1 1.1 Starting Point ... 1 1.2 Study Guidelines ... 2 2. The Case-Study ... 32.1 Problem Identification - Price-setting of beer ... 3
2.2 Beer Industry in Portugal ... 4
2.2.1 Market Structure ... 4
2.2.2 Sociedade Central de Cervejas - Sagres ... 8
Timeline – Sociedade Central de Cervejas, SA ... 8
Portfolio ... 9
2.3 The beer market ... 10
2.4 Market Segmentation ... 12
2.4.1 SCC Client Segmentation ... 13
2.4.2 On-trade Market Segments ... 14
i. Premium Bars & Clubs ... 14
ii. Standard Bars & Clubs ... 15
iii. Premium Restaurants ... 15
iv. Standard Restaurants ... 16
v. Seafood & Beer Houses ... 16
vi. Cafes & Snacks ... 17
2.5 Pricing Process ... 18 2.5.1 Pricing Strategies ... 19 2.6. Problem Review ... 21 3. Literature Review ... 22 3.1 Market Structure ... 22 3.2 Consumer Behaviour ... 27
V
3.3 Price Setting Process ... 30
3.3.1 Pricing Concept ... 30
3.3.2 Strategic view ... 31
3.3.3 Price Elasticity of Demand ... 32
3.3.4 Price Discrimination ... 33
3.3.5. Reference Price ... 34
3.3.6. Pricing Strategies ... 35
3.4 The Beer Market ... 38
4. Pedagogical Note ... 39
4.1. Target Audience ... 39
4.2. Objectives ... 39
4.3 Methodology ... 40
4.3.1 Case Study Approach ... 40
4.3.2 Data Collection ... 41
4.4 Analytical Tools ... 42
4.4.1 Quantitative Information ... 42
4.4.2 Qualitative Information ... 43
4.5 Case Resolution – Data Analysis... 44
4.5.1 Analysis of Observed Prices ... 44
Description of the Sampling Universe ... 45
Data base Analysis ... 48
4.5.2 Analysis of Price-Setting Processes and Strategies ... 51
Pricing: The industry point of view ... 51
Premium Bars & Clubs ... 52
Standard Bars & Clubs ... 53
VI
Standard Restaurants ... 55
Seafood & Beer Houses ... 56
Cafes & Snacks ... 57
4.5.3 Analysis of consumers‟ perception about prices ... 59
Sample Description ... 60
Questionnaire Analysis ... 62
4.5.4 Case Resolution Analysis - Slide ... 65
5. Findings and Recommendations ... 66
5.1 Findings ... 66
5.2 Recommendations ... 69
5.3 Limitations and further research suggestions ... 71
6. Bibliography ... 72
Books ... 72
Scientific works and articles ... 72
Electronic Documents... 74
7. Appendices ... 75
7.1. Appendix 1 - Determinants of Global Beer Consumption ... 75
7.2. Appendix 2 – Market shares evolution 2003 – 2009 (Sagres vs. SuperBock) 75 7.3. Appendix 3 - Online questionnaire ... 76
7.4. Appendix 4 - Interview Guide ... 82
VII
Figure 1 - Sagres logo ... 8
Figure 2 - Heineken logo ... 8
Figure 3 - SCC beer portfolio ... 9
Figure 4 - Beer industry supply chain – Sociedade Central de Cervejas ... 10
Figure 5 - Sociedade Central de Cervejas - Market segmentation ... 13
Figure 6 - Beer on-trade market segments identified. ... 14
Figure 7 - The Prisoner‟s Dilemma illustration ... 25
Figure 8 - The hot dog vendor location problem illustration ... 26
Figure 9 - Seth‟s integrative model of consumer behaviour. ... 29
Figure 10 - The positioning, differentiation and branding triangle ... 31
Figure 11 - Tellis‟ taxonomy of pricing strategies. ... 35
L
IST OFG
RAPHS Graph 1 - Total volume market shares (in percentage) evolution Jun12-Jun13 (SCC vs. UNICER) ... 5Graph 2 - Year to date volume market shares (in percentage) in Jun12 and Jun13 (SCC vs. UNICER) ... 6
Graph 3 - Year to date on-trade volume market shares (in percentage) in Jun12 and Jun13 ... 6
Graph 4 – On-trade Volume Market Shares (in percentage) Jun12-Jun-13 (Sagres vs. SuperBock) ... 7
Graph 5 – On-trade geographic areas – Vol. market shares Jun12-Jun13 (Sagres vs. SuperBock) ... 7
Graph 6 – On-trade points of sale annual evolution (2010 - 2012) ... 11
Graph 7 - Portuguese consumption level evolution (2010 – 2012) ... 12
Graph 8 – On-trade points of sale in Portugal – geographic distribution (Dec-12) ... 45
Graph 9 – Sample description: Age group ... 60
Graph 10 – Sample description: Gender... 61
VIII
L
IST OFT
ABLESTable 1 - SCC monthly business volume evolution Jan12 - Aug.13 ... 10
Table 2 - Retail prices – on-trade market segments examples. ... 21
Table 3 - Five-stage model of consumer behaviour. ... 28
Table 4 – SCC clients in Lisbon – distribution by market segment ... 46
Table 5 – Total points of sale in Lisbon – distribution by market segment (approach). 46 Table 6 – Points of sale in Lisbon – representativeness of the sample ... 47
Table 7 – Beer prices analysis overview ... 48
Table 8 – Number of observations distributed by beer brand ... 49
Table 9 – Online questionnaire – List of selected points of sale. ... 59
Table 10- Beer consumers price perception analysis – Reliability coefficient ... 63
1
1.1 Starting Point
Over the years, it has been a proven fact that personal experiences and purposes affect the way of evaluating. When facing purchasing decisions, individuals usually give much importance to the price/quality factor.
The perspective of Expected Value vs. Value Obtained by the customer was one of the key drivers of this study, since it illustrates customers‟ degree of satisfaction with a product or service:
a. On one hand, customers do not like to pay for a bad experience. When the value obtained is lower than the value paid or expected, the customer will probably not repeat the purchase.
b. On the opposite perspective, customers do not mind of paying more for quality. If the value obtained is in concordance with the price paid, than the customer will be satisfied and interpret the price as “fair”.
In business, delivering value to the customer is essential but the fact is that the main concern of firms is maximizing profits. One interesting approach in terms of profit maximization is to charge individually the price that each customer is willing to pay for a product.
In respect to pricing, the reality displays several products that are sold at different prices. This is particularly evident in mass market products, such as food or drinks – even referring to the same product (and the same brand) it is possible to find different prices, in different retailers (also called as points of sale throughout the study). This phenomenon guides us to two interesting views:
i. How customers feel about different prices for the same product. ii. The process of price setting undertaken by firms.
2
1.2 Study Guidelines
This case study in price setting focused on one product especially popular in Portugal:
Beer. Besides the social dimension, beer industry has also a significant impact on the
Portuguese economy.
The geographic scope of the case-study is the Lisbon district, focusing in Lisbon city. This choice was motivated by three reasons:
i. Pricing - Lisbon, as the biggest urban centre in Portugal, is probably the place where the dynamics of pricing are better developed and explored.
ii. Beer Market – Lisbon is the city with the biggest business volume of beer in Portugal – representing one of the most important markets in the beer industry. iii. University and Residence – ISCTE-IUL facilities as well as the residence of
the author are located in Lisbon. The proximity to the study area allowed a higher involvement.
The specific products selected as the comparative examples of the study were: 0,20l bottled beer (known in Portugal as “mini”) and 0,20l draught beer (known in Portugal as “imperial”), in the on-trade1
business sector (known in Portugal as “HORECA” channel).
This study was developed in cooperation with Sociedade Central de Cervejas, SA., Portuguese firm that manages the brands Sagres and Heineken in Portugal.
1
The on-trade sector includes typically Restaurants, Clubs, Bars or Snacks & Cafes, while the off-trade sector refers to retailers such as supermarkets.
3
2.1 Problem Identification - Price-setting of beer
Pricing is the process of determining how much a company will receive in exchange for its products. It is not by chance that firms invest in resources, infrastructures and human capital to build their pricing strategies. The price is effectively a very powerful tool, since it is the most important factor in determining profit.
It is accepted by common sense that setting prices is an easy and reversible process, and new technologies have been only reinforcing this way of thinking. The problem with typical assumptions as of “reducing prices and discounting are mere tactics” is that these strategies might have a critical impact not only on the profitability but also on the image of the firm.
In the beer industry, where the sale to the final consumer is made almost totally by small and medium businesses, most of the points of sale do not have the resources to invest in “pricing capabilities”. Nevertheless, business managers must make an effort to define a grounded pricing policy / strategy.
How much does a beer cost?
Beer is a mass market product that is included on the category of fast moving consumer goods (FMCG). The distinctive feature of this type of goods, also known as consumer packaged goods, is that they are everyday consumption products, which are traded and need to be replaced very frequently. Besides that, beer, as a beverage industry product, has no specific consumption moments or locations.
Those characteristics make the product available in a wide set of points of sale, including retailers (off trade market), restaurants, hotels, nightlife establishments, etc. The particularity of beverage products, and specifically beer, unlike other products, is that the same branded product is sold at different prices, since each point of sale is individually responsible for setting the final price.
At a first sight, it looks like quite understandable that different businesses promote different prices. However, taking a deep view, one can see that even within the same market segment, beer prices are very volatile. This perspective enhances that the real
4 challenge is not finding a price for beet, but rather understanding the price setting process of firms. So, the restating the question:
Why can we find different prices for the same branded product?
In response to the research question, the case-study focuses on retail prices charged by on-trade points of sale and its pricing processes. Again, at first sight, common sense might point towards a random component in price setting – but every pricing decision should be supported by internal or external factors that influence price.
2.2 Beer Industry in Portugal
Historically, beer has always been a very popular product all over the world, earning though more relevance in recent decades. At a global level, the determinants of world beer consumption have been growing strongly – by 2005 the estimated volume of beer points towards a total of 153 billion litres, expressing a volume more than six times larger than wine consumption (Appendix 1).
In Portugal, there is a cultural connection to beer, not only because it is a product much appreciated at a social level, but also because beer industry represents a relatively important business in the Portuguese economy. According to the APCV – Associação Portuguesa dos Produtores de Cerveja (Portuguese Beer Producers Association), currently the beer sector generates an added value of EUR 1.100 billion per year. In addition, Portuguese beer industry contributes positively to the balance of trade, since about 30% of total production is exported, as well as stimulates the national economy by acquiring about 80% of all raw-materials and packages of the production process in Portugal.
2.2.1 Market Structure
Nowadays, the Portuguese beer industry is marked by market concentration, where two big players have been prominent:
Sociedade Central de Cervejas e Bebidas, SA (hereinafter also SCC)
5 share over the last years. Currently, the rivalry between the two firms that control the Portuguese beer market is so intense that sometimes is overemphasized by media, being compared to an authentic “war”. Actually, since both firms were formed more a less at the same time, and taking into account that SCC is from Lisbon (South) and Unicer was created in Porto (North), it is noticeable that the market structure is not the only reason that sustains the rivalry.
Since the beginning of 2000‟s, SCC and Unicer have been competing aggressively for the market leadership. Unicer was historically the market leader, but became losing advantage over the last years. Despite the intense competition, the fact is that market shares have been suffering only slight variations lately and market leadership have been disputed and shared by the two competitors month after month. Graph 1 demonstrates the equilibrium verified on the evolution of monthly volume market shares between June 2012 and June 2013, while Graph 2 demonstrates that SCC was the year-to-date market leader in June 2012, but Unicer has taken back the leadership in the last June 2013.
Graph 1 - Total volume market shares (in percentage) evolution Jun12-Jun13 (SCC vs. UNICER)
6
Graph 2 - Year to date volume market shares (in percentage) in Jun12 and Jun13 (SCC vs. UNICER)
Source: Nielsen, June 2013
Focusing on the on-trade market, Graph 3 reveals that SCC is still the market leader (with exactly 50% of market share in June 2013) but have lost 1 p.p. in market share, in opposition to the recoup of Unicer, that results into an actual difference of only 0.6 p.p. between the rivals.
The beer portfolios of SCC and Unicer are composed by a set of brands. However the mainstream brands responsible for more than 90% of the overall beer business are Sagres and SuperBock, which corresponds to SCC and Unicer respectively. Therefore, also analysing the data presented on Graph 3, one sees that Sagres and SuperBock represent 92,1% of total beer market share in June 2013. Clearly, Sagres has a consolidated leadership with a year-to-date market share of 48,5% against the 43.4% of SuperBock. In effect, the evolution of monthly market shares on the period June 2012 - June 2013 demonstrates that Sagres have been continuously dominating the on-trade beer market, as shown on Graph 4.
Graph 3 - Year to date on-trade volume market shares (in percentage) in Jun12 and Jun13
7 Source: Nielsen, June 2013
Appendix 2 demonstrates the evolution of market shares between 2003 and 2008, emphasizing the moment when Sagres became the market leader in Portugal.
As stated previously, the geographic origin of the two competitors contributes to intensify the rivalry between them. As a matter of fact, that geographic rivalry is reflected on the distribution of market shares over the Portuguese territory.
Graph 5 – On-trade geographic areas – Vol. market shares Jun12-Jun13 (Sagres vs. SuperBock)
Source: Nielsen, June 2013
According to Graph 5, SuperBock dominates expressively the market on the North, especially in Porto area, having a market share of approximately 84%, whereas Sagres is the market leader in Centre and South, including the two biggest areas in terms of volume: Lisbon (Lisboa - 59,4% market share) and South excluding Algarve (Sul s/ Algarve - 74,8% market share). Algarve is the only area where the market is fragmented: Sagres and SuperBock have approximately 36% market share each, and other brands hold about 28% of the market.
8
2.2.2 Sociedade Central de Cervejas - Sagres
Although SCC and Unicer are currently in equilibrium at the leadership on the beer market, the brand Sagres is leading the on-trade Portuguese market, having a superior performance than the rival SuperBock.
Especially in Lisbon area, where this study is laying emphasis on, Sagres holds about 60% of the market, according to the data presented in the previous chapter. Taking also in consideration that SCC is located in Lisbon, the brand Sagres gathered all the conditions to be the case study‟s object.
Timeline – Sociedade Central de Cervejas, SA
1934 - Sociedade Central de Cervejas (SCC) is born, as a result of the association of 4
different breweries.
Figure 1 - Sagres logo
1940 – The beer brand SAGRES is created, as a “prestigium” beer, to represent SCC at Exposição do Mundo Português.
1941 – The brand IMPERIAL is created by SCC, releasing a name that is now associated to
draught beer at a national level.
1960 - SCC acquires the brand LUSO, the older Portuguese mineral water.
1968 - The biggest beer production factory in Portugal (Fábrica de Vialonga) starts working,
ensuring full coverage of internal and external markets.
1977 - As a result of a beer industry restructuration process, SCC and Cergal are incorporated
on Centralcer – Central de Cervejas EP.
1990 - The firms‟ capital is 100% privatized. The group Bavaria acquires a participation on the
capital of Centralcer, becoming one of the most important shareholders.
1996 - SCC starts commercializing the brand BUDWEISER.
2001 - The group of societies that holds Central de Cervejas is restructured, resulting into a
merging firm called SCC - Sociedade Central de Cervejas, SA.
2003 – Scottish & Newcastle group acquire 100% of SCC equity.
Figure 2 - Heineken logo
2008 - As a result of the acquisition negotiation of Scottish & Newcastle, Heineken took the
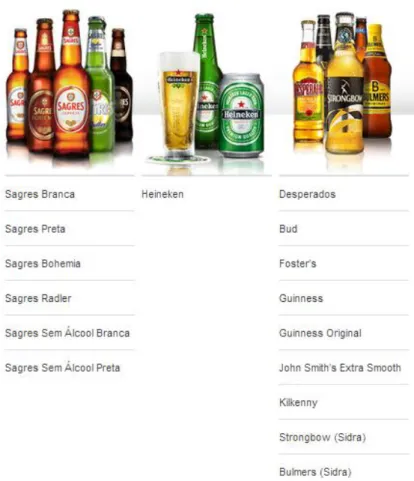
9 The beer portfolio of SCC includes several brands, both international and national as the following figure suggests:
Figure 3 - SCC beer portfolio
Source: SCC website: www.centralcervejas.pt/pt/marcas-produtos.aspx
Even with several notorious brands in its beer portfolio, such as Desperados or Guinness, the fact is that the most important brand in the Portuguese market is Sagres. The quality of Sagres beer is valued by Portuguese consumers, so that the national brand represents about 90% of total business volume. Since Heineken group acquired SCC, the beer brand Heineken is also earning some relevance in the Portuguese market, being implemented as the premium beer of the portfolio.
In SCC‟s perspective, those two brands are now the most important when it comes to the on-trade market sector.
10
2.3 The beer market
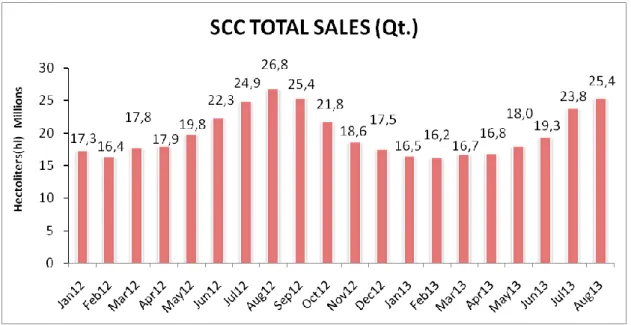
Beer industry assumes other specific feature concerning business volume: seasonality. Usually cold temperature products are more attractive during warm seasons, and beer is not an exception.
Table 1 - SCC monthly business volume evolution Jan12 - Aug.13
Source: Sociedade Central de Cervejas
Analysing the variations on SCC‟s business volume, presented on Table 1, it is easy to identify that there is a boost on sales verified between June and September – caused by the summer and the high temperatures that come with it.
The effect of seasonality is pushed by final consumers throughout the supply chain. It is the final consumer that finds the product more or less attractive depending on the climate conditions.
Figure 4 - Beer industry supply chain – Sociedade Central de Cervejas
Source: the author
So far, the analysis of beer industry has been focusing on the relationship between SCC and its clients, conceptually the Manufacturer and the Retailers & Points of Sale.
11 last flow of the supply chain (between Retailers & Points of Sale and Consumers), presented in Figure 4, two markets are identified:
I. On-trade: includes all the retailers (or points of sale), in which the product sold is consumed immediately – the purchase moment coincides with the consumption.
The most common are Restaurants, Clubs, Bars or Snacks & Cafes.
II. Off-trade: refers to retailing where the product sold is consumed afterwards, outside the store – only the purchase moment take place in the retailer. Distribution centres, such as hypermarkets and supermarkets represent the best off-trade examples.
The on-trade market, the focal point of the study, is characterized by vast fragmentation, especially in the beer industry. In Portugal, this market has about 100.000 points of sale, however, according to the following Graph 6, it has been observed a sharp decrease in recent years (more than 10.000 points of sale have closed since 2010).
Graph 6 – On-trade points of sale annual evolution (2010 - 2012)
12
Graph 7 - Portuguese consumption level evolution (2010 – 2012)
Source: Sociedade Central de Cervejas - Nielsen, 2013.
As a result of the deep economic crisis lived in Portugal, not only the number of points of sale have been falling, but also the consumption level follows the same tendency, as suggested by Graph 7.
The large number of points of sale in the market, even with the recent decrease tendency, would induce towards a highly competitive market. In contrast, this market is composed by several differentiated businesses, which are not direct competitors.
2.4 Market Segmentation
Nowadays, goods and services can no longer be produced and sold without considering customer needs and recognizing the heterogeneity of those needs among consumers. Since people have different tastes and preferences, the concept of market segmentation emerges as an essential element of the marketing-mix, especially in mass market products such as beer.
Market segmentation is a concept that involves grouping consumers in order to design and target more effectively the strategies. In this context, the selection of appropriate segmentation criteria and bases assumes critical importance.
The segmentation at the on-trade beer market is based typically on the type of business, where one can identify three main market segments:
III. Nightlife Establishments – dedicated mainly to drinking consumption and
night entertainment.
IV. Restaurants – dedicated to complete meals service.
13 Sociedade Central de Cervejas currently applies two main criteria in terms of market segmentation:
i. Drinks (Potential) Business Value per year
Gold ( > EUR 24.500)
Silver Superior ( > EUR 13.800 and < EUR 24.500) Silver Medium ( > EUR 7.500 and < EUR 13.800) Silver Inferior ( > EUR 3.250 and < EUR 7.500) Bronze ( < EUR 3.250)
ii. Type of Business
Moment of Consumption Main Objective
Level of Price (premium vs. standard)
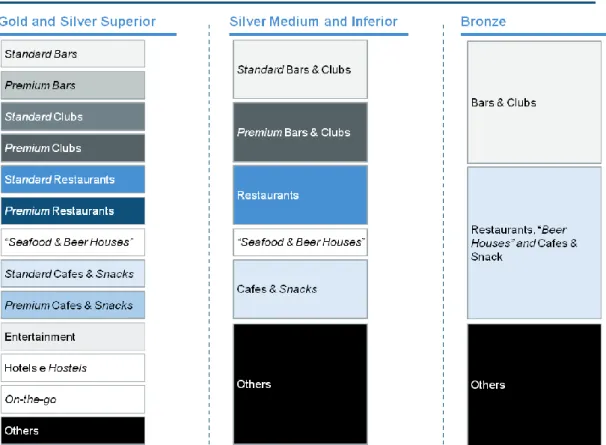
Figure 5 - Sociedade Central de Cervejas - Market segmentation
14
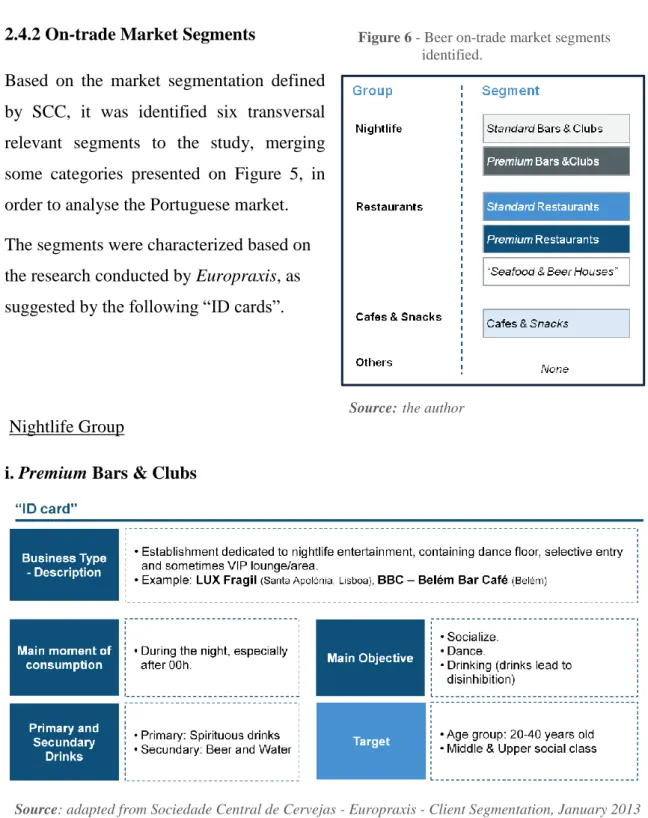
Figure 6 - Beer on-trade market segments identified.
As suggested by Figure 5, the first criterion identifies the group of clients strategically attractive to SCC, while the granularity of the second criterion depends on the first one. The Gold and Silver Superior clients, the most attractive segment, are divided into 13 sub-segments, while Silver Medium and Inferior clients are divided into 6, and Bronze only into 3 groups.
2.4.2 On-trade Market Segments
Based on the market segmentation defined by SCC, it was identified six transversal relevant segments to the study, merging some categories presented on Figure 5, in order to analyse the Portuguese market. The segments were characterized based on the research conducted by Europraxis, as suggested by the following “ID cards”.
Nightlife Group
i. Premium Bars & Clubs
Source: adapted from Sociedade Central de Cervejas - Europraxis - Client Segmentation, January 2013 Source: the author
15
ii. Standard Bars & Clubs
Source: adapted from Sociedade Central de Cervejas - Europraxis - Client Segmentation, January 2013
Restaurants Group
iii. Premium Restaurants
16
iv. Standard Restaurants
Source: adapted from Sociedade Central de Cervejas - Europraxis - Client Segmentation, January 2013
v. Seafood & Beer Houses
17 Cafes & Snacks Group
vi. Cafes & Snacks
Source: adapted from Sociedade Central de Cervejas - Europraxis - Client Segmentation, January 2013
Others
The points of sale that do not fit any of the presented market segments were gathered in a single group: Others – that was not included in the study since, according to SCC, represents a residual share of the market.
The categories that were included in this group, taking as reference the SCC client segmentation (Figure 5 presented on page 13) includes: Hotels & Similar, Entertainment (Festivals, Cultural Associations, Sports Clubs/Associations), On-the-go (itinerant sales, kiosks) and Others (Grocery Stores, Fast-food, Events, etc.).
The two most relevant categories, in terms of business volume – naming Sports Clubs/Associations and On-the-go – were included in the study, in the Cafes & Snacks segment, since the business features of those categories are very similar to this segment.
18
2.5 Pricing Process
Unlike the off-trade market, where the price charged in supermarkets and other distribution stores is negotiated between SCC and the retailer, the process of price-setting in the on-trade beer market is split into two moments: (1) wholesale price - the price negotiated for the transaction between SCC and the point of sale (cost of the product, in the perspective of the latter) and (2) retail price - the price set to the final consumer, executed by the point-of-sale.
In this context, mainly due to the intense fragmentation of the market and to the small size of firms in the last stage of the supply chain (Retailers & Points of Sale), there are no relevant investments in pricing processes and capabilities. Therefore, one can identify three transversal price setting drivers, in the beer market:
(i) Cost oriented pricing – the price is set based on costs. The most common procedure at this level is to add a markup2 to the total or direct cost of the product.
(ii) Competition oriented pricing – the price is set taking into account to the average price level of the industry/market. Firms observe and compare the prices and/or strategies of competitors, and then implement its pricing strategy accordingly.
(iii)Customer oriented pricing - Firms must have a very well defined strategy, focusing on their target. The features associated to the product/service are oriented to the customer, aiming to create value to them. The price is set according to the value delivered to the customer.
In respect to beer market, the price-setting drivers differ from segment to segment. In fact, the price-setting process is an individual practise of each firm, that depends on its strategy, which means that even competitors within the same market segment might be guided by different price-setting drivers.
2
Mark-up - concept widely used in business that intend to the gross commercial margin (in percentage) applied to the cost of the product in order to determine the sale price.
19 Taking in consideration the three price-setting drivers defined above, one can see that for the Cost-oriented Pricing (i) and for the Competitive-oriented Pricing (ii) there are clear implicit strategies defined, named by the author as:
Markup strategy (i) – adding a percentage or a fixed amount to the cost and set
the retail price.
Comparative strategy (ii) – through a benchmarking process, the firm set the
price in line with the average price level of the competition or in response to a specific competitor price / strategy.
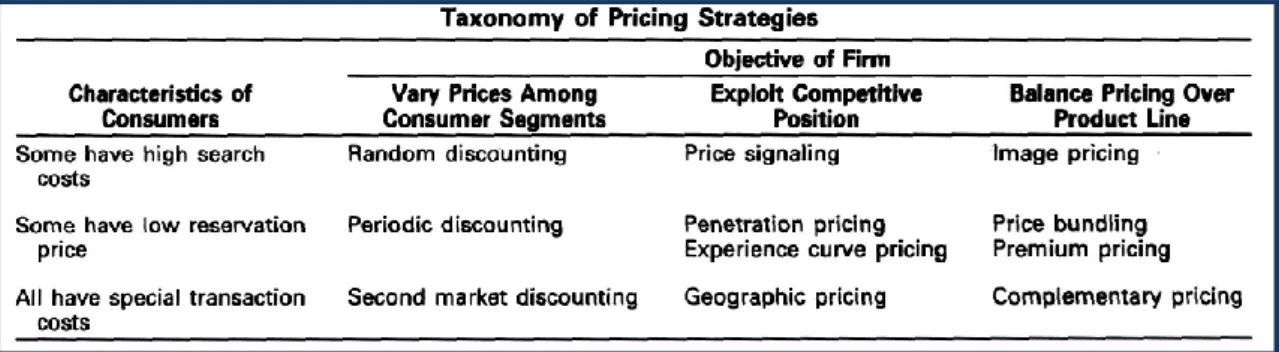
On the other hand the Customer-oriented Pricing does not have a single defined strategy. Actually, there are several ways of delivering value to the customer, and several correspondent strategies. In this regard, the most evident pricing strategies are highlighted:
Premium Pricing - charging a premium (higher) price when the product
delivers extra value to the customer. The value added is usually provided by (certified or perceived) distinctive quality of the products, investments in differentiation (providing special features) or extras, such as the quality of the service/employees for instance.
Image Pricing - similar to the premium pricing concept, in which the firm
charges a premium price for a superior product. In this case, the value of the product is focused on image and branding.
“Low-cost” strategy – the value delivered to customer is represented in savings.
Setting (one of) the lowest price(s) of the market is a customer focused pricing process, based on the strategy and positioning of the firm.
Price penetration is assumed to be included in this strategy, since the only
difference is that in price penetration the firm aims to raise the price as soon as it gets volume market share, while the low-cost keeps a stable price.
Besides strategic pricing processes, firms face also big challenges to attract demand. Actually, in the beer market the phenomenon of seasonality has a significant impact on the business for many points of sale, as well as other occasional events that tend to
20 move customers to other areas. In order to fight those situations, and also aiming to explore the discrimination of prices, firms develop “promotional” pricing strategies. The main goal is to attract customers from many market segments, trying somehow to charge different prices.
Discounting
Random Discounting – aiming to arouse customers‟ willingness, the firm
applies random discounts to fight specific/occasional moments.
Periodic Discounting - the firm applies a discount, usually in pre-determined
periods of low demand, in order to attract customers. It can be also interpreted as a kind of 'low-cost' strategy.
Complex / Complementary Pricing Strategies
Price Bundling - bundling two or more products and sell them as a package.
This strategy allows customers to save money buying the package, instead of buying the products separately.
Captive pricing - reducing the price of a product (usually the most-popular
product), as a way to attract more customers, and increasing the prices of complementary products.
Two-part pricing - adopting a strategy that charges two prices: an initial
upfront payment and then unit charges. This is particularly common when customers have to pay a “membership fee” or an “entrance fee”.
From SCC‟s point of view, as an industry price maker, there are also some relevant pricing strategies to take into account in their relation with the retailers & points of sale:
Quantity Discounts - the most common strategy in B2B trading. SCC charges
different prices, depending on the volume sold. Usually, high-volume buyers get lower prices.
Product Line Premium Pricing – in other perspective of premium pricing,
when facing a product line, with two or more substitutive products, the firm charges a premium (higher) price for one of the products. For instance, SCC sells a set of beer brands, negotiating the price differently for each brand.
21 product delivers extra value to the customer.
Geographic Pricing - charging different prices according to the geographic
area where the product is sold. In Portugal, pricing is different across cities – e.g. the prices charged in large towns are different from small rural areas.
2.6. Problem Review
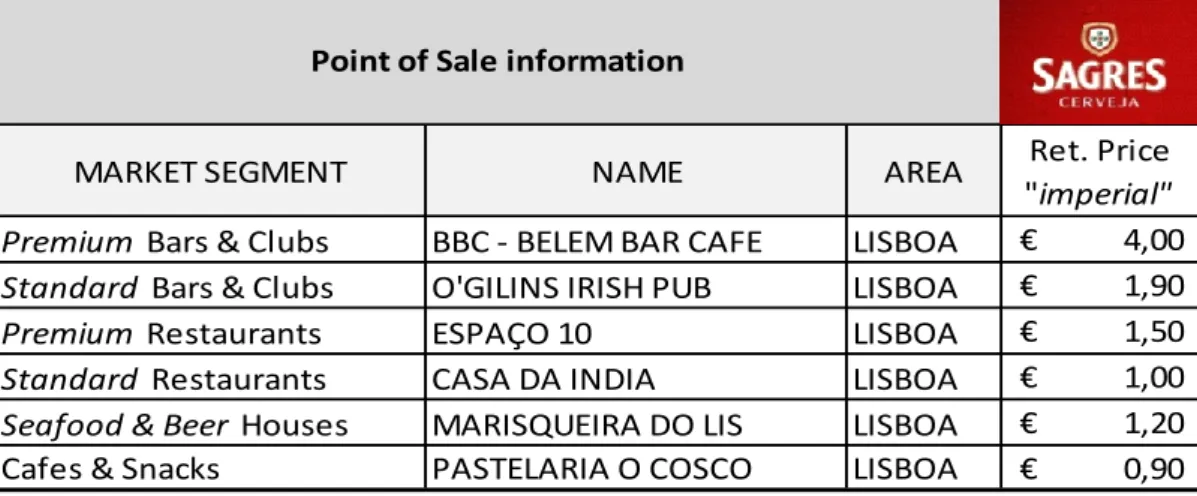
Beer, as a very popular product in Portugal, is present in “every corner” of Lisbon. The beer market is extremely fragmented, what makes the price-setting a complex process. Laying attention on a single product: “imperial” Sagres (0,20l draught beer), one realises that the price can be very volatile.
Table 2 - Retail prices – on-trade market segments examples.
MARKET SEGMENT NAME AREA Ret. Price
"imperial"
Premium Bars & Clubs BBC - BELEM BAR CAFE LISBOA € 4,00
Standard Bars & Clubs O'GILINS IRISH PUB LISBOA € 1,90
Premium Restaurants ESPAÇO 10 LISBOA € 1,50
Standard Restaurants CASA DA INDIA LISBOA € 1,00
Seafood & Beer Houses MARISQUEIRA DO LIS LISBOA € 1,20
Cafes & Snacks PASTELARIA O COSCO LISBOA € 0,90
Point of Sale information
Source: the author
The large number of points of sale divided by different market segments result into numerous price-setting processes that may not have a common standard. In effect, using the examples given on chapter 2.4.2 On-trade Market Segments, there are several points of sale with different prices, as suggested by Table 2.
Re-addressing the question presented on chapter 2.1 - How much does a beer cost? – it is easy to state that there is no right answer. At this point, it is clear that beer does not have a single retail price. The challenge is set to understand price-setting processes developed in the beer market in order to identify the factors that fundament retail price differences.
22
3. L
ITERATURER
EVIEW3.1 Market Structure
The first step to create a business is to analyse the market you want to enter. Therefore, before formulating strategic goals or producing any kind of marketing plan, it is required to study the market – by identifying the players, determining the level of market concentration, the potential of growth and taking in consideration the most important stakeholders.
Robert Frank (2010)3 states that “...the economic theory assumes firms‟ primary goal is to maximize profits...” no matter what market structure. However, the way firms operate in order to obtain value depends on the type of the market. The same author (Robert Frank, 2010), provides an approach of markets under four different forms of structure:
Perfect Competition – few product markets fully satisfy the conditions required for perfect competition (markets for agricultural products come close). The four conditions that support the theory of perfect competition are: (1.) Firms sell a standardized product, in terms of quality and style – meaning that a product sold by one company is assumed to be a perfect substitute for a product sold by any of the competitors. (2.) Firms are price takers - the market price is given and, as a rule, is not affected by the output produced by a single firm individually. This condition holds because perfect competition markets are extremely fragmented, where each firm produces a negligible fraction of total industry output. (3.) Free entry and exit, with perfectly mobile factors of production in the long run – there are no barriers to enter or quit the market. One implication of this condition is that if a firm perceives a profitable business opportunity at a given time and location, it will be able to acquire the factors of production required to take advantage of it. Similarly, if the business no longer appears attractive it is free to discharge its factors of production. (4.) Firms and consumers have perfect information – the assumption of perfect information is usually interpreted to mean that people can acquire the most of the information that is relevant to their choices without great difficulty.
The short-run equilibrium in the perfect competition market is determined by the intersection of supply and demand curves. As long as this short-run equilibrium
3
Robert Frank, in his book Microeconomics and Behavior, first edited in 1991, and last edited (8th edition) in 2010., pg.261.
23 the market will be attractive for new competitors. Consequently, the entry of new firms keeps occurring until the equilibrium price adjusts towards the average total cost per unit, so that the economic profits of all firms are equal to zero.
Monopoly – the market structure in which a single seller of a product with no close substitutes serves the entire market. The key feature that differentiates the monopoly structure from the competitive is the price elasticity of demand. For perfectly competitive firms, a slight increase of price would cause a total loss on sales (in quantity) because consumers can buy the „same product‟ to a competitor. A monopoly, by contrast, has significant control over the price, since buyers have no other choice. “Economists discuss five factors, any one or combination of which can enable a firm to become a monopoly...” (Robert Frank, 2010):
Exclusive control over important inputs – managing key inputs of a product might lead to control position that promotes uniqueness to that product. However the exclusive control of key inputs is not a guarantee of permanent monopolistic power – this is true as long as consumers perceive value on those characteristics.
Economies of scale – occurs when the average cost curve is downward sloping, so that the most efficient (least costly) way of serving the market is to concentrate production in a single firm.
Patents – inventions that promote innovation and create business opportunities can be protected using the patent system: conferring the exclusive right to benefit from all exchanges involving the invention. The protection from competition afforded by a patent is what makes possible for firms to invest in Research & Development, however, in order to recoup the investment, usually firms set high prices.
Network Economics – a product becomes more valuable as greater the number of consumers use it. In extreme cases, such network works as a source of natural monopoly. (Microsoft Windows operating system and the social network Facebook are the best examples.)
Government Licenses or Franchises – in some cases, it is defined by law the composition of the market. In many markets, only government-licensed firms
24 are allowed to do business. The reasons behind such laws might be social, political or even economic, but the point is that monopolistic markets are generated.
The profit maximization in monopoly is dependent on the consumers‟ price-sensitivity. Once there is only one player concentrating all the demand, the firm might charge the highest price that the buyer is willing to pay, thus maximizing profit. So the equilibrium profit-maximizing output level for a monopolist occurs when the marginal revenue is exactly equal to the cost of expanding (marginal cost).
Imperfect Competition – in the monopoly and perfect competition markets the
economic environment is essentially passive. Both markets represent idealized forms, since firms were assumed to ignore the actions of other players.
The imperfect competition perspective assumes that the payoff to an action often depends not only on the action itself, but also on how it relates to others stakeholders in the same environment.
Oligopoly – the characteristic feature of oligopolistic markets is the interdependence among firms. It refers to a market with few players that interact among themselves. Firms should take into account the reaction by competitors when deciding to change price.
The interaction among oligopolistic firms is often analyzed using the Theory of Games mathematical framework, developed by John von Neumann and Oskar Morgenstern in 1944. The most popular example in the field of game theory is the Prisoner‟s Dilemma, devised by Merrill Flood and Melvin Dresher and illustrated in the payoffs version by Rand Tucker, in 19504, as a result of Rand Corporation's investigations:
Suppose that two prisoners are held in separate cells committing a felony, but the evidence is weak. The police need the confession of at least one of the prisoners in order to get a felony conviction. If neither prisoner confesses, then the police can only convict them on a minor charge with a year prison term. Each prisoner is told that if one testifies against the other while the other remains silent, the confessor will go scot-free while the other will go to jail for 20 years. If both confess, then each will receive a five-year jail term.
25 Source: Encyclopædia Britannica, Inc., 2006
In the same context, at an oligopoly model, firms might face situations where the opponent strategy influences the firm‟s strategy. A strategy is called dominant if it produces a better result for the firm no matter what strategy the other player chooses. John F. Nash (1951)5 introduced the equilibrium concept in game theory (known as Nash equilibrium) – it occurs when both players have a dominant strategy so that it will lead to a specific combination. At a Nash equilibrium neither player has any incentive to deviate from its current strategy. In the prisoners‟ dilemma the dominant strategy for both players is to confess, creating thus a Nash equilibrium on the last scenario: both receive a five-year jail term.
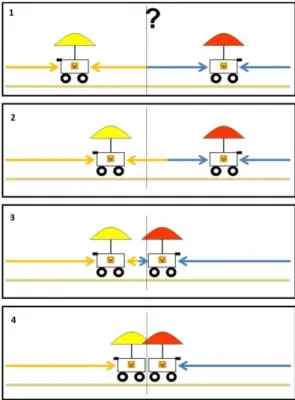
Other perspective that is evidenced by Robert Frank (2010) is the competition in oligopoly markets. The author assesses “the hot dog vendor location problem”, demonstrating the negative results of intense competition:
Two hot dog vendors are free to position themselves along a one mile stretch of beach. The best combination would be: each vendor supplies 1/2 of the beach, being positioned right in the middle of the half to reduce the distance to customers (1). However if one vendor move towards the other (2), he will get closer to part of competitor‟s consumers. So, in response, the other vendor will also move towards the first (3) in order to get back the consumers lost. As a result they will end up side by side (4), creating intense competition that might
26 lead to price decrease, and also increasing the average distance to consumers – risk of losing demand.
Figure 8 - The hot dog vendor location problem illustration
Source: adapted from Universitat Autònoma de Barcelona, Analisis Industrial y Estrategias Competitivas course slides (2011/1012)
To sum up, there are three basic elements of game theory: the players, the set of possible strategies and the payoff matrix. The oligopoly market has a particular feature concerning competition: under normal conditions intense rivalry causes losses for both players. There is a tendency towards collusion in this market structure however the incentives facing firms who attempt to collude are similar to prisoner‟s dilemma: the dominant strategy is to cheat on the agreement.
Monopolistic Competition – in terms of structure, the main difference to an oligopoly is that the monopolistic competitive market is fragmented, having many players that compete against each other and have some market power. Monopolistic competition is actually close to perfect competition because (1) there are many firms serving the market and (2) it is a free entry and exit market. However the main difference is that firms‟ products are not perfect substitutes so that firms are allowed to charge different prices (none are price takers).
27 competition: He refers that “one concrete way of thinking about lack of complete substitutability is distance. Gasoline sold across town is not a perfect substitute for gasoline sold at the nearest corner, especially when your tank is nearly empty.” This new spatial approach highlights the perspective of how competitive markets can be influenced by circumstances, introducing then new variables to analyse the market. In fact, the author (Robert Frank, 2010) makes an analogy to product characteristics: “... the power of the spatial interpretation of monopolistic competition is that it can be applied not only to geographic location, but also to a variety of other product characteristics.” Considering consumer preferences, firms are able to adapt their products and charge higher prices. Roberts Frank‟s approach (2010) points out that “people are willing to pay a little extra for variety, just as they are willing to pay a little extra for a more conveniently located store”. Therefore, in the restaurant industry “... the cheapest way to provide restaurant meals would be to have a single restaurant with only one item on the menu. [...] But people don‟t want the same meal every night”. Most restaurants price different items on their menus at a lucrative mark-up, having in some cases a sort of “daily specials” that are priced very close to marginal cost. The result is that who wants to economize purchases only the basic meal, generating economies of scale on the “daily special”, whereas people who prefer a latter menu will pay for extras.
Monopolistic competition is perhaps the most common market structure, especially in mass market products like beer, which is sold in countless points of sale.
3.2 Consumer Behaviour
As mentioned above, the concept of variety is particularly important in monopolistic competition. Providing variety means looking forward to meet consumer preferences. The key to succeed is to know your customer by analysing consumers‟ decision making processes.
Several models of consumer behaviour have been developed, providing important managerial tools. However different managerial problems may require different consumer behaviour models depending on what is the study focus/goal. Lilien et al.
6
Robert Frank, in his book Microeconomics and Behavior, first edited in 1991, and last edited (8th edition) in 2010, pg.435-455.
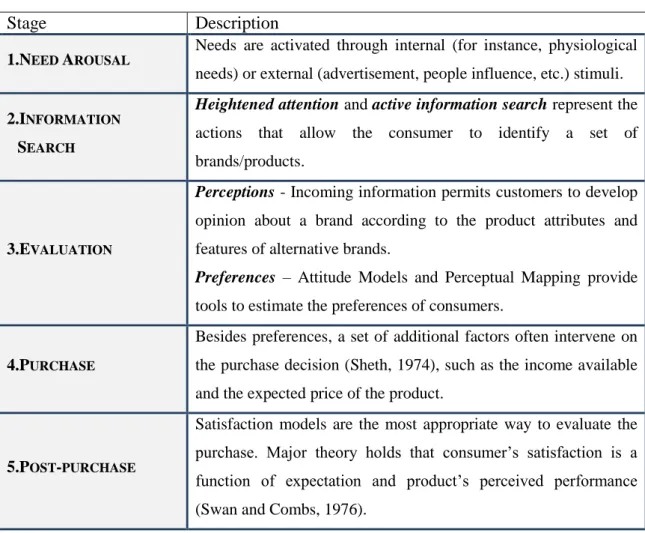
28 (1992)7 set a five-stage model of consumer behaviour, describing the consumer decision process.
Table 3 - Five-stage model of consumer behaviour.
Stage Description
1.NEED AROUSAL
Needs are activated through internal (for instance, physiological needs) or external (advertisement, people influence, etc.) stimuli.
2.INFORMATION
SEARCH
Heightened attention and active information search represent the
actions that allow the consumer to identify a set of brands/products.
3.EVALUATION
Perceptions - Incoming information permits customers to develop
opinion about a brand according to the product attributes and features of alternative brands.
Preferences – Attitude Models and Perceptual Mapping provide
tools to estimate the preferences of consumers.
4.PURCHASE
Besides preferences, a set of additional factors often intervene on the purchase decision (Sheth, 1974), such as the income available and the expected price of the product.
5.POST-PURCHASE
Satisfaction models are the most appropriate way to evaluate the purchase. Major theory holds that consumer‟s satisfaction is a function of expectation and product‟s perceived performance (Swan and Combs, 1976).
Source: adapted from Lilien,G., Kotler, P., & Moorthy,K. S., Marketing Models, 1992.
3.2.1 Consumer Purchase Decision
Focusing on the last two stages of consumer decision making process: Purchase Decision and Post-Purchase Feelings, decision theorists Kahneman and Tversky8 (1981) provide experimental demonstration on how rationality in consumer choice is bounded:
One group of people lose their $10 ticket on a way to a concert, and a second group of people arriving to the concert find that each has lost a $10 bill. Would they attend the concert, buying a ticket? In the rational choice model, the stimuli to the decision is exactly the same for both groups – losing a $10 ticket should have precisely the same effect as losing a 10$ bill. However, repeated trials
7
Gary Lilien, Philip Kotler and K.S. Moorthy, in Marketing Models, 1992, pg.19-31.
29 not buy a new ticket, while in the second group (lost bill) the overwhelming majority say they will acquire the ticket.
Robert Frank (2010) also exemplifies common pitfalls on purchases decisions, such as (1.) ignoring implicit costs, (2.) failing to ignore sunk costs, (3.) measuring costs and benefits as proportions rather than absolute amounts or (4.) failing on understanding the average-marginal distinction. As an example of pitfall 3, the author refers that buyers are most likely to find a different store “to save $10 on a $20 clock radio” rather than making the same decision to save the same amount ($10) on a $1000$ television.
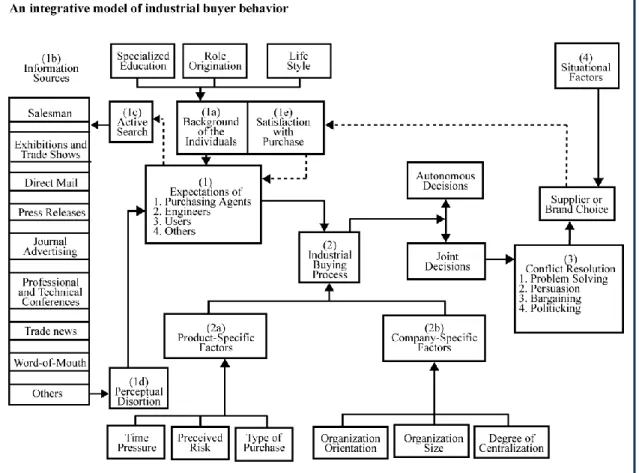
Figure 9 - Seth‟s integrative model of consumer behaviour.
Source: Lilien,G., Kotler, P., & Moorthy,K. S., in Marketing Models, 1992.
Sheth (1973)9 adapted the Howard-Sheth model of consumer buying behaviour for industrial organizations. According to the following figure, he assumes that there are three major elements in the organizational buying process:
30
Psychological factors, such as consumer preferences that create expectations;
Conditions that precipitate the decision making process related with the product/industry;
Conflict Resolution, in case of joint decisions;
And additionally situational factors that influence final choice.
Numerous examples of behaviour contradict the predictions of the standard rational choice model. Psychologists argue that such behaviour is the result of limitations in human cognitive capacity. Therefore, in business is very important to understand the whole process of consumer buying behaviour, taking into account both the rational consumer choice model as the other factors that influence decision making factors.
3.3 Price Setting Process 3.3.1 Pricing Concept
The price is at the outset a very significant determinant in business. Firstly, it represents the financial dimension of a product – the prices charged allow us to measure the return and the profitability of a product, a business and an entire company. However the financial dimension does not end at the price itself, it is necessary to fully understand the whole pricing process.
The concept of pricing can be accessed through two basic approaches: strategic and economic. The microeconomic view of pricing explains the way prices are set (or should be set) within a market for a specific product. This approach works with static economic variables, balancing supply and demand in the market to reach an equilibrium price. On the other hand, the strategic view of pricing is closely related to Marketing. Lilien et al. (1992) defend that price is the only marketing variable that directly determines revenue, thus, because price affects quantity sold, it has an impact on costs as well. Lindon et al. (2004)10 assume price as a strategic variable, since price-setting represents a decision where the entire strategic context denotes a lot of influence. The segmentation, the target, the positioning and the brand (or product) image create a strategic component that have to be coherent with the marketing-mix, where price is particularly important – setting the price too high or too low may cause irreversible
10
Lindon, D., Lendrevie, J., Lévy, J., Dionísio, P., Rodrigues, J.V., in the book Mercator XXI – Teoria e
31
Figure 10 - The positioning, differentiation and branding triangle
Source: Kotler, P., Marketing 3.0 From Products to Customers to the Human Spirit, 2010.
developed pricing capability goes well beyond the losses associated with poor pricing decisions” (Dutta et al., 2002).
This strategic view of pricing fits a dynamic context, where supply and demand depends on all kinds of social variables and where pricing decisions looks beyond the market equilibrium.
3.3.2 Strategic view
Market Segmentation is one of the key elements in the strategic process. Wedel and
Kamakura (2000) defines segmentation as “... essentially a grouping task, for which a large variety of methods are available”, aiming to set homogenous groups/segments and increase the effectiveness of marketing plans. The methodologies follow a set of segmentation bases divided in two criteria: General (independent of products, services and circumstances) vs. Specific (directly related with both the customer and the product) and Observable (such as demographic, cultural, socio-economic variables) vs. Unobservable (such as perceptions, preferences, life-style). The same authors assert that “in general, the most effective bases are found in the class of product-specific unobservable bases.”
Targeting and Positioning represent the
following steps of the strategic process, choosing the segment or set of segments to which the product is oriented and how the firm will face the market, i.e. how the firm aims to be seen by its target.
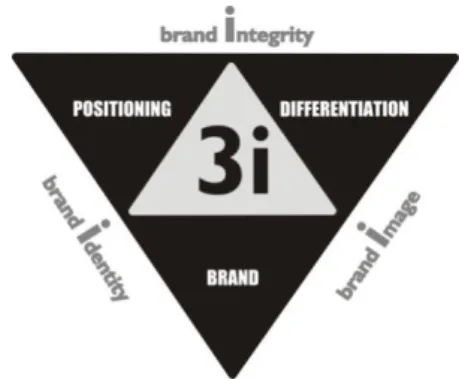
Kotler et al. (2010)11 propose a triangle of Positioning, Differentiation and Branding as the core of Marketing. Differentiation represents a
way of adding extra value to the product. And the brand ends up to be the image of the product / firm, representing the strategic identity. The goal of investing in
11
Kotler, P., Kartajaya, H., Setiawan, I., Marketing 3.0 – From Products to Customers to the Human
32 differentiation and branding is to increase the quality of the product, or at least the perceived quality.
In respect to quality, McConnell (1968) conducted an experiment about the price-quality relationship, using beer purchase trials. There were three brands of beer, all physically identical, but with different prices and brand images. The main findings about the study lead to a conclusion that subjects use price as an indicator of product quality. Despite having three homogenous beers, customers perceived the highest priced brand to have better quality than the other two. The main implication for business is that price is effectively one attribute used by consumers to cue quality, and so is brand image. This conjugation of factors allows us to conclude that the perceived quality that comes from brand image should be reflected on price.
The pricing in the marketing-mix process assumes a particular important role since it should reflect the strategic plan of the product. Dutta et al.( 2002) enhance that pricing is a complex process: “Changing prices has been looked up as an easy, quick and reversible process. However, in order to be able to set the right price at the right time, companies need to invest in resources, infrastructure and processes.”
3.3.3 Price Elasticity of Demand
One of the central points when talking about pricing is to consider consumers‟ willingness to pay for the product. The price elasticity of demand is possibly the best quantitative measure of the responsiveness of purchase decisions to variations in price. Demand‟s price elasticity by definition represents the percentage change in the quantity of a good demanded that results from a 1 percent increase in its price. According to Robert Frank (2010), there are three categories of price elasticity:
“Demand is said to be elastic with respect to price if its price elasticity is less than -1 [e.g. an increase of 1% in price would lead to a decrease of 3% in quantity]. The demand for a good is inelastic if its price elasticity is greater than -1 [an increase of 1% in price would cause a decrease of 0.5% in quantity] and unit elastic if the price elasticity is equal to -1.”
33 (1.) The degree of substitutability of the product (this is quite clear in essential goods, such as water);
(2.) The impact on total expenditure (the author gives an example of salt: even on an extremely heavy user of salt, the duplication of price would have a negligible effect on the income).
It is important to note that different segments of a market might have different price elasticities. In fact, people have different levels of price sensitivity depending on individual factors.
3.3.4 Price Discrimination
In a static environment, a profit-maximizing firm must always consider the consumer willingness to pay for its product. Producing an effective segmentation might be extremely important, since, as exposed on the last chapter, different segments of the market might have different sensibilities concerning price.
Dutta et al. (2002) state that, in complex markets, “most CEOs will never set a single price”. Price discrimination represents precisely the strategy of charging different prices for the same product. Conceptually this strategy aims to obtain the maximum value possible from each market segment. If consumers were all homogeneous only a single price could be charged, but as consumers differ in their willingness to pay, the profit can be maximized by charging a variety of prices. In this context, the reservation price concept comes up: the maximum price that a buyer is willing to pay. This concept is particularly well-known in auctions. Even though not so common in other industries, like retailing for instance, the reservation price assumes special importance in price discrimination strategies.
Having clear advantages in terms of attracting different kinds of customers, price discrimination might be a particularly difficult strategy to adopt. Lilien et al., (1992) identify several difficulties in implementing direct price discrimination:
1. Identifying consumers‟ reservation prices is difficult. There are no observable characteristics that give accurate information about the amount that a customer is willing to pay.
34 2. Setting a particular price to a particular segment is difficult. Most consumer goods are sold with posted prices, being available to everyone on an equal basis. 3. It is difficult to prevent arbitrage. Consumers with low reservation prices may
buy up the product and sell to high reservation consumers.
4. Charging different prices to different segments may be illegal or negatively discriminatory. E.g. the Robinson-Patman Act12 is a federal law passed in the US to outlaw price discrimination, in 1936.
5. Customers may view price discrimination as unfair.
Despite these issues, direct price discrimination “schemes” do exist:
The clearest example is setting different prices to different people, subject to certain terms: e.g. senior citizen or student discounts.
Goods and (mostly) services that do not have customized tariffs or fees. For example, lawyer representations or house maintenance/repairs might be charged individually, because each service require specific features and might be charged differently even if we are dealing with the same provider.
For customized business products and services, the price discrimination is not direct. The need for indirectness in the price discrimination scheme conducted to the development of pricing strategies, such as:
a. Quantity Discounts – high volume buyers pay lower prices.
b. Two-part tariffs – there is an upfront fixed payment and then a per unit charge.
c. Block tariffs – different pricing schemes applied to one product, such as telephone company tariffs, depending on the calls (number of minutes, the receptor‟s phone company, roaming, etc.) or electricity fees, depending on the schedules.
d. Bundling – selling two or more products and sell them as a package.
3.3.5. Reference Price
A reference price is an internal price settled by consumers, which provides a comparable indicator to actual prices. Especially in competitive markets, where
12 Robinson-Patman Act – aiming to prevent „unfair‟ competition, this act requires a business to sell its
products at the same price regardless of who the buyer is and was intended to prevent large-volume buyers from gaining an advantage over small-volume buyers.