MASTER IN
FINANCE
M
ASTER
’
S
F
INAL
W
ORK
D
ISSERTATIONT
HEC
HANGINGF
ACE OF ENTREPRENEURS INP
ORTUGALI
NÊSF
REITASG
OMESMASTER IN
FINANCE
M
ASTER
’
S
F
INAL
W
ORK
D
ISSERTATIONT
HEC
HANGINGF
ACE OF ENTREPRENEURS INP
ORTUGALI
NÊSF
REITASG
OMESSUPERVISION:
PROFESSORA ANA ISABEL ORTEGA VENÂNCIO
3
ABSTRACT
This study evaluates the changes on entrepreneurial activity in Portugal. More
specifically, it analyzes which start-ups and founder’s characteristics changed between
the last three decades (1980, 1990 and 2000). To enlight this research, we employ
Portuguese data, from a matched employer- employee database.
Portuguese entrepreneurs are predominantly middle-aged male with lower education
levels. In terms of gender, there was not changes overtime. Female entrepreneurs are
decreasing since 1986, being yet a minority in our sample. The number of young
entrepreneurs is increasing since 1986 but in a contracting decreasing rate after 2000.
Lastly, we assist to a decrease on the number of highly educated entrepreneurs in
Portugal. The number of start-ups’ founded by very low educated individuals is been
increasing since 1986. During the period of analysis, medium education was the
education level that suffered more changes. Until 2000, the number of medium educated
entrepreneurs increased and then decreased in the last period..
We also find that start-ups are becoming smaller. In terms of start-up survival, the
probability has increased specially in the last period.
JEL classification: L26; M13
Keywords: Entrepreneurs, Founders, Start-Ups, Characteristics, Gender, Age, Experience
4
ACKNOWLEDGMENTS
These two years were very important in my personal and professional life and for this
reason, I would like to thank my family and friends for the daily support and
encouragement not only during the last years but through my entire life. I dedicate this
dissertation to my parents António Cardoso de Oliveira Gomes and Emília Maria
Pedrosa Alberto Freitas. Thank you both for giving me this opportunity that was costly
for you. For the rest of my family, I also would like to thank them for faith in me, their
patience and tolerance of my days in a bad mood.
Behind this project, there are hours and hours invested in the past months and it would
not be possible without my advisor Professora Ana Isabel Ortega Venâncio. For her
availability and patience, I would also like to express my sincere gratitude for that and
for the possibility she gave me on improving my research and independence abilities.
Finally, I would like to thank the Portuguese Ministry of Employment and Social
Security and Gabinete de Estratégia e Planeamento (GEP) for giving me access to the
matched employer-employee data. All errors remain my own. Views expressed are
those of the author and do not necessarily reflect those of any branch or agency of the
5
TABLE OF CONTENTS
ABSTRACT ... 3
ACKNOWLEDGMENTS ... 4
LIST OF FIGURES ... 6
LIST OF TABLES ... 7
LIST OF ABBREVIATIONS AND ACRONYMS ... 8
1. INTRODUCTION ... 9
2. LITERATURE BACKGROUNG AND HYPOTHESIS ... 12
2.1. Entrepreneurial Incentives: pecuniary and non-pecuniary ... 12
2.2 Demographic Traits ... 13
2.3 Human Capital ... 16
2.4 Start-ups characteristics ... 19
3. OVERVIEW OF PORTUGUESE ECONOMY ... 21
4. DATA AND DESCRIPTIVE STATISTICS ... 25
5. EMPIRICAL METHODOLOGY AND RESULTS ... 27
5.1. Gender ... 27
5.2. Age ... 29
5.3. Education ... 29
5.4. Start-ups’ size ... 31
5.5. Start-ups’ survival... 32
6. CONCLUSION ... 34
6
LIST OF FIGURES
Figure 1- Ageing ratio (1986-2009; no.) ... 44
Figure 2 - Female Population (1986-2009; no.) ... 45
Figure 3 - Birth rate (1986-2009;%) ... 46
Figure 4 - Female unemployment (1986-2009;no.) ... 47
Figure 5- Portugal’s GDP annual growth rate (1986-2009;%) ... 48
Figure 6- Total central government debt (1986-2009 ; % of GDP) ... 49
Figure 7- Harmonized unemployment rate (1986-2009; %) ... 50
7
LIST OF TABLES
Table 1 – Summary of the main Entrepreneurship Policies ... 52
Table 2- Grants and Incentives for Entrepreneurship - IEFP ... 54
Table 3- Description of variables... 55
Table 4-Descriptive Statistics ... 56
Table 5- The impact of founder’s characteristics on gender using logit (marginal effects) ... 57
Table 6- The impact of founder’s characteristics on age using OLS (marginal effects) ... 58
Table 7- The impact of founder’s characteristics on education using Multinomial Logit (marginal effects) ... 59
Table 8 - The impact of founder’s characteristics on education using Multinomial Logit (marginal effects) ... 60
Table 9- The impact of founder and start-ups’ characteristics on firm size using OLS (marginal effects) ... 61
Table 10- The impact of founder and start-ups’ characteristics on firm survival using Logit (marginal effects) ... 62
Table A 1- The impact of founder’s characteristics on gender using Probit (marginal effects) .. 63
Table A 2 - The impact of founder’s characteristics on gender using LPM(marginal effects) ... 64
Table A 3 – The impact of founder and start-ups’ characteristics on firm survival using Probit (marginal effects) ... 65
8
LIST OF ABBREVIATIONS AND ACRONYMS
CAE - Classificação Portuguesa de Actividades Económicas
CEEDR - Centre for Enterprise and Economic Development Research
FINICIA - Programa do INOFIN para favorecer o processo de criação de empresas
IAPMEI – Instituto de Apoio às Pequenas e Médias Empresas e à Inovação, I.P.
IEFP - Instituto do Emprego e Formação Profissional
INE- Instituto Nacional de Estatística
INOFIN - Programa-Quadro de Inovação Financeira para o Mercado de PME do IAPMEI
MEI - Ministério da Economia e da Inovação
NUTS II - Second level of Statistic Territorial Units
PEDIP - Programa Específico para o Desenvolvimento da Indústria Portuguesa
POCTI - Programa Operacional Ciência, Tecnologia, Inovação
POE – Programa Operacional da Economia
POSI - Programa Operacional Sociedade de Informação
PRAXIS – Programa operacional no âmbito do QCA II
PRIME - Programa de Incentivos à Modernização da Economia
QCA I – Primeiro Quadro Comunitário de Apoio
QCA II – Segundo Quadro Comunitário de Apoio
QCA III - Terceiro Quadro Comunitário de Apoio
QP – Quadros de Pessoal
9
1. INTRODUCTION
Entrepreneurship is considered a process of innovation responsible for introducing new
products and production methods and different organizational schemes (Schumpeter,
1934; Wennekers and Thurik, 1999; Carree and Thurik, 2003; Tamizharasi and
Panchanatham, 2010). This activity plays an important role in the economy not only by
stimulating its productivity, growth and innovation (Audretsch, 2007; Praag and
Versloot, 2008) but also by fostering job creation (Ashcroft and Love, 1996; Parker and
Johnson, 1996; Fölster, 2000).
Previous literature gives different definitions for entrepreneurs: arbitrageur/speculator1;
innovator (Schumpeter,1934); allocator of resources and a leader. 2 Generally,
entrepreneurs are persons who organize, own and manage a business (Robert and
Brockhaus, 1980; Caliendo, et al., 2011) and assume risk and the possibility of failure
(Drucker, 1970; Hisrich, 1990; Robert and Brockaus, 1980). Despite being creative
persons (Swedberg, 2000), entrepreneurs need to have a wide range of skills in order to
create a successful business (Lazear,2005).3 To support the financing needs of their
businesses, they use their own savings or funds from friends and family (Blanchflower
and Oswald, 1998; Cassar, 2004; Damodaran, 2009). Start-up firms tend to be small
with low revenues and higher operating losses in the first years (Damodaran, 2009).
Consequently, entrepreneurs have lower initial earnings and slower earnings growth
relatively to a salaried worker (Hamilton, 2000).
1
According to Richard Cantillon (1755), the entrepreneur is an arbitrageur or speculator that bears all the risk and uncertainty involved in this process.
2
For more detailed information about the identities of entrepreneurs, see Parker (2009) and Hébert and Link (2006).
3
10
Several studies argue that the main determinants when choosing to become an
entrepreneur are age, gender, education and experience (Blau, 1987; Evans and
Jovanovic, 1989; Wit, 1993; Bates, 1995; Taylor, 1996; Blanchflower and Oswald,
1998; Djankov et al. 2005; Georgellis and Wall, 2005; Ardagna and Lusardi 2008; Iyer
and Schoar 2010). In the last years, several social, economic and policy changes have
occurred in Portugal that affected the life conditions and risk profile of population, and,
consequently, the propensity of creating new start-ups. Therefore, in this study, we will
evaluate the changes in the entrepreneur’s determinants in the last three decades, 1980,
1990 and 2000.
While there has been some research on understanding the main determinants of
entrepreneurial activity, a study that analyses possible changes on the entrepreneur’s
demographic and educational characteristics in Portugal has been missing and therefore
it will be the focus of this study. Thus, our research questions are: Did demographic and
educational characteristics change overtime for Portuguese entrepreneurs? Are the
entrepreneurs becoming younger and more highly educated? Did the initial
characteristics of the start-ups changed overtime?
To answer our research questions, we use a unique dataset that includes information
about all employees and firms in the Portuguese private sector between 1986 and 2009.
For each firm, we gather detailed information on the characteristics of the founder
demographic and educational characteristics and start-ups initial conditions such as size,
survival and number of founders.
Our results suggest that Portuguese entrepreneurs are predominantly middle-aged male
11
entrepreneurs are decreasing since 1986, being yet a minority in our sample. The
number of young entrepreneurs is increasing since 1986 but in a contracting decreasing
rate after 2000. Lastly, we assist to a decrease on the number of highly educated
entrepreneurs in Portugal. The number of start-ups’ founded by very low educated
individuals is been increasing since 1986. During the period of analysis, medium
education was the education level that suffered more changes. Until 2000, the number
of medium educated entrepreneurs increased and then decreased in the last period. We
also find that start-ups are becoming smaller. In terms of start-up survival, the
probability has increased specially in the last period.
This study has implications for policy makers and practitioners. A more thorough
understanding of the main determinants of entrepreneurial activity can help policy
makers to define better funding programs and policies for this matter. In this way, they
will be able to understand which strategies should be applied to improve the
entrepreneurial activity and determine which are available to cope with the different
types of entrepreneurs namely as female or male, younger or older, more educated or
not.
The remaining sections of this paper are structured as follows. The following section
reviews the literature about the determinants of entrepreneurial activity and presents the
main hypothesis of this study. Then, section III makes and overview of the Portuguese
macroeconomic and financial context in the last two decades. Section IV, describes the
dataset and how it was constructed. The empirical methodology and results are
12
2. LITERATURE BACKGROUNG AND HYPOTHESIS
Entrepreneurship is a multidimensional concept, whose definition depends on the
perspective studied. Entrepreneurial activities have been characterized in terms of three
perspectives (Djankov et al., 2005): institutional, sociological and psychological. The
institutional perspective emphasizes the role of economic, political and legal institutions
play in the dynamics of entrepreneurial activity. By the other side, sociologists evaluate
entrepreneurship in terms of social variables mainly cultural values (Cochran, 1971) and
social networks (Young, 1971). Lastly, the psychologists give relevance to the
individual characteristics of entrepreneurs. The main psychological characteristics are
locus of control and need for achievement (Misra and Kumar, 2000; Simpeh, 2011).
The first one relies on the belief about whether individual performance/outcome is the
result of our actions (internal control orientation) or not. Need for achievement is the
trait that entrepreneurs carry by having the need to succeed and get results on action
outcomes.
In this section, we start by reviewing studies, more integrated in the psychological
perspective, related to personal and external factors influencing entrepreneurship,
namely pecuniary and non-pecuniary incentives, demographic characteristics and
human capital.
2.1. Entrepreneurial Incentives: pecuniary and non-pecuniary
Using Parker’s framework of the determinants of entrepreneurship (Parker, 2009), we
review several effects on the propensity of individuals to become entrepreneur. In one
hand, individuals can enter into entrepreneurial activity due to a profitable and
13
are looking for better social life conditions and a wealth source guaranteed that were
compromised by adverse circumstances– unemployment (Baptista, et al., 2008)4.
Although, the motivations for the individuals that get into a business are not merely
driven by pecuniary rewards, non-pecuniary also play a key role (Amit, et al., 2000).
In addition to the financial benefits of venture creation, the desire to be independent,
autonomous or being one’s own boss is also an incentive for entrepreneurial activity
(Schumpeter, 1934; Dennis, 1996; Amit, et al., 2000; Hamilton, 2000; Frey and Benz,
2003; Hurst and Pugsley, 2011).
Entrepreneurs face several problems such as lack of financial support and financial
constraints5, thus, having enough capital to support the investment in new businesses
increases the probability of becoming an entrepreneur. The receipt of inheritance and
gifts is also relevant for the choice of becoming an entrepreneur (Blanchflower and
Oswald, 1998).
2.2 Demographic Traits
In this section, we analyze the main demographic traits: age and gender.
The relationship between age and self-employment is not consensual in the previous
literature. Some studies claim that self-employment is more likely to be pursued by
older individuals (Bluedorn and Martin, 2008; Dawson, et al., 2009). Others argue that
self-employment is higher among younger individuals (House, et al., 1993; Wit, 1993).
Taken together, entrepreneurs’ age has an inverted U-shaped relationship with the
4
This evidence is confirmed by the push and pull theory: an environment under economic contraction conditions where unemployment is high, entrepreneurs are more likely to start a new business. For a detailed explanation, see (Storey, 1992).
5
14
likelihood of firm creation. Middle-aged individuals6 are more likely to be involved in
entrepreneurial activities (Vanden Heuvel and Wooden, 1997; Bradley and Roberts,
2004; Georgellis and Wall, 2005; Lévesque and Minniti, 2006; Henley, 2007; Dawson,
et al., 2009). Globally, the majority of entrepreneurs start a venture when there are
between 25 and 40 years old (Kaufmann, 1999). This evidence changes when we
consider women entrepreneurs and different regions besides the USA and Europe.
Merwe and Lebakeng (2012), in their study, find that Asian female entrepreneurs are
between 40 and 49 years whereas Australian women entrepreneurs start their own
business under the age of 30 (Dann and Bennet, 2000). Nonetheless, entrepreneurship
may be less atractive for older people because they are less capable of working long
hours and are more risk averse7 (Lévesque, et al., 2002; Lévesque and Minniti, 2006). In
contrast, Parker (2009) suggest that is more expectable to find older entrepreneurs
because they have human and physical capital requirements that are often unavailble for
young individuals. In addition, older entrepreneurs have a better social and business
network . Thus, it is expected that we find older Portuguese entrepreneurs giving the
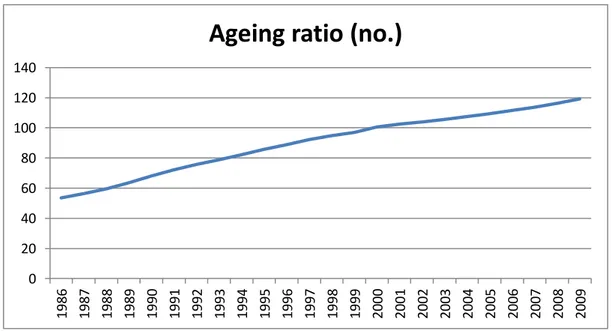
current ageing of the Portuguese population (see Figure 1) and to the higher life
expectancy. It is notable that in the past years, and due to the crisis that has been
affecting Portuguese economy, is becoming more difficult to get capital. Consequently,
we expect than older entrepreneurs have other ways to acquire capital than younger
individuals (Blanchflower and Oswald, 1998). This fact is also due to the fact that
young people are increasingly coming later in the labor market because they are
investing more in their higher education. According to Alves, et al. (2010), Portugal is
6
According to Lévesque and Minniti (2006), individuals who become entrepreneurs are between 35 and 44 years old.
7
15
assisting to an increase of the youth work share with more education levels and a
decrease of the percentage of low educated young individuals. Thus, we expect that
there is a higher investment in higher education by Portuguese individuals, in recent
years. Furthermore, the youth unemployment (International Labour Organization, 2013)
that Portugal has been suffering in this period is an “open door” for youth
entrepreneurship but due to the reasons mentioned before, Portuguese individuals have
been pushed to emigrate.
Hypothesis 1: The proportion of older entrepreneurs is increasing overtime, in
Portugal.
Relatively to gender, men still have prevalence on entrepreneurial activities and women
are less likely to be involved in entrepreneurial activities, showing a negative
relationship with self-employment8. According to Dhaliwal (2007), one third of
businesses in UK were founded by women. Compared with others regions, Asian
female entrepreneurs are a small proportion on business start-ups founders (Jones et al.,
1992, Metcalf et al., 1997). Despite of women are becoming more involved in
entrepreneurial activities, they continue to face difficulties in setting up and running
businesses. Women face different constraints which in the end affect their participation
and performance in entrepreneurship (CEEDR, 2000; Parker, 2009). Besides financial
discrimination and the lack of support after and during the business, women do not have
required psychological traits, such as confidence, skills and network, necessary to run a
start-up (Carter and Jones-Evans, 2006). On the last years, there have been more
policies to improve female entrepreneurship.Although,the number of female
8
16
entrepreneursis still decreasing explained by their preference to give more attention to
lifestyle and family, dedicating a great part of their time to them (Dawson, et al., 2009).
In contrast, business has been the main focus for most male entrepreneurs in their whole
life which gives them more entrepreneurial experience prior to start a business. Despite
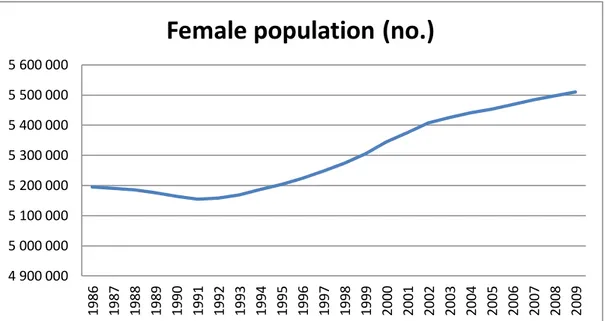
of these facts, some Portuguese social and economic changes have been affecting the
decision to become entrepreneur. Figure 2 shows the evolution of female Portuguese
population over the last years. From 1991 to 2009, women are becoming a higher
proportion of Portuguese individuals which increases the number of available woman to
start a business. In terms of family commitment, we can see in Figure 3 that Portugal is
assisting to a decrease of number of newborns overtime which lead us to conclude that
women are facing less obligations with children and family and more available to
reconcile work and leisure. Aditionally, the increase of female unemployment rate in
these last decades also affected the decision of becoming entrepreneur because
unemployed individuals have a lower opportunity cost on their time than a salaried
worker (see Figure 4). Women facing unemployment have fewer chances than
becoming entrepreneurs if they want to get a better wealth and lifestyle. Thus, we can
conclude that Portuguese women are having more motivated to become entrepreneurs.
Hypothesis 2: Female entrepreneurs are likely to be more involved in entrepreneurial
activities overtime.
2.3 Human Capital
Human capital refers to crucial human aspects, namely as knowledge, skills and
attitudes, for labor performance (Becker, 1962). According to human capital theory, this
can be divided in two types: specific and general (Becker, 1962; Becker, 1975;
17
firm, resulting in less job opportunities in the labor market. On the other side, general
human capital is useful for many jobs and industries. The accumulation of general
human capital allows the worker to get employed in different starting levels or
switching over to a better job. To conclude this section, two main variables of human
capital theory are reviewed: education and experience.
Education is the main factor for driving firm performance and competitiveness
(Aldcroft, 1992; Prais, 1995), by making workers more productive (Schultz, 1961;
Becker, 1962; Lynch and Black, 1995). Education provides individuals with better
analytical abilities and knowledge about entrepreneurial opportunities recognition and
exploitation (Casson, 1995; Davidsson and Honig, 2003) and become more successful
in running a venture since they have better managerial and communication skills
(Henley, 2009; Parker, 2009). Although, Jovanovic (1982) argued that entrepreneurial
abilities are acquired over time. For some authors, entrepreneurial skills do not depend
on education and formal knowledge but on learning by doing and learning effects from
past entrepreneurial experience (Blau, 1985; Wit, 1993; Minniti and Bygrave, 2001;
Cope, 2005). Findings about education are mixed (House, et al., 1993; Taylor, 1996).
Parker (2009) argues that there is a positive relationship between education and
entrepreneurship in developed countries. Pietrobelli, et al. (2004) find that there is a
negative relationship between entrepreneurship and secondary education and positive
only with primary education, privileging entrepreneurial skills9. This association can
also depend on the type of business: formal businesses are related to higher degrees of
education and informal businesses to secondary education (Lederman, et al., 2014).
9
18
Even so, managers and paid worker, tend to have a higher level of formal education
than the entrepreneurs do. In Portugal, we are assisting to a decrease of illiteracy rate
and to an increase in the number of individuals attending higher education schools,
particularly due to the compulsory education (9 years of school) imposed since 1981 by
the government. Despite the costs of attending university studies, there are several
policies and social benefits that turn university fees less expensive. In addition,
unemployment rates have also affected highly educated individuals in Portugal. For that
reason and because wages are not rising, highly educated individuals are likely to enter
into entrepreneurial activities for better life conditions. On the other side, less educated
individuals are more targeted to jobs in the primary and secondary sectors than for
entrepreneurial positions. Thus, we expect:
Hypothesis 3: Portuguese entrepreneurs are more likely to become more educated
overtime.
As well as education, experience is also a key factor for performance (Chandler, 1962;
Andrews, 1965; Hambrick and Mason, 1984; Barney, 1991). It stimulates earnings
growth (Medoff and Abraham, 1980) and contributes to firm success (Vesper, 1980;
Ronstadt, 1988) and to the possibility of the entrepreneur getting involved again in
setting up new start-ups (Westhead and Wright, 1999; Ucbasaran, et al., 2006). Previous
studies found a positive relationship between entrepreneurship and experience (Evans
and Leighton, 1989; Kaufmann, 1999; Williams, 1999; Shane, 2003). Experience
involves training for skills necessary to run a business namely negotiating, planning,
decision making, problem solving and communication (Shane, 2003). Kaufmann (1999)
find that most of entrepreneurs have more than 10 years of industry experience and have
19
variables and their effect on entrepreneurs are very important on explaining the
existence of spin-off10. Entrepreneurial characteristics11 are the key factor that affects
spin-off formation.
2.4 Start-ups characteristics
Start-up size is an important determinant for the subsequent performance of new firms.
The initial start-up size can depend on several founder characteristics. For instance,
human capital (education and experience) is positively correlated with start-up size. In
other words, this means that individuals with better training skills and knowledge are
likely to start larger firms12 (Barkman, 1994; Mata, 1996). Also, there is a positive
relationship between entrepreneur’s wealth and start-up size (Holtz-Eakin, et al., 1994;
Cabral and Mata, 2003; Colombo and Grilli, 2005). According to Kaufmann (1999),
start-ups are mostly small firms, businesses with no other employees than the owners or
businesses with one to four employees. Furthermore, small firms are an advantage for
entrepreneurs in the way that allow them to better understand the overall organization
and how operates, the technologies and many other business features that would not be
possible with larger firms (Bowen and Hisrich, 1986). In the last years, the Portuguese
economy has been assisting to a decrease on the size of firms and an increase in the
number of start-ups (Braguinsky, et al., 2011). According to Cabral and Mata (2003)
and Angelini and Generale (2005), the financial constraints can explain this fact since
constrained firms tend to be smaller. Other fact is the strong work protections in
10 A spin-off is considered a category of entrepreneurship and is defined as “an individual or an
organizational unit leaving an existing firm to start as a new firm on the basis of his/their specific knowledge and competences” (Elfring and Foss, 2000)
11
Shrivastava (2010) defines entrepreneurial characteristics as entrepreneurial talent. It includes characteristics like opportunity recognition, risk aversion and strive for independence.
12
20
Portugal (Angelini and Generale, 2005). Due to the restrictive practices that have been
affecting portuguese firms, some businesses are forced to reduce their demand for
workers and some workers are forced to create low productivity firms.
Hypothesis 4: Start-ups are more likely to be smaller overtime.
Firm size is one of the main factors that influence the survival probability (Sonmez,
2013). Several studies claim that there is a positive relationship between start-up size
and survival (Jovanovic, 1982; Mata and Portugal, 1994), meaning that larger have
more probabiltiy of survival than small firms (Dunne and Hughes, 1994; Parker, 2009;
Cabral and Mata, 2003). Kranenburg, et al. (2002) also consider economic conditions as
a factor for firm survival. Under favorable economic conditions, the probability of
exiting the market is low. Although, Portuguese economy has been suffering a deep
recession with a consequently increase of taxes which is been reducing the likelihood of
firms survival. In addition, these circumstances are creating some barriers on getting
monetary support and bank loans, specially for firms facing financial difficulties and
financial constraints (Ghosal, 2003).
21
3. OVERVIEW OF PORTUGUESE ECONOMY
To better frame the paper’s results, we will briefly describe the main features of the
Portuguese economy and the main policies towards entrepreneurship in the last two
decades. For a better analysis, we distinguish three periods in this section: 1980, 1990
and 2000.
The 80s decade was marked by the entrance of Portugal in the European Community
(1986). Since then, the creation of a single market led the country to a stable economic
growth, low labor costs and interest rates, inflows of European funds and the allowance
of development of several programs and policies. In these years, Portugal experienced
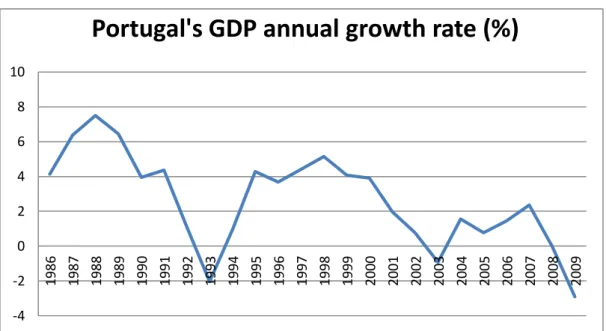
high GDP growth rates related to the other periods in analysis, followed by the decrease
of unemployment and illiteracy rates. Figure 5 illustrates the growth rate of GDP, in
percentage, over the last years. From 1986 to 1988, the annual growth rate of GDP rose
to 6.4 percent, whereas from 1988 to 1992 it decreased significantly to 1 percent.
In 1992, it was signed the Treaty on European Union with the purpose of bringing new
forms of cooperation among Member State governments and to prepare the country to
the creation of a single European currency. Consequently and after a weak period
characterized by a decrease of GDP and increase of unemployment until 1993, Portugal
attained a growth era until 2000.
In the last period we highlight the introduction of euro in 2002. Since then and due to
the increased international competition following the new enlargement of the European
Union (the integration of Central, Eastern European countries)13 and the establishment
13
22
of fixed exchange rate 14, Portugal entered in economic crisis and high deficit in 2003.
Further, the fall of the Berlin Wall and the disintegration of the Soviet Union were
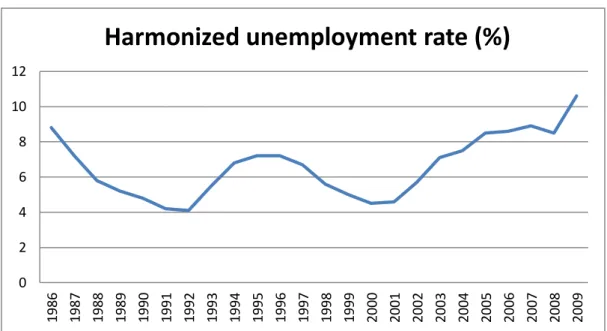
causes for the crisis (Comissão Europeia, 2008). Also, the Portuguese GDP achieved
negative growth rates15, the unemployment rate and the amount of government debt
reached the higher values comparative to our period analysis. Figure 6 and Figure 7
shows the amount of Portuguese government debt and the unemployment rate, between
1986 and 2009, respectively. Consequently, the number of students attending higher
education decreased since 2003 after growing four times more relative to 1986, the
migration outflows increased considerable, followed by a fall of families’ wealth and
the rise of poverty risk.
Table 1 summarizes the main European and Portuguese policies towards
entrepreneurship.
Since the entrance of Portugal in the European Community, Portugal negotiated an
amount of transfers from the EU, corresponding to five phases: “Anterior
Regulamento”( 1986 to 1988 ); QCA I - Primeiro Quadro Comunitário de Apoio (1989
to 1993) ; QCA II - Segundo Quadro Comunitário de Apoio (1994 to 1999 ); QCA III -
Terceiro Quadro Comunitário de Apoio (2000 a 2006) and QREN - Quadro de
Referência Estratégico Nacional (2007 to 2013). The main purposes of these monetary
wanted to enforce the safety in their countries because they were particularly concerned about the possibility of Russia becoming an unstable country and, consequently, to generate difficult problems in these countries.
14Banks faced financial constrains (banks’ liquidity and the sovereign debts were affected), difficulties to
keep up with minimum regulatory ratios and bad debts. These were the main reasons for the significant decreasing of the interest in credit and lending activities. This crisis was a big concern, mostly, for Ireland, Greece and Portugal. Also government policy choices and the bailout to the two banks that were a risk for Portuguese banking system contributed to a high public deficit and high public debt. As we can see in figure 3, until 2008 there was steady growth of government debt.
15
23
inflows were to ensure the economic development and the modernization of society,
qualify the human capital and promote life quality and social cohesion.
Additionally, in 1988 and 1992 were launched the Specific Program for the
Development of Portuguese Industry (PEDIP I and PEDIP II, respectively) with the
purpose of modernizing the Portuguese industry and strengthen competitiveness. Other
programs such as Praxis, POE, POCTI, POSI and PRIME also stimulate the
entrepreneurship in the last decades. The overall goal of these policies is to stimulate
entrepreneurship and enhance competitiveness and productivity of Portuguese firms by
increasing the number of start-ups, improve education and training of population and
promote business innovation.
In 2000 was created the European Charter for Small Enterprises which main goal was to
improve the education and training for entrepreneurship of small enterprises. Two years
later, the European Commission presented the Green Paper on Entrepreneurship Policy,
where the Commission explains the importance of entrepreneurship and identifies the
key factors for a better promoting of entrepreneurship in Europe. In order to improve
entrepreneurship, the main proposals of Commission were setting better incentives for
entrepreneurs by creating social security systems specially for entrepreneurs, increasing
the availability of venture capital and business angel finance and investments, giving
more support to entrepreneurs and establish strategic partnerships between them and
reducing administrative and regulatory barriers.
The main organization that supports entrepreneurial activity in Portugal is IEFP –
Instituto do Emprego e Formação Profissional which was created in 1962 and is
24
namely youngsters looking for their first job or unemployed individuals. Their major
initiatives are described in Table 2.
Specifically, there are further segmented portals containing information and practical
guides aimed at helping entrepreneurs to establish new businesses. For young
entrepreneurs, we have for example the program Empreender + and Programas de
Apoio ao Empreendedorismo e à Criação do Próprio Emprego. Their main goals are
attracting business ideas and ways of investment and job creation, respectively. Besides
these programs targeted to young people, there are others that also help women to
integrate more into the world of entrepreneurship. This is the case for Plataforma do
Empreendedor, Portugal Empreendedor, Programa Estratégico para o
Empreendedorismo e a Inovação (+e+i), among others. In terms of financing, we also
have the program FINICIA promoted by IAPMEI and MEI which main goal is to
provide easy access to financing solutions and technical assistance in the creation of
25
4. DATA AND DESCRIPTIVE STATISTICS
Our analysis draws on a matched employer-employee database (QP - “Quadros de
Pessoal”).
QP is a mandatory database that covers comprehensive information, from 1986 to 2009,
of the entire Portuguese private sector, on more than 220,000 firms and 2,000,000
individuals per year. It is submitted annually, by firms with at least one employee, to the
Portuguese Ministry of Employment and Social Security. Data concerning firms include
year of creation, location, size, industry, number of establishments, initial capital and
ownership structure. The data on workers characteristics include gender, age, education,
wages and hours worked.
From the QP, we select all start-ups established between 1986 and 2009. For these new
firms, we identify the founders and their background history. We exclude firms which
were not possible to identify at least one owner or if we could not identify the founders’
background history. Our sample was restricted to founders with ages between 20 and 60
years. In total, our sample includes 869,315 which founded 421,263 firms. We
supplement this data with information at the county level from INE, namely GDP,
population and unemployment level.
Table 3 and Table 4 summarize the variables description used in this study and the
descriptive statistics of our sample considering the three different decades: 1980, 1990
and 2000. Middle aged men are more likely to start-up firms. Nevertheless, the founder
is becoming younger and the percentage of female entrepreneurs is increasing. In terms
of educational level, we have different results when considering the analysis for the
26
while in the next periods we have a higher presence of low educated individuals on
entrepreneurial activity (39.53% and 41.54%, respectively). Simultaneously, the number
of high educated individuals increased since 1980s to 2000s, from 9.08% to 17.19%.
We also find that the percentage of foreign entrepreneurs has increased overtime.
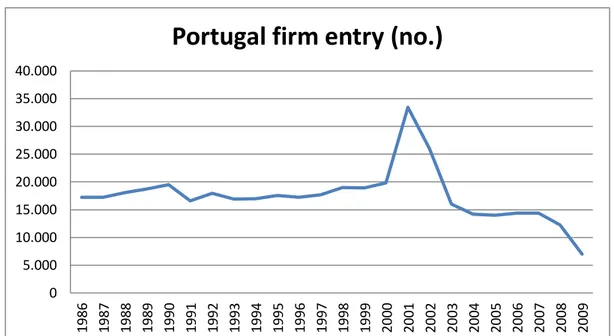
Regarding start-ups characteristics, 42.35% of the start-ups of our sample were
established in the decade of 1990. Although, we observe on Figure 8 a peak of firm
entry in 2001 and a decline since then, justified by the recessive macroeconomic cycle
and public deficit in Portugal, in the following years. The firms are typically small and
have, on average, four employees and one and two founders. The size of the start-up
and, as well, the number of founders has been decreasing since the 1980s decade. In
terms of survival, the number of firms surviving has been decreasing sharply. In the
1980s, 97,10% of the start-ups survived more than two years. Since then, the number of
27
5. EMPIRICAL METHODOLOGY AND RESULTS
Our empirical strategy consists in comparing founders’ and start-ups characteristics
established in three different periods in time: from 1986 to 1989, from 1990 to 2000 and
from 2000 to 2009.
5.1. Gender
In order to analyze the demographic and educational characteristics of the entrepreneurs
overtime, we will use the following equation:
(1)
where f denotes the founder of a start-up, y is the entry year, c indicates the region and j
the industry.
We start by evaluating if there were significant changes in the percentage of female
entrepreneurs. Our dependent variable is gender, a dummy variable equaling one for
women and zero for men. Our variables of interest are D90, a dummy variable equaling
1 if the start-up was established between 1990 and 1999 and 0 otherwise, and D00, a
dummy variable equaling 1 if the start-up was established between 2000 and 2009 and 0
otherwise. The omitted category is the period between 1986 and 1989. Our vector X
represents the founder’s characteristics – age and education. Founders’ age is measured
with four categorical variables: Age 20-29 is coded one for individuals with age
between 20 and 29; Age 30-39 is coded one for individuals with age between 30 and 39;
Age 40-49 is coded one for individuals with age between 40 and 49 and; Age 50-60 is
coded one for individuals with age between 50 and 60; and founders’ education is
defined with four categorical variables: high education is a dummy variable equaling
fycj j
c y f
y
fycj
D
D
X
Z
28
one for founders with bachelors, masters or doctoral degrees; medium education is a
dummy variable equaling one for individuals reporting a high school diploma or
vocational school degree; low education is a dummy variable equaling one for
individuals that attended junior high school; and very low education is a dummy
variable equaling one for individuals who never attended or completed the elementary
school. The vector Z contains controls for economic activity namely: GDP per capita
per year, population and unemployment, measured on logarithms. To further control for
economic activity we use municipality ( c ), dummy variable defined with seven
categorical variables, following NUTS II, equaling one for the respective territorial unit;
industry (j), dummy variable defined seventy eight categorical variables, according to
industry classification, CAE review 2.1, equaling one for the respective industry code;
and year fixed effects (y), dummy variable defined with twenty four categorical
variables, from 1986 to 2009, equaling one for the respective reference year. The results
for the specification (1) are presented in Table 5. As our dependent variable is a dummy
variable, we use a logit model. In appendix, Table A 1 and Table A 2 present the results
for probit and linear probability model. In column (1) we have only the variables of
interest and the economic activity controls and in column (2) we add the remaining
variables. The results show a negative relationship between dependent variable and our
variable of interest, suggesting that firms established by male entrepreneurs increased
along the period. The results suggest that there is a decrease of 0.8% and 1.2% in the
proportion of firms created by female entrepreneurs in 1990s and 2000s, respectively,
compared to the decade of 1980. Portuguese female entrepreneurs are also becoming
29
significant in the last period. Therefore, we reject Hypothesis 2 that the percentage of
female entrepreneurs is increasing.
5.2. Age
For age, we also use equation (1) but the dependent variable is measured as logarithm of
age. Our variables of interest are also D90 and D00. The omitted category is the period
between 1986 and 1989. Our vector X represents the founder’s characteristics – gender
and education – and the vector Z includes the controls for economic activity. In this case
we use an OLS model which results are presented in Table 6, where Column (1)
represents the specifications with the variables of interest and economic activity
variables and in column (2) we add the founder demographic and education
characteristics. The results show a negative relationship between dependent variable and
our variable of interest, suggesting that firms established by older entrepreneurs
decreased along the period, with a higher decrease in 1990s followed then by a slower
decrease. In another perspective, we see the firms established in Portugal are becoming
founded by younger entrepreneurs. Related to the other variables, the results show that
for older Portuguese entrepreneurs, there is a low probability of being women and
having greater education levels. The coefficients are statistically significant at 1%.
Thus, we reject Hypothesis 1 that entrepreneurs are becoming older overtime.
5.3. Education
Our dependent variable is education is also defined with defined with four categorical
variables: high education is a dummy variable equaling one for founders with bachelors,
masters or doctoral degrees; medium education is a dummy variable equaling one for
individuals reporting a high school diploma or vocational school degree; low education
30
very low education is a dummy variable equaling one for individuals who never
attended or completed the elementary school. As in the previous models, our main
variables are D90 and D00 and the omitted category is the period between 1986 and
1989. Our vector X represents the founder’s characteristics – gender and age – and the
vector Z includes the controls for economic activity. Results of multinomial logit model
are presented in Table 7 (specification with our variables of interest and the economic
controls and Table 8 (containing all variables of this model). The reference category
very low education is omitted. For low education, there is evidence that the probability
of having entrepreneurs with low education is increasing overtime. In the other side, we
observe that for the remaining categories of education, the probability of having firms
established by them is decreasing overtime, comparatively to entrepreneurs with very
low education level. The period of 2000s was the period with greater changes in the way
that there was a higher variation for low education (positive) and medium/high
education (negative). We also can observe that female entrepreneurs have
predominantly medium and high education while male entrepreneurs have low
education levels. In terms of age, there is a negative relationship between older
entrepreneurs and education. In the other side, Youngers are becoming more high
educated individuals and the proportion of young individuals with low education levels
decreased. Thus, we find that entrepreneurs are becoming less highly educated
overtime. Results are only statistically significant in the last period and for medium and
high education. Hence we do reject the Hypothesis 3 that entrepreneurs are expected to
31 5.4. Start-ups’ size
In the following sections we test the impact of entrepreneurs’ characteristics on start-up
survival and size, across time, using the following regression:
(2)
where f denotes the founder of a start-up, s refers to start-up, y is the entry year, c
indicates the region and j the industry.
Our dependent variable is size which is measured as the logarithm of the initial number
of employees of the start-up. In this model, we also use the dummies D90 and D00 as
variables of interest. As mentioned before, vector X and Z represents founder’s
characteristics and economic activity controls, respectively. Our vector Y denotes the
start-ups characteristics – number of founders which is measured as the logarithm of the
number of founders of the firm. The results for the OLS model are presented in Table 9.
Column (1) presents the specification with the variables of interest and economic
controls and in column (2), we add the remaining characteristics for this model. The
regression indicates decreasing negative relationship between our variables of interest
and firm size which means that firms are becoming smaller since 1986. The relationship
between firm size and the number of founders and education is positive. In the other
side, the probability of having larger firms founded by male entrepreneurs is high.
Relative to age, there is a strong correlation between individuals aged among 40 and 49
years and firm size. The coefficients are statistically significant at 1% level. Therefore,
we do not reject Hypothesis 4 that firms are becoming smaller overtime.
fycj c
y f
S y
fycj
D
D
Y
X
Z
32 5.5. Start-ups’ survival
Our dependent variable is survival, a dummy variable equaling one if survived the first
two years and zero otherwise. As in the previous models, D90 and D00 are the main
variables for this analysis. The vector Y represents the start-ups’ characteristics –size
and number of founders –, the vector X and Z represents the founder’s characteristics
and economic activity controls. Table 10 presents the marginal effects of logit
regression. In appendix, Table A 3 and Table A 4 present the results for probit and
linear probability model. Column (1) presents our main variables of interest and
economic controls and in column (2), we add the start-ups and founder’s characteristics
mentioned before. The estimations display those start-ups survival has increased
overtime since 1986. The results for probit and linear probability model are different
from the previous, showing that the 1990s were characterized by a decrease of firm
survival. In terms of founders’ characteristics, we find that being women contributes
negatively for firm survival. The relationship between age/education and survival is
positive, showing that older and highly educated individuals have a higher probability
of keeping the start-up in the market. In terms of firm characteristics, we find a positive
relationship between the number of founders and firm survival. Lastly, coefficients
about firm size have different signals in the models, showing that there is not a
consensual conclusion about the relationship between firm size and survival. Overall,
we can conclude that firms are surviving more in the last years, leading us to reject the
Hypothesis 5,since the results are statistically significant.
Comparing our results to the relevant literature regarding the impact of Portuguese
macroeconomic conditions, we see that in fact economic control variables do have a
33
unemployment rate. Our results on descriptive statistics shows that firm entry occur
mostly in the decade of 1990 and 2000. Specifically, these findings are somehow
consistent with the push and pull theory (Storey, 1982) that argues that under economic
34
6. CONCLUSION
The aim of our study is to analyze the changes of founders and start-ups’ characteristics
in Portugal overtime. Using a Portuguese matched employer-employee database, the
QP, we look at relationship between firm entry and the characteristics of entrepreneurs
and firms.
In order to reach our conclusions, we conducted several models analysis in order to
understand the statistical significance of our variables and their impact over start-ups,
simultaneously controlling for municipality, industry and year effects.
We find that Portuguese entrepreneurs are predominantly middle-aged male with lower
education levels. In terms of gender, female entrepreneurs are still a minority in our
sample. We can say that there was no changes since 1986 since female entrepreneurs
are continuing to decrease. On the other hand, we find that entrepreneurs are becoming
younger in Portugal overtime, but in a slower decrease after 2000. For education, there
is evidence that entrepreneurs are not becoming more educated overtime. In fact, the
number of start-ups’ founded by very low educated individuals is been increasing since
1986. During the period of analysis, medium education was the level that suffered more
changes. Until 2000, the number of medium educated entrepreneurs increased and then
decreased.
In terms of start-ups characteristics, we find that start-ups are becoming smaller.
Regarding their propensity to survive, most firms established between 1986 and 2009
survived more than two years. According to the estimations, the number of firms that
35
Nonetheless, the estimations obtained are limited by the extension of dataset used which
lead to some computational problems due to a higher number of variables, that was
posteriorly reduced, and by the fact that our dataset only contains data until 2009. This
study could be further developed by analyzing the impact of the last years’ recession,
unemployment and high public deficit and debt in Portugal with a more enlarged
dataset. It would also be useful to study the start-ups entry by including a wide sample
containing workers data to study it from the perspective of Portuguese workers instead
36
8. BIBLIOGRAPHY
Acemoglu, D., 1999. The Structure of wages and investment in General Training. Journal of Political Economy, 107(3), pp. 539-572.
Aldcroft, D., 1992. Education, Training and Econoomic Performance, Manchester: Manchester University.
Alves, N., Centeno, M. & Novo, Á., 2010. Investment in education in Portugal : returns and heterogeneity. Economic Bulletin, Spring.
Amit, R., MacCrimmon, K. R., Zietsma, C. & Oesch, J. M., 2000. Does Money matter? Wealth attainment as the motive for initiating growth-oriented technology ventures. Journal of Business Venturing, Volume 16, pp. 119-143.
Andrews, K., 1965. The concept of corporate strategy. Homewood, IL: Dow Jones-Irwin. Angelini, P. & Generale, A., 2005. Firm size distribution: Do financial constraints explain it all? Evidence from survey data. Economic Research Development, June.
Ardagna, S. & Lusardi, A., 2008. Explaining Internacional Differences in Entrepreneurship: The role of individual characteristics and regulatory constraints. Cambridge, National Bureau of Economic Research.
Ashcroft, B. & Love, J., 1996. Firm births and employment change in British countries. Papers in Regional Science, 75(4), pp. 1-18.
Audretsch, D., 2007. Entrepreneurship capital and economic growth. Oxford Review if enterprise economy, 23(1), pp. 63-78.
Baptista, A., Teixeira, M. S. & Portela, J., 2008. Motivações e obstáculos ao empreendedorismo em Portugal e propostas facilitadoras. Tomar: s.n.
Barkman, R., 1994. Entrepreneurial characteristics and the size of the new firm: a model and an econometric test. Small Business Economics, Volume 6, pp. 117-125.
Barney, J., 1991. Firm resource and sustained competitive advantage. Journal of Managament, 17(1), pp. 99-120.
Bates, T., 1995. Self-employment entry across industry groups. Journal of Business Venturing, 10(2), pp. 143-156.
37
Becker, G. S., 1975. Investment in Human Capital: Effects on Earnings. In: Human Capital: A Theoretical and Empirical Analysis, with Special Reference to Education. New York: NBER, pp. 13-44.
Benz, M. & Frey, B. S., 2004. Being independent raises happiness at work. Swedish Economic Policy Review, Volume 11, pp. 95-134.
Blanchflower, D. G. & Oswald, A. J., 1998. What makes an Entrepreneur?. Journal of Labour Economics, Vol.16(No.1), pp. 26-60.
Blau, D., 1985. Self-Employment and self-selection in developing country labour markets. Southern Economic Journal, Volume 52, pp. 351-363.
Blau, D., 1987. A time series analysis of self-employment in the United States. Journal of Political Economy, Volume 95, pp. 445-467.
Bluedorn, A. C. & Martin, G., 2008. The time frames of entrepreneurs. Journal of BusinessVenturing, 23(1), p. 1–20.
Bowen, D. D. & Hisrich, R. D., 1986. The Female Entrepreneur:A career Development Perspective. Academy of Management Review, 11(2), pp. 393-407.
Bradley, D. & Roberts, J., 2004. Self-Employment and Job Satisfaction: Investigating the Role of Self-Efficacy, Depression and Seniority. Journal of Small Business Management, 42(1), pp. 37-58.
Braguinsky, S., Branstetter, L. G. & Regateiro, A., 2011. The incredible shrinking Portuguese firm. NBER Working Paper no.17265, July.
Cabral, L. M. & Mata, J., 2003. On the evolution of the Firm Size Distribution: Facts and Theory. American Economic Review, 93(4), pp. 1075-1090.
Caliendo, M., Fossen, F. & Kritikos, A., 2011. Personality Characteristics and the Decision to become and stay self-employed. IZA DP No.5566, March.
Carree, M. A. & Verheul, I., 2012. What Makes Entrepreneurs Happy? Determinants of Satisfaction Among Founders. Journal of Happiness Studies, 13(2), pp. 371-387.
Carree, M. & Thurik, R., 2003. The impact of Entrepreneurship on economic growth. In: Handbook of Entrepreneurship Research. s.l.:Springer US, pp. 437-471.
Carter, S. & Jones-Evans, D., 2006. Enterprise and Small Business: Principles, Practice and Policy. 2nd ed. England: Financial Times/ Prentice Hall.
Cassar, G., 2004. The financing of business start-ups. Journal of Business Venturing, 19(2), pp. 261-283.
38
CEEDR, 2000. Young entrepreneurs, Women Entrepreneurs, Ethnic minority entrepreneurs and Co-entrepreneurs in the European Union and Central and Eastern Europe, UK: Middlesex University Business School.
Chandler, A., 1962. Strategy and structure:Chapters in the history of American industrial enterprise. London, England: MIT Press.
Colombo, M., Delmastro, M. & Grilli, L., 2004. Entrepreneurs' human capital and the start-up size of new technology-based firms. International Journal of Industrial Organization, Volume 22, pp. 1183-1211.
Colombo, M. & Grilli, L., 2005. Start-up size: the role of external financing. Economics Letters, Volume 88, pp. 243-250.
Comissão Europeia, 2008. EMU@10: Successes and Challenges after 10 Years of Economic and Monetary Union. European Commission, February.
Cope, J., 2005. Toward a dynamic learning perspective of entrepreneurship. Entrepreneurship Theory and Practice, 29(4), pp. 373-397.
Damodaran, A., 2009. Valuing Young, Start-up and Growth Companies : Estimation issues and Valuation Challenges. Working Paper, May.
Dann, S. & Bennett, R., 2000. The Changing Experience of Australian Female Entrepreneurs. Gender, Work and Organization, 7(2), pp. 75-83.
Davidsson, P. & Honig, B., 2003. The role of social and human capital among nascent entrepreneurs. Journal of Business Venturing, 18(3), pp. 301-331.
Dawson, C. J., Henley, A. & Latreille, P. L., 2009. Why do individuals choose self-employment?. IZA DP No.3974, January.
Dennis, J., 1996. Self-employment: When nothing else is available?. Journal of Labour Research, 17(4), pp. 645-661.
Devine, T. J., 1994. Characteristics of Self-Employed Women in the United States. Monthly Labor Review, 17(3), pp. 20-69.
Dhaliwal, S., 2007. Dynamism and enterprise: Asian Female Entrepreneurs in the United Kingdom. Journal of Immigrant & Refugee Studies, 5(2).
Djankov, S. et al., 2005. Who are Russia's Entrepreneurs?. Journal of the European Economic Association, 3(2-3), pp. 587-597.
39
Elfring, T. & Foss, N., 2000. Competence Building: Understanding the Role of Internal Venturing and Spin-offs. Advances on Applied Business Strategy, Volume 6A, pp. 97-119.
Evans, D. & Jovanovic, B., 1989. An estimated model of entrepreneurial choice under liquidity constraints. Journal of Political Economy, 97(4), pp. 808-827.
Evans, D. & Leighton, L., 1989. The determinants of changes in U.S. self employment. Small Business Economics, 1(2), pp. 111-119.
Evans, D. S. & Leighton, L. S., 1989. Some empirical aspects of entrepreneurship. American Economic Review, 79(June), pp. 519-535.
Frey, B. & Benz, M., 2003. Being independent is a great thing: subjective evaluations of self-employment and hierarchy, Munich: CESifo Working Paper No. 959.
Georgellis, Y. & Wall, H., 2005. Gender Differences in self-employment. International Review of Applied Economics, 19(3), pp. 321-342.
Ghosal, V., 2003. Impact of uncertainty and sunk costs on firm survival and industry dynamics. CIC Working Papers, Volume 12, pp. 1-35.
Hambrick, D. & Mason, P., 1984. Upper echelons: The organization as a reflection of its top managers. Academy of Management Review, pp. 193-206.
Hamilton, B. H., 2000. Does entrepreneurship pay? An empirical analysis of the returns to self-employment. Journal of Political Economy, 108(3), pp. 604-631.
Hébert, R. F. & Link, A. N., 2006. Historical Perspectives on the Entrepreneur. Foundations and Trends in Entrepreneurship, 2(4), pp. 261-408.
Henley, A., 2007. Entrepreneurial aspiration and transition into self-employment: evidence from Brithish longitudinal data. Entrepreneurship and Regional Development, 19(3), pp. 253-280.
Henley, A., 2009. Switching Costs and Occupational Transition into Self-Employment. IZA DP No. 3969, January.
Holtz-Eakin, D., Joulfaian, D. & Rosen, H. S., 1994. Entrepreneurial Decisions and Liquidity Constraints. The RAND Journal of Economics, Vol.25(No.2), pp. 334-347.
House, W., Ikiara, G. & McCormick, D., 1993. Urban Self-Employment in Kenya:Panacea or Viable Strategy?. World Development, Volume 21, pp. 1205-1233.
Hurst, E. & Pugsley, B. W., 2011. What do small business do?. Brookings Papers on Economic Activity, pp. 73-118.
40
Iyer, R. & Schoar, A., 2010. Are there Cultural Determinants of Entrepreneurship?. In: J. Lerner & A. Schoar, eds. International differences in Entrepreneurship. Chicago: University of Chicago Press, pp. 209-240.
Jones, T., McEvoy, D. & Barret, G., 1992. Small Business Initiative: Ethnic Minority Business. Component. Swindon ESRC.
Jovanovic, B., 1982. Selection and Evolution of industry. Econometrica, Volume 50, pp. 649-670.
Jovanovic, B., 1982. Selection and the evolution of industry. Econometrica, Volume 50, pp. 649-670.
Kaufmann, P., 1999. Franchising and the choice of self-employment. Journal of Business Venturing, 14(4), pp. 345-362.
Klyver, K., 2007. The shifting family involvement during the entrepreneurial process. International Journal of Entrepreneurial Behaviour and Research, 13(5), pp. 258-277. Kranenburg, V., Palm, F. & Pfann, G., 2002. Exit and Survival in a concentrating industry: the case of daily newspapers in the Netherlands. Review of Industrial Organization, Volume 21, pp. 283-303.
Lazear , E., 2005. Entrepreneurship. Journal of Labor Economics, Volume 23, pp. 649-680. Le, A., 1999. Empirical studies of self-employment. Journal of Economic Surveys, Volume 13, pp. 381-416.
Lederman, D., Messina, J., Plenknagura, S. & Rigolini, J., 2014. Latin American Entrepreneurs, Washington,D.C.: The World Bank.
Lévesque, M. & Minniti, M., 2006. The effect of aging on entrepreneurial behaviour. Journal of Business Venturing, 21(2), pp. 177-194.
Lévesque, M., Sheperd, D. & Douglas, E., 2002. Employment or self-emplyment: a dynamic utility-maximising model. Journal of Business Venturing, Volume 17, pp. 189-210.
Lucas, R., 1978. On the size distribution of business firms. The Bell Journal of Economics, Volume 9, pp. 508-523.
Lynch, L. & Black, S., 1995. Beyond the incidence of training: evidence from a national employers survey. NBER Working Papers Series, WP no. 5231..
Mata, J., 1996. Markets, entrepreneurs and the size of new firms. Economics Letters, Volume 52, pp. 88-94.
41
Medoff, J. L. & Abraham, K. G., 1980. Experience, Performance and Earnings. The Quarterly Journal of Economics, December, pp. 703-736.
Merwe, S. P. v. d. & Lebakeng, M., 2012. An emprircal investigation of Women
Entrepreneurship in Lesotho, Republica of South Africa: Potchefstroom Business School. Metcalf, H., Modood, T. & Virdee, S., 1997. Asian Self-emplyment. s.l.:Policy Studies Institute. Minniti, M. & Bygrave, W., 2001. A dynamic model of entrepreneurial learning.
Entrepreneurship Theory and Practice, 25(3), pp. 5-16.
Minniti, M. & Naudé, W., 2010. What Do We Know about the Patterns and Determinants of Female Entrepreneurship across Countries?. European Journal of Development Research, Vol.22(No.3), pp. 277-293.
Misra, S. & Kumar, E., 2000. Resourcefulness: A Proximal Conceptualisation of Entrepreneurtial Behaviour. Journal of Entrepreneurship, 9(2), pp. 135-154.
OECD, 1992. Employment Outlook, Paris: Organization for Economic Cooperation and Development.
Parker, S., 2007. Entrepreneurial learning and the existence of credit markets. Journal of Economic Behavior and Organization, 62(1), pp. 37-46.
Parker, S. C., 2009. The Economics of Entrepreneurship. Cambridge: Cambridge University Press.
Parker, S. & Johnson, P., 1996. Spatial variations in the determinants and effects of firm births and deaths. Regional Studies, 30(7), pp. 679-688.
Pietrobelli, C., Rabellotti, R. & Aquilina, M., 2004. An Empirical Study of the Determinants of Self-Employment in Developing Countries. Luiss Lab on European Economics, Volume 14, pp. 1-17.
Portugal, D. d. E. E. B. d., 2009. A Economia Portuguesa no Contexto da Integração Económica, Financeira e Monetária, Lisboa: Banco de Portugal.
Praag, C. v. & Versloot, P. H., 2008. The Economic Benefits and Costs of Entrepreneurship : A Review of the Research. Foundations and Trends in Entrepreneurship, Vol.4(No.2), pp. 65-104. Prais, S., 1995. Productivity, Education and Training. An International Perspective, Great Britain: Cambridge University Press.