Carlos Pestana Barros & Nicolas Peypoch
A Comparative Analysis of Productivity Change in Italian and Portuguese Airports
WP 006/2007/DE _________________________________________________________
António Afonso, Mohamed Ayadi, Sourour Ramzi
Assessment of efficiency in basic and secondary education in Tunisia a regional analysis
WP 06/2013/DE/UECE _________________________________________________________
De pa rtme nt o f Ec o no mic s
W
ORKINGP
APERSISSN Nº 0874-4548
School of Economics and Management
Assessment of efficiency in basic and secondary education
in Tunisia: a regional analysis
António AFONSO,
†Mohamed AYADI,
‡Sourour RAMZI
*February 2013
Abstract
We evaluate the efficiency of basic and secondary education in 24 governorates of Tunisia during the period 1999-2008 using a non-parametric approach, DEA (Data Envelopment Analysis). We use four inputs: number of teacher per 100 students, number of classes per 100 students, number of schools per million inhabitants and education spending per student, while the output measures include the success rate of baccalaureate exam and the rate of non-doubling in the 9th year. Our results show that there is a positive relationship between school resources and student achievement and performance. Moreover, there was an increase in output efficiency scores in most governorates through the period from 1999 to 2008.
Keywords: basic and secondary education, efficiency, DEA, Tunisia JEL Codes: C14, H52, I21
† ISEG/UTL - Technical University of Lisbon, Department of Economics; UECE – Research Unit on
Complexity and Economics.R. Miguel Lupi 20, 1249-078 Lisbon, Portugal. UECE is supported by FCT (Fundação para a Ciência e a Tecnologia, Portugal), email: aafonso@iseg.utl.pt.
‡UAQUAP-Institut Supérieur de Gestion de Tunis.e-mail : ayadimed2001@yahoo.fr, Tél :(216) 98 377 467.
*
1. Introduction
It is important to recognize the role of education in stimulating economic growth and in the promotion of social development. As regards expenditure, the education sector absorbs a large share of the state budget in most countries. Therefore, each country seeks to achieve the level of efficiency in education, minimizing costs and resources used in this sector.
In this paper, we measure the efficiency of secondary education and of the 2nd cycle of basic education in 24 governorates of Tunisia through the period ranging from 1999 to 2008. In methodological terms, we employ data envelopment analysis (DEA) to assess efficiency of decision making units (DMUs). In order to evaluate the effects of school resources and expenditures used in secondary education and in the 2nd cycle of basic education, we use four input variables (number of teacher per 100 students, number of classes per 100 students, number of schools per million inhabitants, and spending education per student) and two output variables: the success rate of the baccalaureate exam and the rate of non-doubling in the 9th year.
Our main results show that there is a positive relationship between physical school resources and expenditures used in education and student performance in most governorates. There is a positive relationship between school resources and student performance, and there was an increase in output efficiency scores in most governorates through the period from 1999 to 2008-
The paper is organized as follows. In section 2 we describe the Tunisian Education System. Section 3 presents the review of the related existing literature on education efficiency. In section 4 we briefly presented the DEA methodology used in the paper. In section 5, we explain the data, and analyse the estimation results. Finally, section 6 provides the conclusion.
2. Description of the Tunisian Education System
The Tunisian education sector was characterized by a remarkable progress since 1956 (date of independence). It was based on the French model and organized as follows:
1) Pre-school Education, focuses on children aged from 3 to 6 years. This step is relatively new, voluntary and paid. In 2010-2011, there were 42 060 children enrolled in 2154 public preparatory schools whereas they were only 7667 children in 362 schools in 2001-2002.1
1
2) Basic Education consists of nine years of school education and it is specific to schoolchildren aged from 6 to 14 years. It is divided in two stages: 6 years of primary carried out in schools and 3 years of preparatory education called 2nd cycle of basic education (lower secondary). In 2010-2011, there are 469 459 students registered in 827 institutions of 2ndcycle of basic education (colleges).2 The transition of pupils from basic education to secondary education is performed by a nation exam at the end of nine years.
3) Secondary Education, is available for students with the certificate of preparatory school. The first year is a core curriculum for all students but at successive three years, students can specialize in 7 branches (Language arts, Experimental Sciences, Economics, Mathematical, Technical Sciences, Data Processing and Sport). According to the Ministry of Education, in 2010-2011, there were 466 939 students who continue their secondary education in 539 schools and taught by 37 416 teachers. The proportion of students enrolled in secondary education in Tunisia was 53.3 per cent in 2006-2007. At the end of fourth year of secondary studies, students pass a national examination bachelor. Those who succeed this exam will get the baccalaureate diploma that allows them to begin training in public higher education. In 1995, 42.5% of baccalaureate takers were successful.
4) Higher Education, is providing by universities, faculties, schools and institutes. There is also the network Institutes of the higher of Technological Studies (ISET). These universities were established in 1993 and are known by their scientific and technological character. In 2005-2006, the proportion of students enrolled in higher education reached 59%. Whereas, in 2008-2009, there are 3000 students who was enrolled in 13 universities, 193 public higher institutes and 25 private institutes.
In our analysis, we measure the efficiency of public secondary education in the 2nd cycle of basic education in 24 governorates implanted in Tunisia during the period 1999-2000 to 2008-2009through a nonparametric approach (DEA). During this period, the overall number of teachers in public institutes of secondary education and colleges in Tunisia increased around 96.6 per cent and the number of teachers per 100 students increased from 4.7 in 1999 to 7.1 in 2008 (Ministry of Secondary Education). It should be noted also that the efficiency of secondary education can positively influence the labour market in Tunisia, and the number of employed persons with secondary education has also increased nearly 4 percentage points ranging from 32 per cent in 2000 to 36.1 per cent in 2007 (Source: Ministry of Employment, 2008).
2
3. Literature overview
Education is one of the most important functions provided by the government in almost every country. In Tunisia, more than 20 per cent of the governorates budget was allocated to education in 2005-2006. Expenditure used in management and development devoted to education, was set at 3000.221 million dinars (22.8% of GDP) for the year 2011 against 283.844 million dinars (21.22% of GDP) for the year 2010.3
This increase in the value of public expenditures allocated to education makes it essential to analyse how the school resources (education expenditures per student, teacher salaries, pupil/teacher ratio) translate into the success and performance of the students. Hence, it is important to find the right way to improve the efficiency of secondary education, in the 24 Tunisian governorates, without increasing the value and the amount of school resources.
More generally, several studies have examined how resources devoted to secondary education affect efficiency and student achievement using the DEA framework. Afonso and St. Aubyn (2006) studied the efficiency of secondary education in OECD countries by estimating a semi-parametric model of the education production process using a two-stage approach. They specified the relationship between student performance, the inputs used directly in the educational system (number of teachers and the amount of time spent in school) and non-discretionary environmental variables (levels of parental education and GDP per capita). They showed that the non-discretionary inputs influence negatively the efficiency of secondary education in these countries. Therefore, they conclude that inefficiency can be explained, up to some extent, by non-discretionary variables beyond the control of the school such as the level of the country's wealth.
Kirjavainen and Loikkanen (1998) measured the efficiency of 291 Finnish secondary schools using cross section data during the period 1988-1991. They have concluded that efficiency scores of different schools are almost unrelated to average grades in matriculation examination. We can find a school on the efficiency frontier with a low matriculation examination because it uses a small amount of inputs. Another school with a high matriculation examination scores can be considered inefficient since it uses a large amount of inputs. On the other hand, inefficiency can be related to small schools rather than to big schools.
3
Hanushek et al. (1996) evaluated the efficiency of primary and secondary schools in the USA by analysing the relationship between aggregate school resources and student achievement. They concluded that school resources affect positively student’s performance and the addition of more expenses only, doesn’t improve the student learning outcomes.
Rob et al. (1996) assessed the magnitude and the direction of the relationship between school inputs (per-pupil expenditure, teacher’s ability, education, experience, salary, and teacher/pupil ratio and school size) and student output using meta-analysis methods. The analysis found that the null hypothesis (no positive relation exists between resource inputs and student achievement) is rejected for every input variable. This explains that school resources and student achievement are systematically related. The authors conclude also that these relations between school resources and student achievement have an important educational effect.
Barro and Lee (2001), investigate the determinants of educational outcomes in 85 countries by analysing the relationship between input variables composed by family characteristic (income and parent education) and school resources such as pupil-teachers ratios and student performance presented by test scores, school repetition and dropout rates. They indicate that family inputs have a strong effect on student performance and educational outcomes can be improved by more school resources.
The efficiency of higher education was also assessed with the DEA framework. Afonso and Santos (2008) studied the efficiency of 52 public universities Portuguese in 2003. They analysed the effect of school resources (number of teachers per 100 students and the volume of public spending per student) on the success of students graduate and the number of PhDs conferred certificates per 100 teachers using the DEA model. The results show that with variable returns to scale, an increase of the amount of inputs is supposed to provide a disproportionate increase of outputs due to diminishing marginal returns.
McMillan and Datta (1998) evaluated the effectiveness of 45 Canadian universities between 1992 and 1993. They generate composite indicators to study the performance of the education sector from nine different specifications of inputs and outputs. They concluded that the different resources allocation policies used by universities have a significant impact on efficiency.
4. Analytical Framework
existence of a convex production frontier. The major advantages of this model, is that permits the incorporation of several outputs and inputs in the analysis. The main property of the production frontier is that envelops the set of observations. Application of the DEA model, allows the calculation of technical efficiency measures that can be either input or output oriented. For instance, by calculating input oriented scores, one could evaluate by how much the quantity of input can be proportionally reduced without changing the output quantity.
In our case, we will use an output-oriented model to measure the technical efficiency scores of the education system in each governorate during the period 1999-2008. The purpose of an output-oriented study is to evaluate how much the output quantities can be proportionally increased without changing the inputs used. The two measures of output and input oriented models produce reciprocal results under constant returns to scale and different values in the case of variable returns to scale. We will present below, the analytical description of the linear programming problem to be solved, from an output oriented perspective, and assuming variable returns to scale hypothesis:
Suppose that we have for n DMUs, p inputs and q outputs. For the i-th DMU, represents the column vector of the outputs and is the column vector of the inputs. X is defined as the ( ) input matrix and Y as the ( )output matrix. The DEA model is defined with the following mathematical programming problem, for a given i-th DMUs.
SC{
. (1)
In problem (1), is a scalar ( ), it represents the efficiency score that measure technical efficiency of the i-th unit as the distance which connects each decision unit to the efficiency frontier ⁄ defines a TE score which varies between zero and one.
optimal system of weights. The analysis of the ‘peers’ group can differentiate, for instance, between DMUs that are really efficient and others that are efficient by default.
The property of convexity is explained by the constraint , accounting for variable returns to scale (VRS) situations. Dropping of this constraint makes the returns to scale constant (see, for instance, Coelli, 2000, and Coelli et al., 2002).
5. Efficiency analysis of secondary and basic education in Tunisia
5-1 Data and measurement issues
In our study, we estimate the efficiency of secondary education and of the 2nd cycle of basic education in 24 governorates of Tunisia during the period 1999-2008. The choice of variables is important in the DEA model, notably because it is difficult to evaluate the efficiency of DMU when there are multiple inputs and outputs.
It is advisable to measure the result of efficiency across different specifications of variables to know if the performance of a DMU is sensitive to variable selection. Generally, the efficiency of schools is measured by the success rate of students. In our case, we use two output variables:
- The success rate of the baccalaureate exam (the grade obtained at the end of high school) for the period between 1999 and 2008. This success rate, increased from 59.5% in 1999 to 67% in 2008.
- As a second output measure, we used the rate of non-doubling in the 9th year (final exam of 2nd cycle of basic education). This rate changed from 78.2% to 99.8% during the same period of study.
We used these two rates for the 23 governorates of Tunisia from 1999 and 2000. Since 2001, we take in our consideration the new governorate of Manouba that was added to the 23 other governorates (the governorate of Manouba was created in 31July 2000).
In our analysis we employ four input variables. The first variable describes the number of teachers per 100 students. This ratio is used to measure the number of teachers in terms of the level of human resources used in each governorate. It can provide information on the quality and the conditions of teaching. A high teacher-pupils ratio shows that each teacher has to be responsible for a smaller number of students, which may reflect a student higher performance. This physical input varies between 4.4 teachers per 100 students (Ben Arous) to 4.9 teachers per 100 students (Beja, Kef, Tozeur and Mahdia) in 1999.
number of classes in all schools in each governorate. Therefore, higher input levels reflect a lower number of students in each class, and a better possibility for each student to use its time and the teachers’ time. Indeed, it is generally agreed that a large number of classes per 100 students translates into less populated classes which allows the teachers to ensure their courses in good conditions. This can contribute to better student results in the long-term. The variable number of classes per 100 students ranges from 3.4 classes per 100 students (Tunis, Ariana, Ben Arous and Nabeul) to 4.1 classes per 100 students (Mahdia) in 2008. While it varied between 2.9 classes per 100 students (Tunis and Ben Arous) to 3.2 classes per 100 students (Beja, Tataouine, Mahdia and Monastir) in 1999.
The third input variable used in our analysis describes number of schools per 1 000 000 inhabitants in each governorate during the period 1999-2008. The quality of education assured in schools is related to the number of schools per inhabitants. In 1999, this variable ranges from 82.3 schools per million inhabitants (Kairouan) to 199.7 schools per million inhabitants (Kbeli).
Education costs have been largely calculated by economists to estimate its profitability. Education expenditure is an important public spending item. Therefore, together with the physical input variables, we also used another input that measures education spending per student for each governorate, covering expenditures where devoted to equipping schools (construction, creation and extension of schools and classrooms4).
As we reported for the outputs, the inputs where also used for 23 governorates of Tunisia from 1999-2008. Since 2001, we added the new governorate of Manouba to our database. The only specificity is that the variable spending per student is missing for the year 2000 given the unavailability of data from the Ministry of Finance.
5-2 DEA results of efficiency analysis
In the use of DEA it is important to consider the options of constant returns and variable to scale. Under the assumption of constant returns to scale, there is not a significant relation between the scale of operations and efficiency. In this case, the quantity of output produced, increases in the same proportion to the quantity of inputs used during the production process. On the other hand, the hypothesis of variable returns to scale assumes that an increase in the amount of input used leads to a disproportionate increase in the amount of output produced by a decision unit.
We report in this paper output oriented results to assess the amount of output that can be proportionally increased without changing the amount of input used.
In model 1, we used 3 input variables (number of teachers per 100 students, number of classes per 100 students, and number of schools per million inhabitants), and 2 output variables (success rate of baccalaureate exam, and rate of non-doubling in the 9th year) during the period 1999 to 2008. The results show that in 1999, the efficiency frontier is composed by two governorates: Sfax and Ben Arous. The governorates of Tunis, Medenine and Kairouan are efficient with default. They did not constitute peers of any other governorate in 1999 (see the Appendix tables for an overview of the peers). From Table 1 we observe that the average output efficient score of the country in 1999 equals 0.889 which explains that with the same quantity of input used, the average of the country seems to be obtaining a performance about 11.11 per cent less than it should if it were on the efficiency frontier. In 2008, the average output efficient score increased about 10 per cent compared to 1999. In this year the efficiency frontier is composed by Tunis, Nabeul, Zaghouan, Sousse, Mahdia and Sfax.
[Table 1]
On average during the period from 2001 to 2004, on the production possibility frontier, we find 4 governorates: Sfax, Nabeul, Ben Arous and Manouba. While during the last four year of the estimation period we notice the appearance of two other governorates: Zaghouan and Mahdia on the efficiency frontier and the elimination of the governorate of Manouba (see Table10). In order to conclude the role of the variable (education expenditures per student) on the output efficient score, we have added it to the estimation of DEA model. The results are reported in Table 9.
In model 9, we include 4 input variables (Number of teachers/100 students, number of classes/ 100 students, number of schools per million inhabitants and education expenditures per students) and 2 output variables (success rate of baccalaureate exam and rate of non-doubling in the 9th year) during the period from 1999 to 2008. Compared to the model 1, we notice that the output efficient score was improved in most of governorates in CRS and VRS assumptions. For example, in 1999 the average VRS efficiency score increased by 1.2 per cent.
used, the average of country seems to be obtaining a performance about 10 per cent less than it should if it were on the efficiency frontier.
In 2008, the efficiency frontier is formed by 6 governorates: Tunis, Nabeul, Sfax, Zaghouan, Sousse and Mahdia. In this year, the average output efficient score is equal to 0.982 which means with the same inputs, the average of country seems to be obtained a performance about 1.8% per cent less than it should if it were on the efficiency frontier. This indicates an improvement on the average of output efficient score compared to 1999 (see table 1).
On average, during the period from 2001 to 2004, the empirical production function includes 5 governorates: Sfax, Nabeul, Manouba, Ben Arous and Monastir. Hence we notice the appearance of the governorate of Monastir on the efficiency frontier compared to the model 1.
While the governorates of Tunis, Bizerte and Medenine are considered efficient by default. During the last four year of the estimation period (2005-2008), the efficiency frontier is composed an average by Nabeul, Sfax, Ben Arous, Zaghouan and Mahdia, the same governorates that compose the efficiency frontier in model 1 (see table 9).
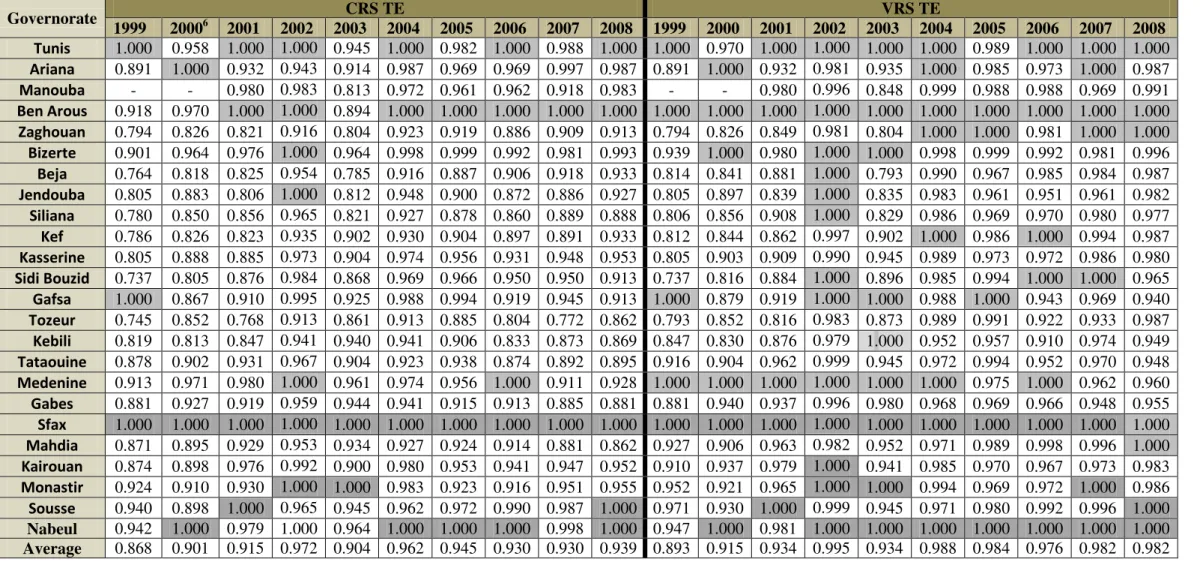
In model 2, we introduce 3 input variables (teachers per 100 students, classes per 100 students and education expenditures per student) and two output variables (success rate of baccalaureate exam and rate of non-doubling in 9th year). To conclude the role of the variable: number of schools per million inhabitants (missing in model 2), on the output efficient score, we compare the results to those of model 9 that include the missing variable. The addition of the variable “numbers of schools per inhabitants “improves the output efficient score compared to model 2. For example, in 1999 and 2001, the average of output efficient score increased from 0.893 to 0.900 (VRS) and from 0.934 to 0.938 (VRS) respectively compared to model 2.
[Table 2]
In model 9, most governorates have been marked in 2003 by a significant increase on the efficiency scores compared to model 2. In 2001, the governorate of Nabeul was dominated by Sfax and Ben Arous in model 2 and this one of Bizerte was dominated by Ben Arous. The introduction of the variable “number of schools per million inhabitants” to the estimation of DEA in model 9 makes these two governorates efficient.
frontier (model 9) added to those of Sfax, Ben Arous, Monastir and Nabeul defining the efficiency frontier in model 2 (see Table 10).
In model 3, we introduce only three input variables (number of teachers per 100 students, number of schools per million inhabitants and education expenditures per students) and two output variables. Comparing the results of model 3 with those of model 9 that include 4 input variables, we note that the addition of the variable number of classes per 100 students in model 9 improves the output efficient score in most governorates. The growth rate of average output efficient score between the model 9 and 3 varied from 0.9 per cent in 2004 to 9.8 per cent in 2001 (CRS) and from 0.5 per cent in 2002 to 7.9 per cent in 1999 (VRS).
[Table 3]
By comparing the results on average from 2001 to 2004 between the model 9 which has four input variables and model 3 that have just 3 inputs, we can see one more governorate is located on the efficiency frontier: Manouba.
In model 4, we use as input variables “number of classes per 100 students, number of schools per million inhabitants and education expenditures per student) and two output variables (success rate of baccalaureate exam and rate of non-doubling in the 9thyear).
The addition of the variable number of teacher per 100 students in model 9 shows in increase in the output efficient score in most governorates. For example the average of output efficient score in 1999 and 2005 improved by 1.8% and 0.1% (VRS) respectively compared to model 4. In 2008, the average output efficient score equals 0.982, which indicates that with the same quantity of inputs used, the average of country seems to be obtaining a performance about 1.8 per cent less than it should if it were on the efficiency frontier.
[Table 4]
The results of average from 2001 to 2004 and from 2005 to 2008 did not shows a large differences in the location of governorates on the efficiency frontier between the two models 4 and 9.The only difference is that the governorate of Tunis became efficient by default in the model 9 while it was on the production possibility of frontier on average from 2001 to 2004.
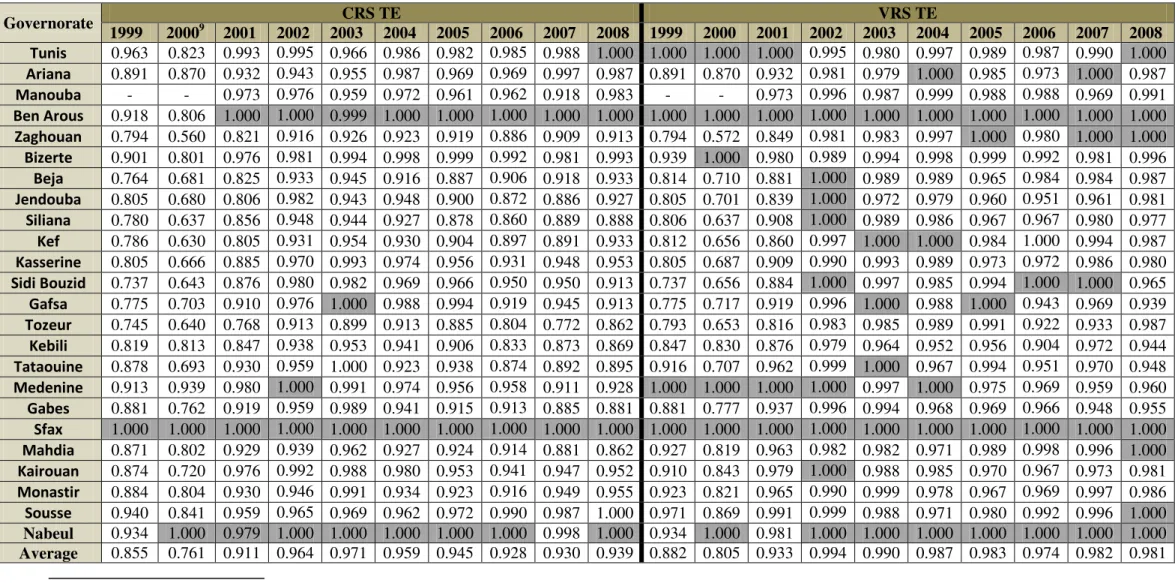
In model 5, we are interested in estimating the DEA model during the period from 1999 to 2008 with only two input variables number of teachers per 100 students and number of classes per 100 students and two output variables: success rate of baccalaureate exam and rate of non-doubling in 9th year.
[Table 5]
inhabitants and education expenditures per students. We notice an increase in the output efficient scores in the most of the governorates over the period from 1999 to 2008. The increase on average output efficient score ranged in VRS from 0.1 per cent (2004, 2007 and 2008) to 2 per cent in 1999 compared to model 5.
With the addition of the two variables of inputs in model 9, we can see that as expected, two more governorates are located in the empirical production possibility frontier: Manouba and Monastir (the average of 2001 to 2004). By referring to previous analysis, it was found that the governorate of Manouba is added to the efficiency frontier with the addition of the variable number of schools missing in model 2. The governorate of Monastir is also added to the empirical production possibility frontier with addition of the variable education expenditures per student missing in model 1.
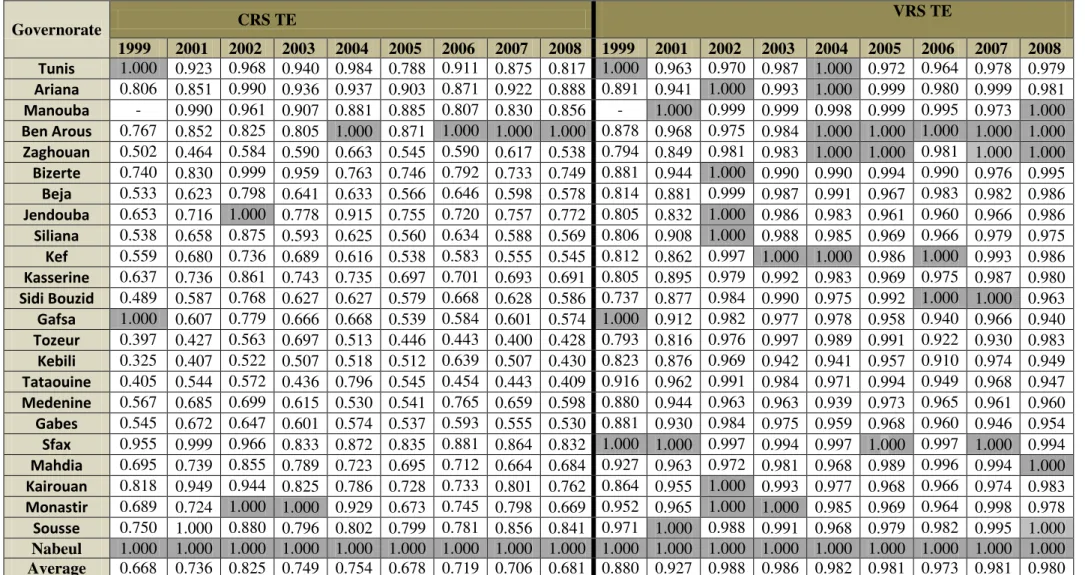
We use two input variables (number of schools per million inhabitants and education expenditures per student) and one variable of output: success rate of baccalaureate exam in model 6. With the addition of the two input variables (number of teachers and classes per 100 students) and one output (rate of non-doubling of 9thyear) in model 9, we notice an important increase in the output efficient score for the most of governorates. In 2008, the average of output efficient score equals 0.819 (VRS) which means that with the same quantity of input used, the country was capable of increasing its average production output of 18.1 per cent.
[Table 6]
In model 9 we observe the appearance of two governorates: Manouba and Ben Arous on the empirical production possibility frontier (on average 2001-2004). On average (2005-2008), we notice two more governorates are located on the empirical production possibility frontier: Zaghouan and Mahdia.
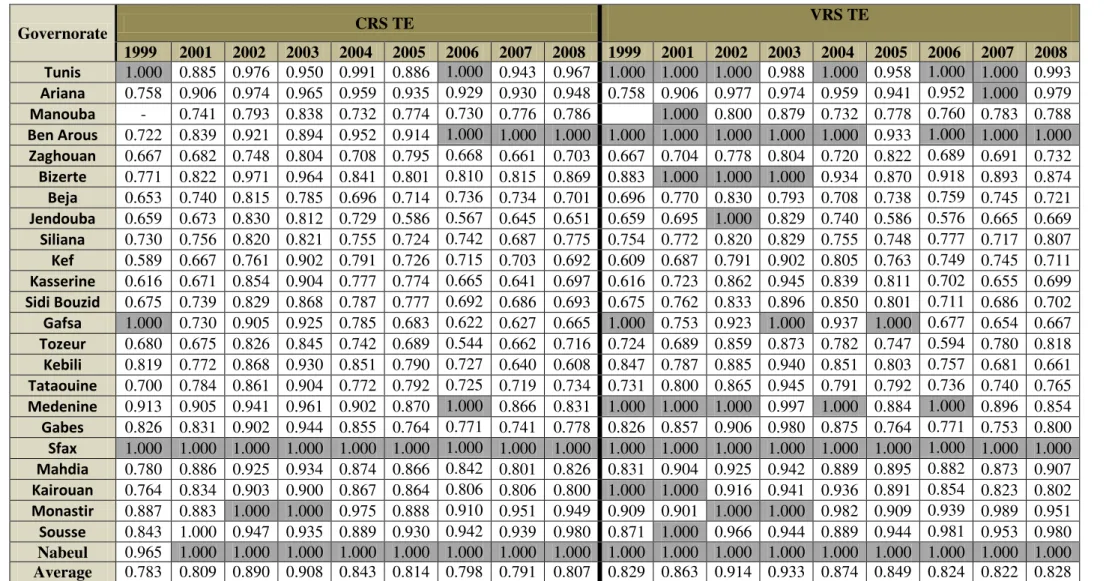
The addition of two variables missing in model 6 (number of teachers per 100 students and number of classes per 100 students) and keeping the same variable of output (success rate of baccalaureate exam) in model 7 makes us to conclude also an improved efficiency scores compared to model 6. For example, in 1999 the average of output efficient score passed from 0.795 in model 6 to 0.829 in model 7.
[Table 7]
We notice that output efficient scores in most of DMUs in model 8 are greater than those in model 6.
[Table 8]
This modification in the variable of output did not cause a change in governorates located on the efficiency frontier (on average 2001-2004) but we notice in model 8 the appearance of the governorate of Zaghouan on the empirical production possibility frontier compared to the model 6 (average 2005-2008).
[Table 9]
To conclude, we note that there is a positive relationship between school resources and student achievement. Adding the school resources and education expenditures per students improves the efficiency scores in most models. We note also that the governorate of Sfax is on the efficiency frontier in all the specifications of input and output.
[Table 10, 11]
6. Conclusion
In this paper, we employ a non-parametric approach, Data Envelopment Analysis to evaluate the efficiency of basic and secondary education in 24 governorates of Tunisia over the period 1999-2008. The input measures provide information on the amount of human resources invested in terms of students compared to the number of teachers and classes (number of teachers per 100 students and number of classes per 100 students). Another input variable describes the number of schools per million inhabitants in each governorate. To measure the basic and secondary education costs, we have introduced education spending per student in each governorate. As output measures, we have used the success rate of the baccalaureate exam and the rate of non-doubling in the 9th year.
In order to analyse the relationship between school resources and student’s success, we used 9 specifications of inputs and outputs. We concluded that school resources affect positively the student’s performance and success from an efficiency point of view. In 1999, the average efficiency score of the country was increased by 1.1 and 1.5 per cent in VRS and CRS respectively. We note also the appearance of the governorate of Monastir on the efficiency frontier on average during the period 2001-2004.
the average of country seems to be obtaining a performance about 1.8 per cent less than it should if it were located on the production possibility frontier.
The introduction of the two input variables “number of teachers per 100 students and number of classes per 100 students” to the estimation of DEA model allows to conclude an important increase of the output efficiency score in most governorates through the period from 1999 to 2008.For example, in 1999, the output efficient score of the country passed on average from 0.795 to 0.829. This explains that these two variables like the other school resources improve the student performance.
Adding the variables number of teachers per 100 students and number of classes per 100 students improves the output efficient score in most governorates through the period from 1999 to 2008. In 1999, the output efficient score passed from 0.795 to 0.829 and from 0.806 to 0.822 in 2007.
As we noted before, the application of the DEA model allows distinguishing between governorates that are considered efficient in terms of basic and secondary education from those which need some improvement to locate on the efficiency frontier. Between 2001 and 2004, the efficiency frontier was constructed on average by the governorates of: Tunis, Ben Arous, Nabeul, Monastir, Manouba, Medenine and Sfax and by the governorates of Nabeul, Ben Arous, Zaghouan, Mahdia and Sfax during the period 2005 to 2008. The governorate of Sfax is considered efficient in all the specifications of inputs and outputs.
References
Afonso, A. and Santos, M. (2008). “A DEA approach to the relative efficiency of Portuguese public universities,” Portuguese Journal of Management Studies, 13 (1), 67-88.
Afonso, A. and St. Aubyn, M. (2005). “Non-parametric approaches to education and health Efficiency on OECD countries,”Journal of Applied Economics, .8 (2), 227-246.
Afonso, A. and St. Aubyn, M. (2006). “Cross-country of secondary education provision: A semi-parametric analysis with non-discretionary inputs,” Economic Modelling 23,476-491.
Barro, R. and Lee, J.-W. (2001). “Schooling Quality in a Cross-Section of Countries”,
Economica, 68 (271), 465-488.
Charnes, A. and Cooper, W. Rhodes, E. (1978). “Measuring the efficiency of decision making units”, European Journal of Operational Research 2, 429–444.
Coelli, T. (1996). “A guide to DEAP version 2.1: “A Data Envelopment Analysis (computer) Program”, Centre for Efficiency and Productivity Analysis, Department of Econometrics, Armidale, NSW, 2351.
Coelli, T.; Rao, D. and Battese, G. (2002). An Introduction to Efficiency and Productivity Analysis, 6th edition, Massachusetts, Kluwer Academic Publishers.
Hanushek, E. (1996). “Measuring Investment in Education,” Journal of Economic Perspectives, 10 (4), 9-30.
Kirjavainen, T. and Loikkanen, H. (1998). “Efficiency differences of Finnish senior secondary schools: an application of DEA and Tobit analysis”, Economics of Education Review 17, 377–394.
McMillan, M. and Datta, D. (1998).“The relative efficiencies of Canadian Universities: a DEA perspective,” Canadian Public Policy, 24 (4), 485-511.
National Report on Development of Education (2000-2004). Ministry of Education and Training in Tunisia.
Table 1: Model 1 (Inputs, Teachers/100 students, Classes /100 students, Number of schools per million inhabitants, Outputs, success rate of baccalaureate exam and rate of non-doubling in the 9th year)
Governorate CRS TE VRS TE
1999 20005 2001 2002 2003 2004 2005 2006 2007 2008 1999 2000 2001 2002 2003 2004 2005 2006 2007 2008 Tunis 0.963 0.959 0.993 1.000 0.983 0.987 0.982 0.985 0.988 1.000 1.000 1.000 1.000 1.000 0.988 1.000 0.989 0.987 0.990 1.000
Ariana 0.891 1.000 0.941 0.990 0.967 1.000 0.978 0.972 1.000 0.989 0.891 1.000 0.941 1.000 0.994 1.000 0.999 0.981 1.000 0.989
Manouba - - 0.976 0.995 0.998 0.990 0.977 0.967 0.926 0.985 - - 0.993 0.996 1.000 0.999 0.999 0.995 0.973 1.000
Ben Arous 0.918 0.970 1.000 1.000 1.000 1.000 1.000 1.000 1.000 1.000 1.000 1.000 1.000 1.000 1.000 1.000 1.000 1.000 1.000 1.000
Zaghouan 0.794 0.826 0.821 0.916 0.927 0.923 0.919 0.886 0.909 0.913 0.794 0.826 0.849 0.981 0.983 0.997 1.000 0.980 1.000 1.000
Bizerte 0.901 0.964 0.977 0.981 0.994 0.998 0.999 0.992 0.981 0.993 0.939 0.994 1.000 0.989 0.994 0.998 0.999 0.992 0.981 0.996
Beja 0.764 0.818 0.825 0.933 0.946 0.916 0.887 0.906 0.918 0.933 0.814 0.841 0.881 1.000 0.991 0.990 0.966 0.984 0.984 0.987
Jendouba 0.805 0.883 0.814 0.986 0.947 0.949 0.905 0.875 0.888 0.927 0.805 0.897 0.839 1.000 0.986 0.981 0.961 0.960 0.966 0.986
Siliana 0.780 0.850 0.856 0.948 0.946 0.927 0.878 0.860 0.889 0.888 0.806 0.856 0.908 1.000 0.991 0.986 0.967 0.967 0.980 0.977
Kef 0.786 0.826 0.805 0.931 0.954 0.930 0.904 0.897 0.891 0.933 0.812 0.844 0.860 0.997 1.000 1.000 0.984 1.000 0.994 0.987
Kasserine 0.805 0.888 0.889 0.977 0.997 0.974 0.956 0.931 0.948 0.953 0.805 0.903 0.909 0.990 1.000 0.989 0.973 0.975 0.988 0.980
Sidi Bouzid 0.737 0.805 0.876 0.980 0.982 0.969 0.966 0.950 0.950 0.913 0.737 0.816 0.884 1.000 1.000 0.985 0.994 1.000 1.000 0.965
Gafsa 0.775 0.867 0.910 0.976 1.000 0.988 0.994 0.919 0.945 0.913 0.775 0.879 0.919 0.996 1.000 0.988 1.000 0.943 0.969 0.939
Tozeur 0.745 0.852 0.768 0.913 0.899 0.913 0.885 0.804 0.772 0.862 0.793 0.852 0.816 0.983 0.985 0.989 0.991 0.922 0.933 0.987
Kebili 0.819 0.813 0.847 0.938 0.953 0.941 0.906 0.833 0.873 0.869 0.847 0.830 0.876 0.979 0.964 0.952 0.956 0.904 0.972 0.944
Tataouine 0.878 0.902 0.930 0.959 1.000 0.923 0.938 0.874 0.892 0.895 0.916 0.904 0.962 0.999 1.000 0.967 0.994 0.951 0.970 0.948
Medenine 0.913 0.971 0.980 1.000 0.991 0.974 0.956 0.958 0.911 0.928 1.000 1.000 1.000 1.000 0.997 1.000 0.975 0.969 0.959 0.960
Gabes 0.881 0.927 0.919 0.959 0.989 0.941 0.915 0.913 0.885 0.881 0.881 0.940 0.937 0.996 0.994 0.968 0.969 0.966 0.948 0.955
Sfax 1.000 1.000 1.000 1.000 1.000 1.000 1.000 1.000 1.000 1.000 1.000 1.000 1.000 1.000 1.000 1.000 1.000 1.000 1.000 1.000
Mahdia 0.871 0.895 0.929 0.939 0.962 0.927 0.924 0.914 0.881 0.862 0.927 0.906 0.963 0.982 0.983 0.972 0.989 0.999 0.996 1.000
Kairouan 0.874 0.898 0.990 1.000 0.996 0.980 0.953 0.941 0.947 0.952 1.000 0.919 1.000 1.000 0.998 0.985 0.971 0.967 0.974 0.982
Monastir 0.884 0.910 0.930 0.946 0.991 0.934 0.923 0.916 0.949 0.955 0.923 0.921 0.965 0.990 0.999 0.979 0.967 0.969 0.997 0.986
Sousse 0.940 0.900 0.959 0.965 0.971 0.963 0.972 0.990 0.987 1.000 0.971 0.930 0.991 0.999 0.993 0.971 0.980 0.992 0.996 1.000
Nabeul 1.000 0.953 1.000 1.000 1.000 1.000 1.000 1.000 1.000 1.000 1.000 0.963 1.000 1.000 1.000 1.000 1.000 1.000 1.000 1.000
Average 0.858 0.899 0.914 0.968 0.975 0.960 0.947 0.928 0.930 0.939 0.889 0.914 0.937 0.995 0.993 0.987 0.984 0.975 0.982 0.982
5
Table 2: Model 2 (Inputs, Teachers/100 students, Classes /100 students and Education expenditures per students, Outputs, success rate of baccalaureate exam and rate of non-doubling in the 9th year).
Governorate CRS TE VRS TE
1999 20006 2001 2002 2003 2004 2005 2006 2007 2008 1999 2000 2001 2002 2003 2004 2005 2006 2007 2008
Tunis 1.000 0.958 1.000 1.000 0.945 1.000 0.982 1.000 0.988 1.000 1.000 0.970 1.000 1.000 1.000 1.000 0.989 1.000 1.000 1.000
Ariana 0.891 1.000 0.932 0.943 0.914 0.987 0.969 0.969 0.997 0.987 0.891 1.000 0.932 0.981 0.935 1.000 0.985 0.973 1.000 0.987
Manouba - - 0.980 0.983 0.813 0.972 0.961 0.962 0.918 0.983 - - 0.980 0.996 0.848 0.999 0.988 0.988 0.969 0.991
Ben Arous 0.918 0.970 1.000 1.000 0.894 1.000 1.000 1.000 1.000 1.000 1.000 1.000 1.000 1.000 1.000 1.000 1.000 1.000 1.000 1.000
Zaghouan 0.794 0.826 0.821 0.916 0.804 0.923 0.919 0.886 0.909 0.913 0.794 0.826 0.849 0.981 0.804 1.000 1.000 0.981 1.000 1.000
Bizerte 0.901 0.964 0.976 1.000 0.964 0.998 0.999 0.992 0.981 0.993 0.939 1.000 0.980 1.000 1.000 0.998 0.999 0.992 0.981 0.996
Beja 0.764 0.818 0.825 0.954 0.785 0.916 0.887 0.906 0.918 0.933 0.814 0.841 0.881 1.000 0.793 0.990 0.967 0.985 0.984 0.987
Jendouba 0.805 0.883 0.806 1.000 0.812 0.948 0.900 0.872 0.886 0.927 0.805 0.897 0.839 1.000 0.835 0.983 0.961 0.951 0.961 0.982
Siliana 0.780 0.850 0.856 0.965 0.821 0.927 0.878 0.860 0.889 0.888 0.806 0.856 0.908 1.000 0.829 0.986 0.969 0.970 0.980 0.977
Kef 0.786 0.826 0.823 0.935 0.902 0.930 0.904 0.897 0.891 0.933 0.812 0.844 0.862 0.997 0.902 1.000 0.986 1.000 0.994 0.987
Kasserine 0.805 0.888 0.885 0.973 0.904 0.974 0.956 0.931 0.948 0.953 0.805 0.903 0.909 0.990 0.945 0.989 0.973 0.972 0.986 0.980
Sidi Bouzid 0.737 0.805 0.876 0.984 0.868 0.969 0.966 0.950 0.950 0.913 0.737 0.816 0.884 1.000 0.896 0.985 0.994 1.000 1.000 0.965
Gafsa 1.000 0.867 0.910 0.995 0.925 0.988 0.994 0.919 0.945 0.913 1.000 0.879 0.919 1.000 1.000 0.988 1.000 0.943 0.969 0.940
Tozeur 0.745 0.852 0.768 0.913 0.861 0.913 0.885 0.804 0.772 0.862 0.793 0.852 0.816 0.983 0.873 0.989 0.991 0.922 0.933 0.987
Kebili 0.819 0.813 0.847 0.941 0.940 0.941 0.906 0.833 0.873 0.869 0.847 0.830 0.876 0.979 1.000 0.952 0.957 0.910 0.974 0.949
Tataouine 0.878 0.902 0.931 0.967 0.904 0.923 0.938 0.874 0.892 0.895 0.916 0.904 0.962 0.999 0.945 0.972 0.994 0.952 0.970 0.948
Medenine 0.913 0.971 0.980 1.000 0.961 0.974 0.956 1.000 0.911 0.928 1.000 1.000 1.000 1.000 1.000 1.000 0.975 1.000 0.962 0.960
Gabes 0.881 0.927 0.919 0.959 0.944 0.941 0.915 0.913 0.885 0.881 0.881 0.940 0.937 0.996 0.980 0.968 0.969 0.966 0.948 0.955
Sfax 1.000 1.000 1.000 1.000 1.000 1.000 1.000 1.000 1.000 1.000 1.000 1.000 1.000 1.000 1.000 1.000 1.000 1.000 1.000 1.000
Mahdia 0.871 0.895 0.929 0.953 0.934 0.927 0.924 0.914 0.881 0.862 0.927 0.906 0.963 0.982 0.952 0.971 0.989 0.998 0.996 1.000
Kairouan 0.874 0.898 0.976 0.992 0.900 0.980 0.953 0.941 0.947 0.952 0.910 0.937 0.979 1.000 0.941 0.985 0.970 0.967 0.973 0.983
Monastir 0.924 0.910 0.930 1.000 1.000 0.983 0.923 0.916 0.951 0.955 0.952 0.921 0.965 1.000 1.000 0.994 0.969 0.972 1.000 0.986
Sousse 0.940 0.898 1.000 0.965 0.945 0.962 0.972 0.990 0.987 1.000 0.971 0.930 1.000 0.999 0.945 0.971 0.980 0.992 0.996 1.000
Nabeul 0.942 1.000 0.979 1.000 0.964 1.000 1.000 1.000 0.998 1.000 0.947 1.000 0.981 1.000 1.000 1.000 1.000 1.000 1.000 1.000
Average 0.868 0.901 0.915 0.972 0.904 0.962 0.945 0.930 0.930 0.939 0.893 0.915 0.934 0.995 0.934 0.988 0.984 0.976 0.982 0.982
6
Table 3: Model 3 (Inputs, Teachers/100 students, Number of schools per million inhabitants and Education expenditures per students, Outputs, success rate of baccalaureate exam and rate of non-doubling in the 9th year).
Governorate CRS TE VRS TE
1999 20007 2001 2002 2003 2004 2005 2006 2007 2008 1999 2000 2001 2002 2003 2004 2005 2006 2007 2008 Tunis 1.000 0.959 0.992 1.000 0.959 1.000 0.955 0.974 0.951 0.971 1.000 1.000 1.000 1.000 0.987 1.000 0.973 0.984 0.978 0.982
Ariana 0.873 1.000 0.909 0.990 0.955 0.959 0.962 0.972 0.978 0.958 0.891 1.000 0.941 1.000 0.994 1.000 0.999 0.981 0.999 0.981
Manouba - - 0.991 0.987 0.944 0.942 0.944 0.922 0.914 0.939 - - 1.000 0.999 0.999 0.998 0.999 0.995 0.973 1.000
Ben Arous 0.918 0.929 1.000 1.000 1.000 1.000 1.000 1.000 1.000 1.000 1.000 0.971 1.000 1.000 1.000 1.000 1.000 1.000 1.000 1.000
Zaghouan 0.761 0.799 0.781 0.894 0.926 0.923 0.909 0.886 0.909 0.913 0.794 0.826 0.849 0.981 0.983 1.000 1.000 0.981 1.000 1.000
Bizerte 0.901 0.892 0.977 1.000 1.000 0.998 0.981 0.976 0.981 0.992 0.939 0.892 1.000 1.000 1.000 0.998 0.998 0.990 0.981 0.996
Beja 0.764 0.789 0.820 0.943 0.944 0.916 0.877 0.887 0.918 0.909 0.814 0.841 0.881 1.000 0.989 0.991 0.967 0.985 0.984 0.986
Jendouba 0.805 0.796 0.814 1.000 0.947 0.949 0.905 0.875 0.888 0.904 0.805 0.849 0.839 1.000 0.986 0.983 0.961 0.960 0.966 0.986
Siliana 0.773 0.781 0.856 0.965 0.946 0.927 0.878 0.860 0.889 0.888 0.806 0.833 0.908 1.000 0.991 0.986 0.969 0.970 0.980 0.977
Kef 0.762 0.791 0.821 0.916 0.954 0.929 0.879 0.890 0.889 0.909 0.812 0.844 0.862 0.997 1.000 1.000 0.986 1.000 0.994 0.986
Kasserine 0.805 0.825 0.889 0.968 0.995 0.974 0.956 0.931 0.948 0.951 0.805 0.852 0.909 0.984 1.000 0.989 0.973 0.975 0.988 0.980
Sidi Bouzid 0.737 0.776 0.856 0.960 0.981 0.969 0.962 0.946 0.949 0.900 0.737 0.776 0.884 0.990 1.000 0.985 0.994 1.000 1.000 0.963
Gafsa 1.000 0.837 0.883 0.966 1.000 0.988 0.962 0.917 0.944 0.912 1.000 0.837 0.919 0.992 1.000 0.988 0.962 0.943 0.969 0.940
Tozeur 0.745 0.799 0.768 0.892 0.910 0.885 0.858 0.774 0.753 0.801 0.793 0.852 0.816 0.983 0.997 0.989 0.991 0.922 0.933 0.987
Kebili 0.811 0.803 0.836 0.918 0.952 0.916 0.888 0.779 0.836 0.806 0.847 0.830 0.876 0.979 0.964 0.950 0.957 0.910 0.974 0.949
Tataouine 0.878 0.848 0.916 0.966 1.000 0.923 0.931 0.869 0.892 0.861 0.916 0.904 0.962 0.999 1.000 0.972 0.994 0.952 0.970 0.947
Medenine 0.913 0.939 0.980 0.953 0.985 0.940 0.946 0.967 0.900 0.881 1.000 1.000 1.000 0.979 0.988 0.952 0.975 1.000 0.962 0.960
Gabes 0.863 0.895 0.919 0.959 0.978 0.938 0.908 0.881 0.885 0.879 0.881 0.895 0.937 0.996 0.992 0.968 0.969 0.964 0.948 0.955
Sfax 1.000 1.000 1.000 1.000 1.000 1.000 1.000 1.000 1.000 1.000 1.000 1.000 1.000 1.000 1.000 1.000 1.000 1.000 1.000 1.000
Mahdia 0.871 0.850 0.929 0.953 0.962 0.927 0.922 0.914 0.881 0.862 0.927 0.906 0.963 0.982 0.983 0.972 0.989 0.999 0.996 1.000
Kairouan 0.874 0.847 0.991 1.000 0.991 0.977 0.952 0.927 0.947 0.939 1.000 0.847 1.000 1.000 0.998 0.985 0.971 0.966 0.974 0.983
Monastir 0.924 0.863 0.930 1.000 1.000 0.983 0.923 0.916 0.951 0.955 0.952 0.921 0.965 1.000 1.000 0.994 0.969 0.972 1.000 0.986
Sousse 0.930 0.900 1.000 0.955 0.965 0.942 0.971 0.958 0.987 1.000 0.971 0.930 1.000 0.999 0.993 0.970 0.980 0.985 0.996 1.000
Nabeul 1.000 1.000 1.000 1.000 1.000 1.000 1.000 1.000 1.000 1.000 1.000 1.000 1.000 1.000 1.000 1.000 1.000 1.000 1.000 1.000
Average 0.866 0.866 0.911 0.966 0.971 0.954 0.936 0.917 0.925 0.922 0.900 0.896 0.938 0.994 0.993 0.986 0.982 0.976 0.982 0.981
7
Table 4: Model 4 (Inputs: Classes /100 students, Number of schools per million inhabitants and Education expenditures per students, Outputs, success rate of baccalaureate exam and rate of non-doubling in the 9th year).
Governorate CRS TE VRS TE
1999 20008 2001 2002 2003 2004 2005 2006 2007 2008 1999 2000 2001 2002 2003 2004 2005 2006 2007 2008 Tunis 1.000 0.823 1.000 1.000 0.992 1.000 0.982 1.000 0.988 1.000 1.000 1.000 1.000 1.000 0.993 1.000 0.989 1.000 1.000 1.000
Ariana 0.891 0.870 0.941 0.990 0.967 1.000 0.978 0.964 1.000 0.989 0.891 0.870 0.941 1.000 0.994 1.000 0.999 0.981 1.000 0.989
Manouba - - 0.991 1.000 0.998 0.990 0.977 0.967 0.926 0.985 - - 1.000 1.000 1.000 0.999 0.999 0.995 0.973 1.000
Ben Arous 0.908 0.782 1.000 1.000 0.982 1.000 1.000 1.000 1.000 1.000 0.944 0.927 1.000 1.000 0.990 1.000 1.000 1.000 1.000 1.000
Zaghouan 0.794 0.554 0.821 0.916 0.892 0.920 0.919 0.879 0.898 0.900 0.794 0.572 0.849 0.981 0.983 1.000 1.000 0.981 1.000 1.000
Bizerte 0.881 0.751 0.975 1.000 1.000 0.966 0.999 0.992 0.951 0.987 0.881 0.751 0.977 1.000 1.000 0.991 0.999 0.992 0.977 0.996
Beja 0.763 0.665 0.825 0.941 0.924 0.913 0.887 0.906 0.881 0.931 0.814 0.710 0.881 1.000 0.991 0.991 0.967 0.985 0.983 0.987
Jendouba 0.779 0.624 0.780 1.000 0.926 0.929 0.887 0.855 0.867 0.926 0.805 0.666 0.832 1.000 0.986 0.983 0.961 0.960 0.966 0.986
Siliana 0.780 0.597 0.850 0.947 0.900 0.907 0.863 0.842 0.855 0.875 0.806 0.637 0.908 1.000 0.988 0.985 0.969 0.970 0.980 0.977
Kef 0.786 0.615 0.817 0.935 0.920 0.925 0.904 0.897 0.891 0.931 0.812 0.656 0.862 0.997 1.000 1.000 0.986 1.000 0.994 0.987
Kasserine 0.779 0.631 0.865 0.978 0.989 0.960 0.943 0.920 0.935 0.948 0.805 0.652 0.895 0.990 1.000 0.987 0.970 0.975 0.987 0.980
Sidi Bouzid 0.737 0.630 0.876 0.984 0.956 0.956 0.966 0.950 0.950 0.910 0.737 0.630 0.877 1.000 0.998 0.983 0.992 1.000 1.000 0.965
Gafsa 1.000 0.688 0.910 0.989 1.000 0.988 0.994 0.919 0.945 0.908 1.000 0.688 0.912 1.000 1.000 0.988 1.000 0.943 0.969 0.940
Tozeur 0.721 0.612 0.764 0.913 0.922 0.913 0.885 0.804 0.772 0.862 0.793 0.653 0.816 0.983 0.997 0.989 0.991 0.922 0.933 0.987
Kebili 0.819 0.803 0.847 0.940 0.943 0.941 0.906 0.833 0.873 0.869 0.847 0.830 0.876 0.979 0.963 0.952 0.957 0.910 0.974 0.949
Tataouine 0.859 0.663 0.931 0.959 0.942 0.915 0.938 0.874 0.869 0.895 0.916 0.707 0.962 0.999 0.996 0.972 0.994 0.952 0.970 0.948
Medenine 0.893 0.910 0.976 1.000 0.990 0.974 0.956 1.000 0.911 0.928 0.893 1.000 1.000 1.000 0.997 1.000 0.974 1.000 0.962 0.960
Gabes 0.881 0.746 0.899 0.951 0.989 0.923 0.915 0.913 0.873 0.877 0.881 0.746 0.930 0.993 0.994 0.964 0.968 0.966 0.948 0.955
Sfax 1.000 1.000 1.000 1.000 1.000 1.000 1.000 1.000 1.000 1.000 1.000 1.000 1.000 1.000 1.000 1.000 1.000 1.000 1.000 1.000
Mahdia 0.869 0.767 0.902 0.916 0.939 0.907 0.919 0.906 0.851 0.849 0.927 0.819 0.963 0.982 0.983 0.972 0.989 0.999 0.996 1.000
Kairouan 0.864 0.714 0.981 1.000 0.991 0.961 0.949 0.941 0.920 0.949 0.864 0.714 1.000 1.000 0.997 0.980 0.969 0.967 0.974 0.983
Monastir 0.882 0.770 0.904 1.000 1.000 0.983 0.901 0.897 0.914 0.925 0.952 0.821 0.965 1.000 1.000 0.994 0.969 0.972 1.000 0.986
Sousse 0.940 0.841 1.000 0.964 0.971 0.963 0.970 0.990 0.977 0.993 0.971 0.869 1.000 0.999 0.993 0.971 0.979 0.992 0.995 1.000
Nabeul 1.000 1.000 1.000 1.000 1.000 1.000 1.000 1.000 1.000 1.000 1.000 1.000 1.000 1.000 1.000 1.000 1.000 1.000 1.000 1.000
Average 0.862 0.742 0.911 0.972 0.964 0.956 0.943 0.927 0.919 0.935 0.884 0.779 0.935 0.996 0.993 0.988 0.984 0.978 0.983 0.982
8
Table 5: Model 5 (Inputs, Teachers/100 students and Classes /100 students, Outputs, Success rate of baccalaureate exam and rate of non-doubling in the 9thyear).
Governorate CRS TE VRS TE
1999 20009 2001 2002 2003 2004 2005 2006 2007 2008 1999 2000 2001 2002 2003 2004 2005 2006 2007 2008 Tunis 0.963 0.823 0.993 0.995 0.966 0.986 0.982 0.985 0.988 1.000 1.000 1.000 1.000 0.995 0.980 0.997 0.989 0.987 0.990 1.000
Ariana 0.891 0.870 0.932 0.943 0.955 0.987 0.969 0.969 0.997 0.987 0.891 0.870 0.932 0.981 0.979 1.000 0.985 0.973 1.000 0.987
Manouba - - 0.973 0.976 0.959 0.972 0.961 0.962 0.918 0.983 - - 0.973 0.996 0.987 0.999 0.988 0.988 0.969 0.991
Ben Arous 0.918 0.806 1.000 1.000 0.999 1.000 1.000 1.000 1.000 1.000 1.000 1.000 1.000 1.000 1.000 1.000 1.000 1.000 1.000 1.000
Zaghouan 0.794 0.560 0.821 0.916 0.926 0.923 0.919 0.886 0.909 0.913 0.794 0.572 0.849 0.981 0.983 0.997 1.000 0.980 1.000 1.000
Bizerte 0.901 0.801 0.976 0.981 0.994 0.998 0.999 0.992 0.981 0.993 0.939 1.000 0.980 0.989 0.994 0.998 0.999 0.992 0.981 0.996
Beja 0.764 0.681 0.825 0.933 0.945 0.916 0.887 0.906 0.918 0.933 0.814 0.710 0.881 1.000 0.989 0.989 0.965 0.984 0.984 0.987
Jendouba 0.805 0.680 0.806 0.982 0.943 0.948 0.900 0.872 0.886 0.927 0.805 0.701 0.839 1.000 0.972 0.979 0.960 0.951 0.961 0.981
Siliana 0.780 0.637 0.856 0.948 0.944 0.927 0.878 0.860 0.889 0.888 0.806 0.637 0.908 1.000 0.989 0.986 0.967 0.967 0.980 0.977
Kef 0.786 0.630 0.805 0.931 0.954 0.930 0.904 0.897 0.891 0.933 0.812 0.656 0.860 0.997 1.000 1.000 0.984 1.000 0.994 0.987
Kasserine 0.805 0.666 0.885 0.970 0.993 0.974 0.956 0.931 0.948 0.953 0.805 0.687 0.909 0.990 0.993 0.989 0.973 0.972 0.986 0.980
Sidi Bouzid 0.737 0.643 0.876 0.980 0.982 0.969 0.966 0.950 0.950 0.913 0.737 0.656 0.884 1.000 0.997 0.985 0.994 1.000 1.000 0.965
Gafsa 0.775 0.703 0.910 0.976 1.000 0.988 0.994 0.919 0.945 0.913 0.775 0.717 0.919 0.996 1.000 0.988 1.000 0.943 0.969 0.939
Tozeur 0.745 0.640 0.768 0.913 0.899 0.913 0.885 0.804 0.772 0.862 0.793 0.653 0.816 0.983 0.985 0.989 0.991 0.922 0.933 0.987
Kebili 0.819 0.813 0.847 0.938 0.953 0.941 0.906 0.833 0.873 0.869 0.847 0.830 0.876 0.979 0.964 0.952 0.956 0.904 0.972 0.944
Tataouine 0.878 0.693 0.930 0.959 1.000 0.923 0.938 0.874 0.892 0.895 0.916 0.707 0.962 0.999 1.000 0.967 0.994 0.951 0.970 0.948
Medenine 0.913 0.939 0.980 1.000 0.991 0.974 0.956 0.958 0.911 0.928 1.000 1.000 1.000 1.000 0.997 1.000 0.975 0.969 0.959 0.960
Gabes 0.881 0.762 0.919 0.959 0.989 0.941 0.915 0.913 0.885 0.881 0.881 0.777 0.937 0.996 0.994 0.968 0.969 0.966 0.948 0.955
Sfax 1.000 1.000 1.000 1.000 1.000 1.000 1.000 1.000 1.000 1.000 1.000 1.000 1.000 1.000 1.000 1.000 1.000 1.000 1.000 1.000
Mahdia 0.871 0.802 0.929 0.939 0.962 0.927 0.924 0.914 0.881 0.862 0.927 0.819 0.963 0.982 0.982 0.971 0.989 0.998 0.996 1.000
Kairouan 0.874 0.720 0.976 0.992 0.988 0.980 0.953 0.941 0.947 0.952 0.910 0.843 0.979 1.000 0.988 0.985 0.970 0.967 0.973 0.981
Monastir 0.884 0.804 0.930 0.946 0.991 0.934 0.923 0.916 0.949 0.955 0.923 0.821 0.965 0.990 0.999 0.978 0.967 0.969 0.997 0.986
Sousse 0.940 0.841 0.959 0.965 0.969 0.962 0.972 0.990 0.987 1.000 0.971 0.869 0.991 0.999 0.988 0.971 0.980 0.992 0.996 1.000
Nabeul 0.934 1.000 0.979 1.000 1.000 1.000 1.000 1.000 0.998 1.000 0.934 1.000 0.981 1.000 1.000 1.000 1.000 1.000 1.000 1.000
Average 0.855 0.761 0.911 0.964 0.971 0.959 0.945 0.928 0.930 0.939 0.882 0.805 0.933 0.994 0.990 0.987 0.983 0.974 0.982 0.981
9
Table 6: Model 6 (Inputs, Number of schools per million inhabitants and Education expenditures per students, Outputs, Success rate of baccalaureate exam).
Governorate CRS TE VRS TE
1999 200010 2001 2002 2003 2004 2005 2006 2007 2008 1999 2000 2001 2002 2003 2004 2005 2006 2007 2008 Tunis 1.000 0.749 0.821 0.976 0.913 0.991 0.754 0.974 0.897 0.823 1.000 0.912 0.851 1.000 0.932 1.000 0.871 0.984 0.932 0.950
Ariana 0.730 1.000 0.888 0.974 0.952 0.959 0.901 0.885 0.915 0.878 0.758 1.000 0.906 0.977 0.974 0.959 0.941 0.925 0.928 0.938
Manouba - - 0.741 0.769 0.803 0.732 0.738 0.653 0.758 0.712 - - 1.000 0.775 0.832 0.732 0.778 0.708 0.783 0.788
Ben Arous 0.637 0.675 0.691 0.743 0.738 0.952 0.791 1.000 1.000 1.000 0.691 0.886 0.770 0.848 0.812 1.000 0.900 1.000 1.000 1.000
Zaghouan 0.449 0.466 0.430 0.482 0.521 0.567 0.494 0.483 0.503 0.412 0.667 0.826 0.704 0.778 0.804 0.720 0.822 0.689 0.691 0.732
Bizerte 0.665 0.702 0.685 0.971 0.914 0.706 0.632 0.692 0.652 0.652 0.754 0.880 0.755 1.000 0.926 0.781 0.760 0.759 0.766 0.820
Beja 0.485 0.533 0.553 0.718 0.541 0.520 0.478 0.578 0.516 0.445 0.696 0.830 0.770 0.830 0.770 0.708 0.738 0.759 0.745 0.721
Jendouba 0.570 0.643 0.588 0.830 0.689 0.729 0.510 0.489 0.590 0.554 0.659 00.846 0.659 1.000 0.782 0.733 0.586 0.576 0.665 0.669
Siliana 0.536 0.527 0.586 0.770 0.529 0.546 0.479 0.597 0.485 0.494 0.754 0.832 0.772 0.820 0.805 0.755 0.748 0.777 0.717 0.807
Kef 0.447 0.533 0.556 0.615 0.659 0.570 0.461 0.495 0.477 0.416 0.609 0.841 0.687 0.791 0.902 0.805 0.763 0.749 0.745 0.711
Kasserine 0.520 0.648 0.562 0.744 0.697 0.643 0.585 0.523 0.502 0.503 0.616 0.851 0.644 0.820 0.837 0.736 0.735 0.644 0.632 0.678
Sidi Bouzid 0.477 0.481 0.528 0.673 0.571 0.548 0.485 0.532 0.490 0.449 0.675 0.769 0.724 0.812 0.820 0.745 0.751 0.681 0.686 0.702
Gafsa 1.000 0.508 0.485 0.735 0.619 0.598 0.397 0.446 0.449 0.432 1.000 0.828 0.715 0.881 0.856 0.729 0.637 0.596 0.608 0.647
Tozeur 0.386 0.394 0.383 0.520 0.623 0.467 0.371 0.319 0.378 0.372 0.724 0.851 0.689 0.859 0.873 0.782 0.747 0.594 0.780 0.818
Kebili 0.356 0.299 0.377 0.524 0.513 0.565 0.476 0.593 0.425 0.334 0.847 0.771 0.787 0.885 0.913 0.851 0.803 0.757 0.681 0.661
Tataouine 0.344 0.378 0.480 0.540 0.399 0.757 0.481 0.440 0.407 0.360 0.731 0.900 0.800 0.844 0.837 0.758 0.792 0.736 0.740 0.765
Medenine 0.613 0.537 0.621 0.682 0.644 0.573 0.526 0.856 0.677 0.577 0.893 0.878 0.849 0.910 0.926 0.873 0.856 1.000 0.896 0.854
Gabes 0.544 0.538 0.597 0.603 0.615 0.585 0.469 0.560 0.509 0.473 0.826 0.884 0.814 0.884 0.909 0.839 0.764 0.771 0.753 0.800
Sfax 1.000 0.798 1.000 1.000 0.938 1.000 0.925 1.000 0.983 0.890 1.000 0.962 1.000 1.000 1.000 1.000 1.000 1.000 1.000 1.000
Mahdia 0.664 0.657 0.761 0.858 0.805 0.777 0.696 0.710 0.659 0.660 0.831 0.886 0.904 0.925 0.919 0.889 0.895 0.882 0.873 0.907
Kairouan 0.763 0.743 0.816 0.848 0.775 0.772 0.696 0.668 0.730 0.654 0.767 0.840 0.817 0.866 0.834 0.820 0.835 0.780 0.797 0.800
Monastir 0.697 0.562 0.691 1.000 1.000 0.975 0.686 0.826 0.851 0.681 0.909 0.901 0.901 1.000 1.000 0.982 0.909 0.939 0.989 0.936
Sousse 0.714 0.646 1.000 0.883 0.823 0.864 0.827 0.825 0.881 0.834 0.871 0.904 1.000 0.966 0.917 0.889 0.914 0.914 0.931 0.958
Nabeul 0.965 0.935 1.000 1.000 1.000 1.000 1.000 1.000 1.000 1.000 1.000 1.000 1.000 1.000 1.000 1.000 1.000 1.000 1.000 1.000
Average 0.633 0.607 0.660 0.769 0.720 0.725 0.619 0.673 0.656 0.609 0.795 0.873 0.813 0.895 0.883 0.837 0.814 0.801 0.806 0.819
10
Table 7: Model 7 (Inputs, Teachers/100 students, Classes/100 students, Number of schools per million inhabitantsand Education expenditures per students,Outputs, success rate of baccalaureate exam).
Governorate CRS TE
VRS TE
1999 2001 2002 2003 2004 2005 2006 2007 2008 1999 2001 2002 2003 2004 2005 2006 2007 2008
Tunis 1.000 0.885 0.976 0.950 0.991 0.886 1.000 0.943 0.967 1.000 1.000 1.000 0.988 1.000 0.958 1.000 1.000 0.993
Ariana 0.758 0.906 0.974 0.965 0.959 0.935 0.929 0.930 0.948 0.758 0.906 0.977 0.974 0.959 0.941 0.952 1.000 0.979
Manouba - 0.741 0.793 0.838 0.732 0.774 0.730 0.776 0.786 1.000 0.800 0.879 0.732 0.778 0.760 0.783 0.788
Ben Arous 0.722 0.839 0.921 0.894 0.952 0.914 1.000 1.000 1.000 1.000 1.000 1.000 1.000 1.000 0.933 1.000 1.000 1.000
Zaghouan 0.667 0.682 0.748 0.804 0.708 0.795 0.668 0.661 0.703 0.667 0.704 0.778 0.804 0.720 0.822 0.689 0.691 0.732
Bizerte 0.771 0.822 0.971 0.964 0.841 0.801 0.810 0.815 0.869 0.883 1.000 1.000 1.000 0.934 0.870 0.918 0.893 0.874
Beja 0.653 0.740 0.815 0.785 0.696 0.714 0.736 0.734 0.701 0.696 0.770 0.830 0.793 0.708 0.738 0.759 0.745 0.721
Jendouba 0.659 0.673 0.830 0.812 0.729 0.586 0.567 0.645 0.651 0.659 0.695 1.000 0.829 0.740 0.586 0.576 0.665 0.669
Siliana 0.730 0.756 0.820 0.821 0.755 0.724 0.742 0.687 0.775 0.754 0.772 0.820 0.829 0.755 0.748 0.777 0.717 0.807
Kef 0.589 0.667 0.761 0.902 0.791 0.726 0.715 0.703 0.692 0.609 0.687 0.791 0.902 0.805 0.763 0.749 0.745 0.711
Kasserine 0.616 0.671 0.854 0.904 0.777 0.774 0.665 0.641 0.697 0.616 0.723 0.862 0.945 0.839 0.811 0.702 0.655 0.699
Sidi Bouzid 0.675 0.739 0.829 0.868 0.787 0.777 0.692 0.686 0.693 0.675 0.762 0.833 0.896 0.850 0.801 0.711 0.686 0.702
Gafsa 1.000 0.730 0.905 0.925 0.785 0.683 0.622 0.627 0.665 1.000 0.753 0.923 1.000 0.937 1.000 0.677 0.654 0.667
Tozeur 0.680 0.675 0.826 0.845 0.742 0.689 0.544 0.662 0.716 0.724 0.689 0.859 0.873 0.782 0.747 0.594 0.780 0.818
Kebili 0.819 0.772 0.868 0.930 0.851 0.790 0.727 0.640 0.608 0.847 0.787 0.885 0.940 0.851 0.803 0.757 0.681 0.661
Tataouine 0.700 0.784 0.861 0.904 0.772 0.792 0.725 0.719 0.734 0.731 0.800 0.865 0.945 0.791 0.792 0.736 0.740 0.765
Medenine 0.913 0.905 0.941 0.961 0.902 0.870 1.000 0.866 0.831 1.000 1.000 1.000 0.997 1.000 0.884 1.000 0.896 0.854
Gabes 0.826 0.831 0.902 0.944 0.855 0.764 0.771 0.741 0.778 0.826 0.857 0.906 0.980 0.875 0.764 0.771 0.753 0.800
Sfax 1.000 1.000 1.000 1.000 1.000 1.000 1.000 1.000 1.000 1.000 1.000 1.000 1.000 1.000 1.000 1.000 1.000 1.000
Mahdia 0.780 0.886 0.925 0.934 0.874 0.866 0.842 0.801 0.826 0.831 0.904 0.925 0.942 0.889 0.895 0.882 0.873 0.907
Kairouan 0.764 0.834 0.903 0.900 0.867 0.864 0.806 0.806 0.800 1.000 1.000 0.916 0.941 0.936 0.891 0.854 0.823 0.802
Monastir 0.887 0.883 1.000 1.000 0.975 0.888 0.910 0.951 0.949 0.909 0.901 1.000 1.000 0.982 0.909 0.939 0.989 0.951
Sousse 0.843 1.000 0.947 0.935 0.889 0.930 0.942 0.939 0.980 0.871 1.000 0.966 0.944 0.889 0.944 0.981 0.953 0.980
Nabeul 0.965 1.000 1.000 1.000 1.000 1.000 1.000 1.000 1.000 1.000 1.000 1.000 1.000 1.000 1.000 1.000 1.000 1.000
Table 8: Model 8 (Inputs, Number of schools per million inhabitants and Education expenditures per students, Outputs, Rate of non-doubling in the 9th year).
Governorate CRS TE
VRS TE
1999 2001 2002 2003 2004 2005 2006 2007 2008 1999 2001 2002 2003 2004 2005 2006 2007 2008 Tunis 1.000 0.923 0.968 0.940 0.984 0.788 0.911 0.875 0.817 1.000 0.963 0.970 0.987 1.000 0.972 0.964 0.978 0.979
Ariana 0.806 0.851 0.990 0.936 0.937 0.903 0.871 0.922 0.888 0.891 0.941 1.000 0.993 1.000 0.999 0.980 0.999 0.981
Manouba - 0.990 0.961 0.907 0.881 0.885 0.807 0.830 0.856 - 1.000 0.999 0.999 0.998 0.999 0.995 0.973 1.000
Ben Arous 0.767 0.852 0.825 0.805 1.000 0.871 1.000 1.000 1.000 0.878 0.968 0.975 0.984 1.000 1.000 1.000 1.000 1.000
Zaghouan 0.502 0.464 0.584 0.590 0.663 0.545 0.590 0.617 0.538 0.794 0.849 0.981 0.983 1.000 1.000 0.981 1.000 1.000
Bizerte 0.740 0.830 0.999 0.959 0.763 0.746 0.792 0.733 0.749 0.881 0.944 1.000 0.990 0.990 0.994 0.990 0.976 0.995
Beja 0.533 0.623 0.798 0.641 0.633 0.566 0.646 0.598 0.578 0.814 0.881 0.999 0.987 0.991 0.967 0.983 0.982 0.986
Jendouba 0.653 0.716 1.000 0.778 0.915 0.755 0.720 0.757 0.772 0.805 0.832 1.000 0.986 0.983 0.961 0.960 0.966 0.986
Siliana 0.538 0.658 0.875 0.593 0.625 0.560 0.634 0.588 0.569 0.806 0.908 1.000 0.988 0.985 0.969 0.966 0.979 0.975
Kef 0.559 0.680 0.736 0.689 0.616 0.538 0.583 0.555 0.545 0.812 0.862 0.997 1.000 1.000 0.986 1.000 0.993 0.986
Kasserine 0.637 0.736 0.861 0.743 0.735 0.697 0.701 0.693 0.691 0.805 0.895 0.979 0.992 0.983 0.969 0.975 0.987 0.980
Sidi Bouzid 0.489 0.587 0.768 0.627 0.627 0.579 0.668 0.628 0.586 0.737 0.877 0.984 0.990 0.975 0.992 1.000 1.000 0.963
Gafsa 1.000 0.607 0.779 0.666 0.668 0.539 0.584 0.601 0.574 1.000 0.912 0.982 0.977 0.978 0.958 0.940 0.966 0.940
Tozeur 0.397 0.427 0.563 0.697 0.513 0.446 0.443 0.400 0.428 0.793 0.816 0.976 0.997 0.989 0.991 0.922 0.930 0.983
Kebili 0.325 0.407 0.522 0.507 0.518 0.512 0.639 0.507 0.430 0.823 0.876 0.969 0.942 0.941 0.957 0.910 0.974 0.949
Tataouine 0.405 0.544 0.572 0.436 0.796 0.545 0.454 0.443 0.409 0.916 0.962 0.991 0.984 0.971 0.994 0.949 0.968 0.947
Medenine 0.567 0.685 0.699 0.615 0.530 0.541 0.765 0.659 0.598 0.880 0.944 0.963 0.963 0.939 0.973 0.965 0.961 0.960
Gabes 0.545 0.672 0.647 0.601 0.574 0.537 0.593 0.555 0.530 0.881 0.930 0.984 0.975 0.959 0.968 0.960 0.946 0.954
Sfax 0.955 0.999 0.966 0.833 0.872 0.835 0.881 0.864 0.832 1.000 1.000 0.997 0.994 0.997 1.000 0.997 1.000 0.994
Mahdia 0.695 0.739 0.855 0.789 0.723 0.695 0.712 0.664 0.684 0.927 0.963 0.972 0.981 0.968 0.989 0.996 0.994 1.000
Kairouan 0.818 0.949 0.944 0.825 0.786 0.728 0.733 0.801 0.762 0.864 0.955 1.000 0.993 0.977 0.968 0.966 0.974 0.983
Monastir 0.689 0.724 1.000 1.000 0.929 0.673 0.745 0.798 0.669 0.952 0.965 1.000 1.000 0.985 0.969 0.964 0.998 0.978
Sousse 0.750 1.000 0.880 0.796 0.802 0.799 0.781 0.856 0.841 0.971 1.000 0.988 0.991 0.968 0.979 0.982 0.995 1.000
Nabeul 1.000 1.000 1.000 1.000 1.000 1.000 1.000 1.000 1.000 1.000 1.000 1.000 1.000 1.000 1.000 1.000 1.000 1.000