INSTITUTO SUPERIOR DE ECONOMIA E GESTÃO
MASTERS IN MARKETING
WINE REPUTATION: ARE THERE DIFFERENCES BETWEEN
RED AND WHITE WINE?
Débora Alexandra Encarnado Pereira
Advisor:
Mestre Patrícia Isabel Ramos Pego Nunes Tavares
Co-Advisor:
Professor Doutor Rui Brites
President:
Prof. Doutora Margarida Duarte
Discussant:
Prof. Doutora Cristina Baptista
2 INDEX
ABSTRACT ... 5
1.1. Theme Relevance... 6
1.2. Research Objectives ... 6
1.3. Methodology... 7
1.4. Structure ... 7
CHAPTER 2 - LITERATURE REVIEW ... 8
2.1. Purpose of Studying Reputation ... 8
2.2. Reputation Definition ... 8
2.3. Perspectives on Reputation ... 9
2.3.1. Duality Quality-Price ... 9
2.3.2. Identity and Image ... 10
2.3.3. Individual and Collective Reputation ... 11
2.4. Difficulties in Definition and Operationalization ... 11
2.5. Wine Reputation ... 13
2.6. The Human Values Construct in Wine Reputation ... 14
CHAPTER 3 – ADOPTED MODEL: FRAME OF REFERENCE ... 17
CHAPTER 4 - OBJECTIVES AND FORMAL HYPOTHESIS ... 19
4.1. Research Objectives ... 19
4.2. Formal Hypothesis ... 19
CHAPTER 5 - CONTEXT OF RESEARCH ... 20
5.1. National Data ... 20
5.1.1. Portuguese Market Organisation ... 20
5.2. International Data... 21
5.2.1. European Union Vineyard ... 21
5.2.2. Wine Production ... 21
5.2.3. Global Wine Consumption in 2010 ... 21
CHAPTER 6 – METHODOLOGY ... 22
6.1. Type of Methodology ... 22
6.2. Sample Design and Data Collection ... 22
6.3. Questionnaire Structure ... 22
CHAPTER 7 – RESULTS PRESENTATION AND DISCUSSION ... 24
7.1. Sample Characterization ... 24
7.1.1. Socio-demographic data... 24
7.1.2. Human Values ... 25
7.2. Wine Reputation ... 25
7.2.1. Differences in Red and White Wine ... 26
7.2.2. Choosing Wine ... 27
7.3. Hypothesis and its analysis... 28
CHAPTER 8 - CONCLUSIONS ... 31
CHAPTER 9 – LIMITATIONS AND SUGGESTIONS FOR FUTURE RESEARCH ... 33
REFERENCES ... 34
ANNEX ... 36
ANNEX I Legal Denominations ... 36
ANNEX II Questionnaire in Portuguese ... 37
ANNEX III Questionnaire in English – exported from Qualtrics ... 41
ANNEX IV Professional Activity ... 45
ANNEX V Human Values – Motivational Types ... 45
ANNEX VI Corporate Character Scale... 45
ANNEX VII Age (recoded)... 45
ANNEX VIII Sex ... 46
ANNEX IX Residence - District ... 46
ANNEX X Red wines generally offer higher quality than others ... 46
ANNEX XI What kind of wine do you prefer * About the money you spent in wine ... 47
ANNEX XIII Red wines have better flavour than others * Age ... 48
ANNEX XIV People whose favourite type of wine is white wine are more adventurers ... 49
ANNEX XVI It is important to him to make his own decisions about what he does. He likes to be free and not depend on others * sex ... 50
3 TABLES INDEX
Table 2.2.1 : Literature Categorization On Corporate Reputation ... 9
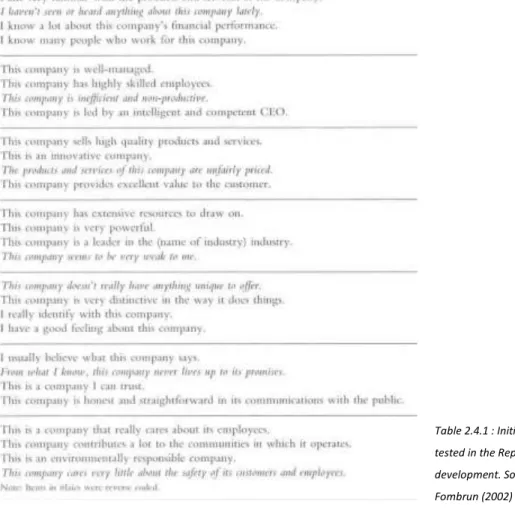
Table 2.4.1 : Initial List Of 32 Items Tested In The Reputation Quotient Development ... 12
Table 2.4.2.: Corporate Character Scale (Davies, Chun, Da Silva, & Roper, 2004)... 13
Table 5.1.1.: NSI’s Statistics ... 20
Table 5.1.1.1.: Hectares Restructured ... 20
Table 5.2.3.1.: Developments In EU Wine Consumption ... 21
Table 5.2.3.2.: Wine Consumption In Several Countries Outside The EU... 21
Table 7.1.1.1.: Geographic Distribution (ANNEX IX)... 24
Table 7.2.2.1.: Importance Of Certain Elements, When Choosing A Wine People Do Not Know ... 27
Table 7.3.1.: Relationship Between Favourite Type Of Wine And Money Spent (ANNEX XI)... 28
Table 7.3.2.: Opinion On Red Wines Having Better Flavour Than Others According To Age (ANNEX XIII) ... 29
Table 8.1.: Objectives, Constructs And Hypothesis... 31
FIGURES INDEX Figure 1: Revised theoretical model of relations among motivational types of values, higher order value types, and bipolar value dimensions... 15
Figure 2: Adopted Model: Frame Of Reference... 18
Figure 3: Age Profile (ANNEX VII)... 24
Figure 4: Sex Profile (ANNEX VIII)... 24
Figure 5: Professional Activity Profile (ANNEX IV)... 24
Figure 6: Motivational Types according to Sex (ANNEX V)... 25
Figure 7: Twelve Highly Classified Items of the Corporate Character Scale (Davies, Chun, Da Silva, & Roper, 2004)... 25
Figure 8: Wine Reputation through Corporate Character Scale (Davies, Chun, Silva, & Roper, 2004)... 26
Figure 9: Dimensions that describe wine as a person through Corporate Character Scale (Davies, Chun, Silva, & Roper, 2004) ... 26
Figure 10: White Wine with Good Reputation... 27
Figure 11: Red Wine with Good Reputation... 27
Figure 12: White Wine with Bad Reputation... 27
Figure 13: Red Wine with Bad Reputation... 27
4 A major thank you to Patrícia Tavares, no words to describe the attention and encouragement.
To my friends who believed as much as I did: Marco Valada and Ilda Bessa.
To my friends, who helped me translating this project: Rita Alves, Ana Marques and Sarah
Dores.
In the final phase of this long and troubled process, Professor Rui Brites for his availability of
making SPSS (almost) look easy.
I also thank my husband for the patience and my mother for listening without understanding
5
ABSTRACT
Reputation is a relevant concept in different areas and to different subjects such as
personalities, organizations, products and countries (Bromley, 2001). Adjusting existing theory
to wine sector, we justify this research with this product’s importance to Portugal’s economy.
Therefore we identified the need for understanding existing differences in wine consumption
and perception using the Corporate Character Scale (Davies, Chun, Da Silva, & Roper, 2004).
Because human values unify the assorted interests of all sciences concerned with human
behaviour (Schwartz, 1992), we assessed the relationship between respondents’ values and
their associations to wine.
With that purpose we used a quantitative approach with a convenience sampling method (non
probabilistic), and collected 107 usable questionnaires from wine consumers. We concluded
that red wine is not thought to have higher quality than other types of wine or even to taste
better, particularly among elder respondents. About money spent per bottle, in average, it is
not related to the type of wine people prefer. White wine is not considered a lady’s wine.
Nowadays we cannot relate women’s identification with the sense of freedom and wine
consumption. Being an adventurer and self-confident is not related to white wine preference.
A Reputação é um conceito relevante em diferentes áreas e face a diferentes temas, tais como
personalidades, organizações, produtos e países (Bromley, 2001). Ajustando a teoria existente
ao sector do vinho, justificamos a pesquisa com a importância do vinho na economia
portuguesa. Assim, identificámos a necessidade de entender diferenças no consumo e
percepção do vinho utilizando a Escala de Personalidade de Davies, Chun, Da Silva, & Roper
(2004). Porque os valores humanos unificam o diverso leque de interesses de todas as ciências
relativas ao comportamento humano (Schwartz, 1992), pretendemos explorar a relação entre
os valores dos respondentes e as suas associações ao vinho.
Para isso, utilizámos uma abordagem quantitativa com amostra por conveniência (não
probabilística), recolhendo 107 questionários válidos de consumidores. Concluímos que o
vinho tinto não é considerado como tendo qualidade superior face a outros ou sequer que
tenha melhor sabor, particularmente entre as pessoas mais velhas. Em relação ao valor médio
por garrafa que a pessoa despende, essa questão não está relacionada com o tipo de vinho
preferido. O vinho branco não é associado ao sexo feminino. Também não foi encontrada uma
relação significativa entre consumo de vinho pelo sexo feminino e o seu sentimento de
liberdade. Da mesma forma, a associação aos valores de aventura e auto-confiança não se
relaciona com a preferência por vinho branco.
6
CHAPTER 1 – INTRODUCTION
In this first chapter we present the theme relevance, the research objectives, methodology
and structure of this study.
1.1. Theme Relevance
This theme comes from the authors' personal interests and considers the importance of wine for our country’s economy. Wine exports increased 17% in 2010 to 600 million euros (Secretary of State for Fisheries and Agriculture, Luís Vieira, February 3, 2010. Retrieved from
www.ivv.min-agricultura.pt/np4/3077.html). 53% of the total export is port wine; the
remaining 47% relies on table wine. The investment of 150 million euros planned until 2013 for
the Portuguese wine promotion reflects the importance of this sector in the Portuguese
economy. Portugal is one of the 5 leading EU exporters along with Germany, Spain, France and
Italy. In absolute numbers, 2010 forecast for exportation are 2,6 millions of hl (corresponding
to 3% of global market). In 2009 2,3 million hl headed worldwide market (Organisation
Internationale de la Vigne et du Vin [OIV], 2009).
Given the recent proliferation of wine producing countries, generating a growing and more
aggressive competition among Portuguese consumers, we are interested to learn the different
perceptions about wine, especially when considering white wine versus red wine. International
data shows different consumption habits emphasizing which one is more consumed in certain
countries. Regardless of brands and their reputation, white wine is overlooked in the
Portuguese market. Therefore, we developed an introductory exploratory research to
schematize the descriptive research developed in this study.
1.2. Research Objectives
This study results from the need to understand differences in wine perception and
consumption, identifying favourite types of wine and the reasons for expressed preference. In
the end, because values are the concept that unifies the apparently diverse interests of all
sciences concerned with human behaviour (Schwartz, 1992), we intend to explore the
relationship between respondents’ values and their associations to wine. The purpose of this
analysis is also to be able to expand, in future studies, the scope of this initial exploratory
study. Therefore we defined three objectives:
1. To identify the quality attributes valued by consumers when choosing wine
2. To understand the differences in red and white wine reputation, i.e., to identify which
attributes are recognized in each of these products
7
1.3. Methodology
This research followed a positivist paradigm, in a quantitative approach, applying
questionnaires through a non probabilistic and convenience sampling, collecting answers
among our personal contacts (entities asked to disclose our questionnaire: wineries,
restaurants, wine shops).
1.4. Structure
This section aims to present the research problem and identify and justify the research
objectives and hypotheses to be tested. On chapter two we review the existing literature on
reputation. Chapter three explores our adopted model/frame of reference, in chapter four we
formalize research objectives and hypothesis and chapter five presents our context of
research. Chapter six introduces our methodology and the following chapters present results,
respective discussion and conclusions. Finally, we indicate limitations of this study and some
8
CHAPTER 2 - LITERATURE REVIEW
Here we will briefly present the main purpose of studying reputation, its definition, different
perspectives about the concept, difficulties in defining and operationalizing it. We continue
presenting a brief overview on wine reputation, before entering the Human Values Construct.
2.1. Purpose of Studying Reputation
Devine and Halpern (2001) highlight the many rewards of building and maintaining a good
reputation: it is an indicator of quality and companies’ strategies, a source of information for
potential investments, career decisions as well as product choices. Also, a good reputation
motivates and attracts the best human resources, with competitive prices, thus allows the
offer of more attractive prices to the consumers. In terms of business partnerships, a good
reputation raises better partners and better businesses.
To Rindova and Fombrun (1999), corporate reputation is a collective representation of the
results and actions of an organization, to prove its ability to deliver added value to various
stakeholders. This representation is measured by internal and external stakeholders, within an
institutional and competitive environment.
2.2. Reputation Definition
2.2.1. Reputation as a multidisciplinary concept
Psychological studies of personality and individual reputation contribute to the studies of
corporate reputation, since some of the human dimensions are able to be adjusted to
organizations. Bromley (2001) noticed that not only people and organizations have
reputations. And this is an important statement for our work because we want to analyse a
product category, regardless of the brand or organization, and clearly not being related to a
person or country.
The definition of reputation and especially how it should be measured / assessed is a
multidisciplinary subject according to Fombrun and Van Riel (1997), (as cited in Chun, 2005, p.
92). Gotsi and Wilson (2001) summarize some of the areas that study the meaning of
corporate reputation - economy, accounting, sociology, strategy and management. However, it
is agreed that this is an important element for the organization / entity / person / country, a
valuable asset (Caruana, 1997) and a competitive advantage (Rindova & Fombrun, 1999).
Brady (2002) defines it as holistic beliefs of most individuals.
9
Table 2.2.1.: Literature Categorization on Corporate Reputation. Source: Fombrun & Van Riel (1997), (as cited in Chun, 2005, p. 92)
2.3. Perspectives on Reputation
Apart from the different fields of study, literature shows us different perspectives on
reputation that are not mutually exclusive. Here we explore three particular perspectives:
first we present the Quality-Price Duality, where we demonstrate literature on this dominating
duo on consumer options (pricing and quality); secondly, we intend to present the literature
on
Identity & Image, and their dynamic relationship. Individual & Collective Reputation, i.e.,reputation in its individual concept and as a collective subject is what we discuss here.
2.3.1. Duality Quality-Price
When leaving the strict organizational sphere and in the case of experience-goods (Nelson,
1970, 1974, 1978), as cited in Milgrom & Roberts (1986, p.797), there is another duo
dominating consumer options: pricing and quality (Milgrom & Roberts, 1986). Landon and
Smith (1998) argue that reputation is an indicator on which consumers rely on to infer the
quality of a product or good and make consumption decisions, i.e. reputation defines the level
of expected quality about such products or goods. Moreover, the authors introduce the
concept of real/actual quality based on public opinion and scores published in specialized
panels. Empirical analysis show that the expected quality is supported on the reputation built
over time, and so has greater influence when setting product price. That price, in turn, is used
by the consumer as a reference of real and expected quality levels (Milgrom & Roberts, 1986).
Several studies have been developed to determine a hedonic price for quality, reputation and
attributes of various products. According to Rosen (1974), (as cited in Schamel, 2006, p. 364),
the markets have implicit prices for the attributes embedded in the product and consumers
evaluate the product for these attributes. The real price is the sum of these implicit prices and
here is where we meet the subjectivity concept Schamel (2006) mentioned. It is difficult to
10 elements help in the decision process: labels, packaging, legal reputation. Again, the fact that
consumers have little time to seek out information prepares them to pay more when a certain
quality is assured (Schamel, 2006).
Kahneman (as cited in Roberts & Reagans, 2001, p. 1) recognizes that many of the signs of
quality are not captured by consumers because of pure inattention. People pay attention to
some things and not others (Cyert & March (1963) as cited in Roberts & Reagans, 2001, p.2),
because due to an evolutionary context attention depends on random events and on industry
development itself. This way, it is important to acknowledge that nothing exists in a vacuum
but in a certain context and this can influence individual perception.
2.3.2. Identity and Image
The main research about reputation building is subdivided into two other concepts: identity
and image (Pruzan, 2001). The same author discusses the potentially adaptive nature, not
stagnant of both elements. Identity is described as something enduring, central, a distinctive
character of the organization (Gioia, Schultz, & Corley, 2000) and image as the attitudes
developed by people towards an organization believing that it has certain characteristics
(Spector, 1961).
But discussions are long and definitions are not consensual, regarding identity (Melewar &
Jenkins, 2002), and also image (Gioia, Schultz, & Corley, 2000). Therefore, a position supported
in the literature that somehow displaces this view of reputation comes from the "opposition"
between Public Relations and Marketing presented by Grunig (1993) about identity and image.
The author, based on Cutlip (1991) discusses the term "image" with some apprehension and
even some negative connotation, especially concerning the credibility of Public Relations.
Image is imitari, a mere reproduction of the individual or object, claiming that "image" in a
marketing point of view is something (symbols) built by the receivers.
Grunig (1993) concludes that image is an umbrella term that encloses all the concepts about a
message reception. This way we are able to analyse reputation through two perspectives: - Identity: intrinsic and technical characteristics from an objective standard (related to the
product or from the producers’ perspective).
11 2.3.3. Individual and Collective Reputation
Landon and Smith (1998) dissected the concept of reputation in both individual and collective
reputation:
Individual reputation is the reputation of an organization based on their past and public performance;
Collective reputation (Tirole, 1996) is the perception of the average quality of a group of organizations (referring to a geographic area, for example).
In a market where it is difficult and expensive for consumers to obtain complete information
on all products and organizations, collective reputation plays the role of quality indicator. The
information on labels and packaging also serves to infer product quality, because they
objectively indicate what group of organizations the product belongs to (Tirole, 1996). Panzone
and Simões (2009) mention the importance of this factor in establishing the price (which in
turn also indicates quality), also previously approached.
2.4. Difficulties in Definition and Operationalization
In an historical perspective, Spector (1961) developed one of the first scales in this area
concerning basic dimensions for measuring corporate image. The scale includes 45 features
organized into six factors related to personality of the company and humanizing assessment:
Dynamism, Cooperation, Business Competence, Character, Success and Introversion.
Gardberg and Fombrun (2002) go further to state that to be managed, organizational
reputation must be measured. This way, they indicate a series of rankings empirically
developed (Wartick, 2002) therefore not justifying any dimension or worrying about sample
representativeness. Gardberg and Fombrun (2002) develop a measurement model to compare
reputation in the U.S. and Europe. This enquiry is based on interviews where respondents only
have to mention two organizations with good reputation and two with bad reputation. The authors won’t mention or conclude about dimensions or attributes measured, they only collect the perceptions of individuals.
Wartick (2002) summarizes and criticizes several existing standard rankings, in particular, Fortune’s America’s Most Admired Companies identifying specific problems concerning data and measurement, such as: absence of concept predefinition, lack of samples
representativeness, the fact that these scales include only financial data not taking account
12 Garberg and Fombrun (2002) built the Reputation Quotient based on 32 items of the eight
most visible scales, adding some items suggested by literature on reputation in order to build a
reliable and valid scale. The next challenge was to adjust the scale to cultural differences from
country to country.
Table 2.4.1 : Initial list of 32 items tested in the Reputation Quotient development. Source: Gardberg & Fombrun (2002)
Some more important theories representing humanization and wideness of these concepts
applied to Reputation (Bromley, 2001) came from Aaker (1997) and Davies et al. (2004).
Aaker (1997) worked on the Personification Metaphor reaching 5 dimensions and 42 items:
Sincerity (11 items), Competence (9 items), Sophistications (6 items), Excitement (11 items),
Ruggedness (5 items). This scale has been widely used to infer customers’ view of a brand.
The personification metaphor has also been widely applied in order to obtain opinions from
consumers or customers and employees, in understanding organizations as if they were a person. Corporate Character is defined as “how a stakeholder distinguishes an organization, expressed in terms of human characteristics” (Davies, Chun, Da Silva, & Roper, 2004, p. 127). The Corporate Character Scale, according to these last authors, identifies 7 dimensions:
Agreeableness, Enterprise, Competence, Chic, Ruthlessness, Informality, Machismo fulfilled
13 Table 2.4.2.: Davies’s Corporate Character Scale. Source: Davies, Chun, da Silva, , & Roper, (2004).
2.5. Wine Reputation
The elements that guarantee each customer a "quality level" can have two expressions: an
objective and a subjective one (Cox, 2009), or in other words, an intrinsic and an extrinsic one
(Lowengart, 2010). Objective signals of quality are technical specifications of the product and
the absence of defects (Cox, 2009), or written information on labels (producer, vintage, region,
appellation, grape varieties (Benfratello, Piacenza, & Sachetto, 2009)).
Benfratello, Piacenza and Sachetto (2009) aim to disprove the preconceived idea that wine
evaluation is purely subjective and sensorial so they present studies on Bordeaux and
Burgundy wines. About Bordeaux wines, sensory characteristics proved to have little relevance
in wine appreciation and definition of its price; major factors in price definition of Burgundy
wines are acidity, concentration and fat content. Subjective elements result from consumer
perceived quality. "Perceived quality" must be understood as a “mediator between product
objective characteristics and consumer preferences” (Steenkamp (1989) as cited in Cox (2009,
p. 210).
Lowengart (2010) reaffirms these positions by identifying two categories of attributes -
extrinsic (brand and packaging) and intrinsic (taste) - that are the target of a heterogeneous
sensory evaluation by consumers, determining choice probabilities of a particular wine. The
author identifies several sources of heterogeneity influencing consumer preferences: personal
differences (gender), geographic and behavioural differences (experience with the product).
Tirole (1996) claims that producers and grape varieties reputation play an important role
because they allow identifying a group of wine producers. The collective reputation has an
impact on purchasing decisions or in choosing a wine referring not only to the product itself,
14 sources of reliance (Chaney, 2002) in order to make decisions and “country-of-origin” effect works as a facilitator for consumers’ choices towards unfamiliar brands or even unfamiliar wines (Chaney, 2000). Bretherton (2004) emphasizes that small producers struggle to have a
voice so they rely on distribution chain for promotion and in an exportation context
country-of-origin may work as a competitive advantage.
From a complementary standpoint, Schamel (2006) says that associating wine origin to a
quality measure can neglect the subjective preference of the consumer as a consequence of
marketing, advertising, brands and even potential brand loyalty. The operationalization of any measure of reputation is associated with quality assessment and, critics’ sensory evaluations are a support for wine analysis. The ranking of Wine Spectator, explained by Landon and Smith
(1998) and developed by Robert Parker (2001) is one of the most respected and is based in
blind tastings. Despite all the inherent subjectivity in the evaluation process, these are quality
standards recognized by wine professionals (Robinson, 1994).
2.6. The Human Values Construct in Wine Reputation
Value is the criteria people use to select and justify actions as well as evaluate other people
and events (Schwartz, 1992). Also according to Schwartz (1992), these criteria are not just an
attitude differing in the abstractness of its essence, involving values and its function of guiding
selection or evaluation of behaviours and events.
Values aren’t understood as inherent qualities of an entity, instead they have a general facet working as leading priorities (or hierarchy) affecting people’s orientations and choices. These
values differ from person to person, from country to country and from culture to culture,
influencing how people behave and organizing human existence. In conclusion, human values
are the way people understand life and its meaning. This leads to an interesting dynamic
between them, because in pursuit of a value, people experience psychological, practical and
social consequences that may conflict or may be congruent with the pursuit of other values
(Schwartz, 2003).
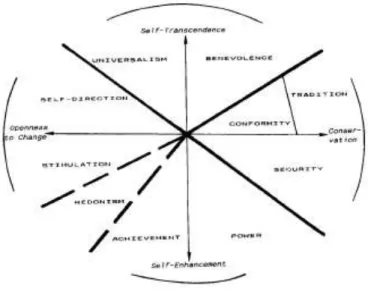
According to this author’s studies, he has identified 10 major groups of values: benevolence, tradition, conformity, security, power, achievement, hedonism, stimulation, self-direction and
universalism, being measured by following indicators and organized in four major values:
Self-enhancement, Openness to change, Self-transcendence, Conservation. Benevolence:
preservation and enhancement of the welfare of people with whom one is in frequent
personal contact (helpful, honest, forgiving, loyal, responsible). Tradition: respect,
15 provide the self (humble, accepting my portion in life, devout, respect for tradition, moderate).
Conformity: restraint of actions, inclinations, and impulses likely to upset or harm others and
violate social expectations or norms (politeness, obedient, self-discipline, honouring parents
and elders). Security: safety, harmony and stability of society, of relationships, and of self
(family, security, national security, social order, clean, reciprocation of favours). Power: social
status and prestige, control or dominance over people and resources (social power, authority,
wealth, preserving my public image). Achievement: personal success through demonstrating
competence according to social standards (successful, capable, ambitious, influential).
Hedonism: pleasure and sensuous gratification for oneself (pleasure, enjoying life,
self-indulgence). Stimulation: excitement, novelty, and challenge in life (daring, a varied life, an
exciting life). Self-direction: independent thought and action-choosing, creating, exploring
(creativity, freedom, independent, curious, choosing own goals).Universalism: understanding,
appreciation, tolerance and protection for the welfare of all people and for nature
(broadminded, wisdom, social justice, equality, a world at peace, a world of beauty, unity with
nature, protecting the environment).
Figure 1 schematizes Schwartz’s (1992) model of relations among ten motivational types of
values used in European Social Survey.
Figure 1: Revised theoretical model of relations among motivational types of values, higher order value types, and bipolar value dimensions. Source: Schwartz, (1992).
Self-enhancement imply achievement and power as motivational values, Self-transcendence
refer to benevolence and universalism, Openness to change considers self-determination,
stimulation and hedonism as motivational values, Conservation has conformism, tradition and
security as its motivational type of values. These four human values (opposing
16
higher four values in Schwartz’s (1992) hierarchy allying 10 motivational types of values and respective indicators.
These human values justify different behaviours and this is the reason why we deem important
to consider them as influencing choices in wine consumption and perception in wine
reputation. Also justifying differences between countries, Schwartz’s hierarchy (1992) would
be useful in an international study of wine reputation.
This literature review commenced with an introductory research to understand the purpose of
studying reputation, its facet as a multidisciplinary concept touching several social and study
areas such as economy, sociology, among others. Different perspectives were assessed:
quality-price, identity and image, individual and collective reputation. But in order to
conceptualize our study we also had the need to understand the difficulties in defining and
measuring it. In a glimpse, a brief approach to wine reputation to provide some directions
about the market we will study. Finally, we introduced the human values construct viewed as
17
CHAPTER 3 – ADOPTED MODEL: FRAME OF REFERENCE
Following the analysis about how white and red wines are perceived by Portuguese
consumers, we will apply the Corporate Character Scale (Davies, Chun, Da Silva, & Roper,
2004) with its 49 items, to measure wine reputation. Our goal is to assess the extent to which
white/red wine can be described through certain human characteristics. The scale will be
constructed based on a likert scale with 5 points, where 1 represents “Totally agree” and 5 stands for “Totally disagree”.
Bearing in mind Schamel (2006) concerning the subjectivity of consumer preferences
(influenced by marketing, advertising, brands and brand loyalty potential) we intend to use
Wine Spectator ranking (colour, aroma, taste, balance, complexity and aging potential) to
portray the evaluation of white wine by national consumers towards red wine.
Because human values unify the assorted interests of all sciences concerned with human
behaviour, and as a criteria people use to select and justify actions (Schwartz, 1992), we
assessed the relationship between respondents’ values and their associations to wine.
This study will also be based on quality assessment and consumers’ sensory evaluations
through Robert Parker Rating System (2001) items with a scale of 100 point starting at 50.
95-100 Classic: a great wine;
90-94 Outstanding: a wine of superior character and style;
85-89 Very good: a wine with special qualities;
80-84 Good: a solid, well-made wine;
75-79 Mediocre: a drinkable wine that may have minor flaws;
50-74 Not recommended.
Though we are not going to use a 100 point scale because we intend to obtain information on
what consumers consider important when choosing or preferring a wine, instead of qualifying
wines. We will use a likert scale with 5 points to infer agreement on statements about the items referred in Parker’s ranking to infer overall quality.
In terms of awarding points, Roberts Parker’s scoring system works as follows:
- Wine's general colourand appearance merit up to 5 points.
18 - The flavour and finish merit up to 20 points (depending on the intensity of flavour, balance,
cleanliness, depth and length on the palate).
- The overall quality level or potential for further evolution and improvement—aging—merits
up to 10 points.
Source: Parker Points®. Retrieved from https://www.erobertparker.com/info/legend.asp
In order to be visually easier to understand our study, we present a schema with our proposal
for frame of reference:
19
CHAPTER 4 - OBJECTIVES AND FORMAL HYPOTHESIS
Here we present the research objectives and formal hypothesis.
4.1. Research Objectives
We developed a descriptive research so we may describe consumers’ preferences according to
their profile and perceptions.
Therefore, we defined three research objectives:
1. To identify the quality attributes valued by consumers when choosing wine
2. To understand the differences in red and white wine reputation, i.e., to identify which
attributes are recognized in each of these products
3. To compare consumers’ preferences according to their values
4.2. Formal Hypothesis
Aiming to amplify this study in the form of a descriptive research we have developed formal
hypothesis. The hypotheses of which we started are based on the literature review, yearbooks from several entities related to wine sector, professionals’ opinions and also on theoretical framework discussed along this research.
a) Red wine is thought to have higher quality when compared to others
b) People spend the same amount of money regardless of favourite type of wine
c) White wine is thought to be the favourite among feminine public
d) Red wine has a taste that pleases the elder consumer more
e) People whose favourite type of wine is white wine are more adventurers
f) People whose favourite type of wine is white wine are more self-confident
20
CHAPTER 5 - CONTEXT OF RESEARCH
Our context of research represents a national and an international preview.
5.1. National Data
The International Organization of Vine and Wine (OIV) and Institute of Vine and Wine (IVV)
agree on the consecutive worldwide decline of wine consumption although there are some
statements about less but high quality wine consumption.
In Portugal, wine consumption per capita (about 45 litters / inhabitant / year) and agricultural
area allocated to grapes for wine (over 4000 hectares) are significant enough to justify this
analysis (IVV, retrieved from www.ivv.min-agricultura.pt).
Other relevant data to justify the relevance of this concern is that Portugal is the 8th country in
the world with the largest area of vineyards, 10th largest exporter in the world (International
Organization of Vine and Wine [OIV], 2010), 2nd place in consumption per capita (only
preceded by France and considering that Europe represents about 70% of total global
consumption). National Statistics Institute (NSI) disclosed data with information referring to
2009, with forecasts for 2007-2008 slightly over the verified data.
Campaign Consumption (hl/Year) 2008 / 2009 4514
2007/2008 4568
Campaign Consumption per capita (l/ hab/year) 2008 / 2009 44,90
2007/2008 45,40
Source: NSI – Wine consumption in annual hl for 2007/2008 and 2008/2009.(Balance of Supply Plant Products. Retrieved from www.ine.pt.)
Source: NSI – Annual wine consumption per capita for 2007/2008 and 2008/2009.(Balance of Supply Plant Products. Retrieved from www.ine.pt.)
Table 5.1.1.: NSI’s statistics
5.1.1. Portuguese Market Organisation
Grape varieties are categorized according to the colour of its skin. Here we present Portuguese
native grape varieties: Alvarinho (white), Arinto / Pedernã (white), Encruzado (white), Fernão
Pires / Maria Gomes (white), Loureiro (white), Aragonês / Tinta Roriz (red), Baga (red),
Castelão (red), Touriga Franca (red), Touriga Nacional (red), Trincadeira / Tinta Amarela (red).
Enlightened by Market Common Organisation for Wine, a restructuring of vineyards is being
carried out, so values of planted areas and types of varieties are slightly ambiguous.
Currently, the following hectares are already restructured and catalogued.
Region Area (Ha)
Minho 1.033
Trás-os-Montes 118
Douro 1.091
Beiras 197
Estremadura 244
Ribatejo e Terras do Sado 190
Alentejo 698
Algarve 10
Total 3.582
Table 5.1.1.1.: Hectares restructured Source: IVV, 2009. Retrieved from www.ivv.min-agricultura.pt
21
5.2. International Data
5.2.1. European Union Vineyard
The development of the European Union vineyard has been affected by the implementation of
new community regulations. This common market structure allows wine producers to receive
a permanent desertion premium based solely on those individuals seeking subsidies within the
framework of a budgetary quota, allowing the overall grubbing up of 175 mha over 3 years.
This procedure was implemented after the 2008 harvest and the current results are: Spain is
the main country affected, with a reduction in its vineyard of 31 mha (-2.8%), the Italian
vineyard suffered an overall reduction estimated to be 14 mha (-1.7%), France reduced its
vineyard by a further 12 mha, Portugal and Greece by 1 mha.
5.2.2. Wine Production
2010 production, like 2007 and 2008 is one of the lowest wine productions in the last fifteen
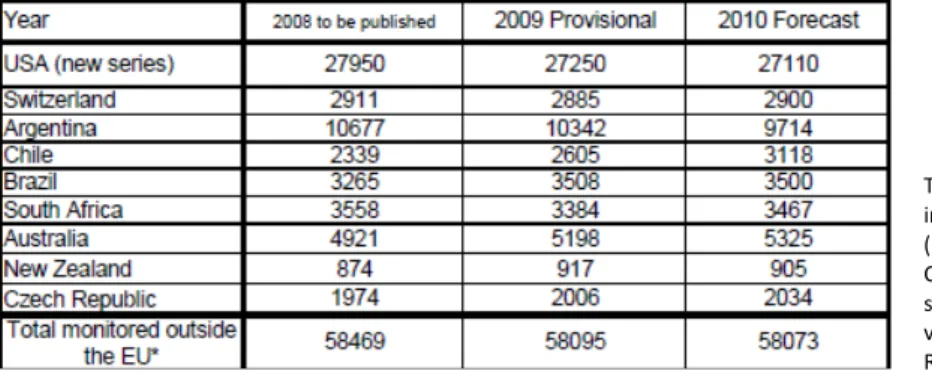
years in EU. Trends for the rest of the world in 2010 are: USA with 19.6 Miohl, Chile with 8.8
Miohl, Argentina with 16.3 Miohl, South Africa with 9.2 Miohl, and Australia with 11,2 Miohl.
5.2.3. Global Wine Consumption in 2010
Due in particular to global economic crisis, consumption in 15-EU proofed a particularly
significant decrease between 2008 and 2009. International Wine and Spirit Research (IWSR)
however predict an increase in consumption from 2010 to 2015. The next tables show wine
consumption tendency in EU and in the rest of the world. Annual statistics reports on the
world vitiviniculture situation in 2009 and 2010 explain these numbers and circumstances.
Table 5.2.3.1.: Developments in EU wine consumption (Unit: mhl). Source: Castellucci F. (2011). Annual statistics report on the world vitiviniculture situation in 2010. Retrieved from www.oiv.org
22
CHAPTER 6 – METHODOLOGY
In this chapter we present type of methodology, sample design and data collection and
questionnaire structure.
6.1. Type of Methodology
This is a cross-sectional research, involving two stages: exploratory followed by descriptive.
We started by collecting secondary data through specialized publications, expert blogs
(professionals or amateurs). We have also been monitoring national and international wine
critics. Through personal contacts and professionals (winemakers, fraternities, resellers) we
achieved some primary data to work with.
With the information we have gathered, and the subsequent literature review already
presented we were able to identify accurate opportunities of analysis and practical problems
to be addressed in order to proceed with the second stage: the descriptive research.
6.2. Sample Design and Data Collection
We conducted a quantitative analysis through surveys (questionnaires) with a convenience
sampling. We have organized Portuguese population in regions and relying on our personal
contacts, certain entities were asked to disclose our questionnaire (wineries, restaurants,
wines hops). These entities were selected for having a public email or Facebook page.
We have chosen the questionnaire because it is the method that offers greater ease to collect
data, greater ease to registry data, less financial implications, less time spent in collecting
answers. Questionnaires were self-administered, distributed through Qualtrics and available
for 12 days, in 2 languages (Portuguese and English – annex II and III) to ensure potential
international respondents.
6.3. Questionnaire Structure
This questionnaire has 7 sections. Section number one is denominated “You and others” and
has 1 question: Human Values in 21 statements defined by Schwartz (1992). Section number
two is about “Perception of white and red wine” presenting 6 questions: Corporate Character
Scale by Davies et al (2004); level of agreement with 16 statements about preferences and
consumption of wine; identifying 5 adjectives to describe both white and red wine with good
and bad reputation. “Wine and country-of-origin” is section number three and has 2 questions:
identifying countries from which respondents have tasted wines; level of agreement with 12
statements about Portuguese wines. Fourth section is about “Consumption Habits” and
23 fifth section with just 1 question concerning preferences on type of wine. Second last section
considers 4 questions about “Selecting and Shopping”: who usually decides about what wine to have at home, characterising one’s knowledge about wine; the importance of 24 items when choosing a wine they don’t know; average price of bottles respondents usually buy. Last
section is “Personal Data” with 7 topics: age, sex, professional activity, nationality - and district
- academic degree and net income patterns.
24
CHAPTER 7 – RESULTS PRESENTATION AND DISCUSSION
This chapter presents a description of our sample, followed by data analysis (this analysis was
developed using SPSS (Statistical Package for Social Sciences)).
7.1. Sample Characterization
7.1.1. Socio-demographic data
Respondents to this questionnaire are balanced in age (36% have until 25 years old; 34%
between 25 and 35 years old and 30% are older than 35 years old) (Figure 3). Our sample is
composed by 58% of women and 42% of men (Figure 4). Respondents’ geographically
distribution is verified in table 7.1.1.1 (approximately 40% living in Lisbon, the remaining group
is from all over the country). Professional Activity among our respondents is organized as in
figure 5.
District % District %
Lisboa 42,1 Faro 0,9
Setúbal 7,5 Nenhum 0,9 Porto 4,7 Ponta Delgada 0,9
Évora 3,7 Portalegre 0,9 Leiria 3,7 Santarém 0,9 Beja 2,8 S.Miguel (Açores) 0,9
Vila Real 1,9 Viseu 0,9 Cascais 0,9
Figure 3: Age Profile (ANNEX VII - Age recoded)
Figure 4: Sex Profile (ANNEX VIII - Sex)
Table 7.1.1.1.: Geographic Distribution (ANNEX IX - Residence – District)
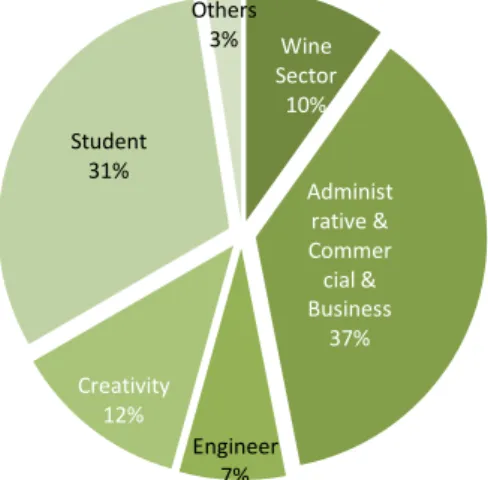
Figure 5: Professional Activity Profile (ANNEX IV Professional Activity)
< 25, 36% 25 to 35, 34% > 35,
30% Men
42% Wo
men 58%
Wine Sector 10%
Administ rative & Commer cial & Business
37%
Engineer 7% Creativity
12% Student 31%
25 7.1.2. Human Values
There are Motivational Types of Values to which both genders identify less (or identify below the mean) and they are: Benevolence, Self-Direction, Stimulation and Security. On the opposite line, Motivational Values to which both - men and women – identify more above the mean are: Universalism, Hedonism, Realization, Power and Tradition (this last one, is classified close to zero (0)), meaning, it is not a value to which they attribute importance.
We highlight the fact that women identify more when it comes to Hedonism and Realization. Conformism is not something to which men identify themselves, but women even less.
Figure 6: Motivational Types according to Sex (ANNEX V - Human Values – Motivational Types)
7.2. Wine Reputation
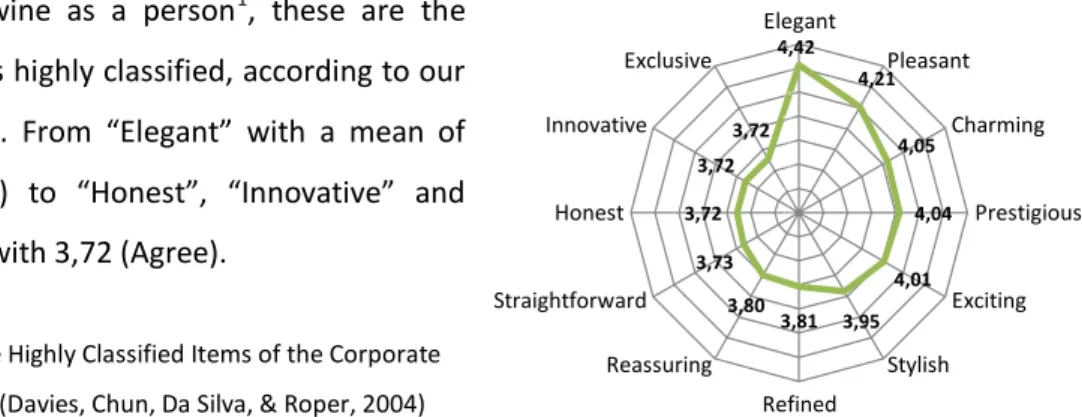
Evaluating wine as a person1, these are the
twelve items highly classified, according to our respondents. From “Elegant” with a mean of 4,42 (Agree) to “Honest”, “Innovative” and “Exclusive” with 3,72 (Agree).
Figure 7: Twelve Highly Classified Items of the Corporate
Character Scale (Davies, Chun, Da Silva, & Roper, 2004)
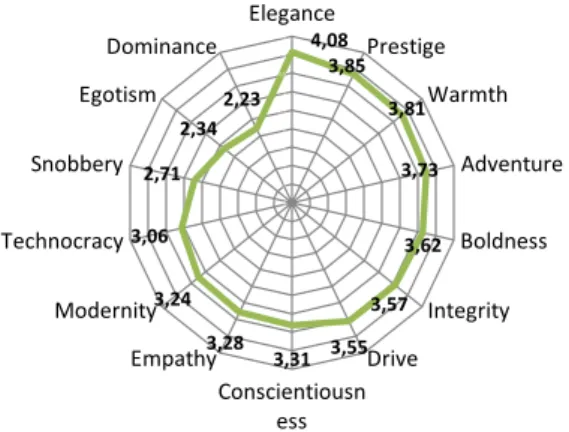
Respondents associated wine to the following human characteristics (4 - I agree): Elegance,
Prestige, Warmth, Adventure, Boldness, Integrity and Drive. Egotism and Dominance are
human characteristics to which people relate wine the less (2 –I disagree). But some of these
characteristics could not be associated to a positive nor negative tendency: Conscientiousness,
Empathy, Modernity, Technocracy and Snobbery (3 – Do not agree or disagree). (Figure 8 and
ANNEX VI).2
1
Scale from 1(Totally Disagree) to 5 (Totally Agree)
2
Scale from 1(Totally Disagree) to 5 (Totally Agree)
-0,6 -0,4 -0,2 0 0,2 0,4 0,6 0,8 -0,38 0,32 -0,36 -0,5 0,37 0,15 0,42 -0,32
0,05 0,09
-0,22 0,24
-0,48 -0,48 0,71
0,49
0,31
-0,41 -0,32
0,06 Homem
26 Figure 8: Wine Reputation through Corporate
Character Scale (Davies, Chun, Silva, & Roper, 2004)
“Agreeableness” (3,55 – Agree ), “Chic” (3,55 – Agree) and “Enterprise” (3,53 – Agree) are the dimensions our respondents considered to describe better wine as a person. “Competence”
(3,31 – Do not agree or disagree), “Informality” (3,01) and “Machismo” (2,57) were not
considered to describe wine as a person3.
Figure 9: Dimensions that describe wine as a
person through Corporate Character Scale
(Davies, Chun, Silva, & Roper, 2004)
7.2.1. Differences in Red and White Wine
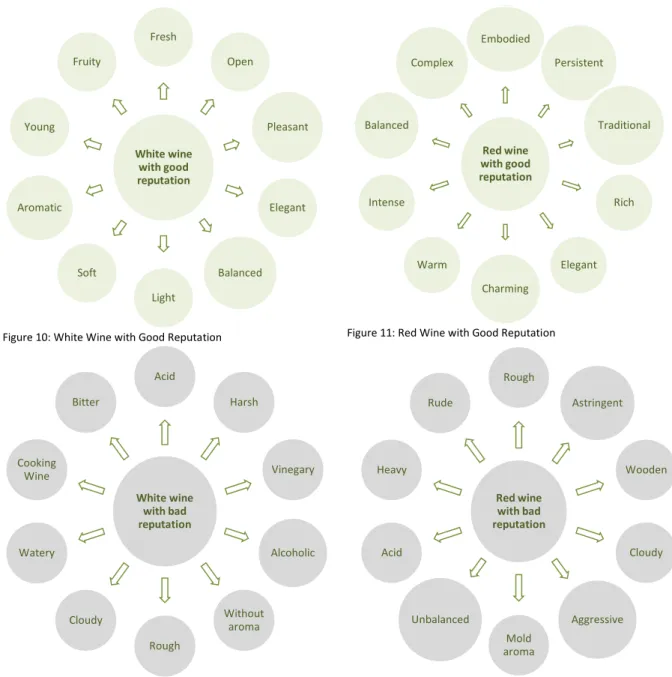
Our first objective is to identify quality attributes valued by the consumer in a wine. These
mind maps according to colour and good or bad reputation, reveal us how people perceive
these products. They are the result of four open questions we included in our questionnaire in
order to collect from respondents 5 adjectives to describe red and white wine with good and
bad reputation.
3
Scale from 1(Totally Disagree) to 5 (Totally Agree)
27 Figure 10: White Wine with Good Reputation Figure 11: Red Wine with Good Reputation
Figure 12: White Wine with Bad Reputation Figure 13: Red Wine with Bad Reputation
7.2.2. Choosing Wine
Considering the importance of certain elements when people choose a wine they do not know,
we represent our conclusions in the following table4:
Item Mean Item Mean
Taste 4,5 Vintage 3,7
Aroma 4,4 Experts' critics 3,6
Price 4,1 Complexity 3,6
Colour 4,0 Description on Labels 3,6
Balance 3,9 Appellation 3,6
Region Reputation 3,9 Producer Experience 3,5
Design of bottle and package 3,8 Innovative product 3,4
Grape Varieties 3,8 Aging Potential 3,4
Appearance 3,7 Promotions 3,4
Country-of-origin 3,7 Relation to the region (geographical proximity) 3,3
Producer Reputation 3,7 New brand on the market 3,1
Brand 3,7 Advertising 3,0
Table 7.2.2.1.: Importance of certain elements, when choosing a wine people do not know.
4
28 Taste had the highest mean (4,5 in a scale from 1- Not Important to 5 – Very Important).
Aroma, Price, Colour, Balance, Region Reputation, Design of bottle and package, Grape
Varieties, Appearance, Country-of-origin, Producer Reputation, Brand, Vintage, Experts' critics,
Complexity, Description on Labels, Appellation and Producer Experience are important (4)
when choosing a wine people do not know.Aging Potential, Producer Experience, Relation to
the Region (geographic proximity), Advertising, Promotions, New Brand on the Market and
Innovative Product: these are factors that respondents consider indifferent (3) when
evaluating a wine they do not know. We enhance the fact that promotions are part of this
group, not being emphasized by respondents.
7.3. Hypothesis and its Analysis
Here we present our hypothesis and its analysis.
Hypothesis a) Red wine is thought to have higher quality when compared to others.
To explore if red wine is thought to have higher quality than others we developed a descriptive
analysis through frequencies tables.
Figure 14: Red wines generally offer higher quality than others. ANNEX X - Red wines generally offer higher quality than others
51% of our respondents claim to disagree with the fact that red wines generally offer higher
quality than others. Notice that 23% do not agree or disagree.
With these results we reject this hypothesis.
Hypothesis b) People spend the same amount of money regardless of favourite type of wine. In order to verify if people spend the same amount of money regardless of favourite type of
wine, we have used Kruskall-Wallis test. This test measures the level of association between
independent groups towards a numeric variable. After verifying that distribution is not normal
we considered using non-parametric tests.
Red Sparkling White Fortified Green Rosé
Asymp. Sig. 5€ or less ,505 ,418 ,322 ,316 ,663 ,508 Asymp. Sig. 5€ to 15€ ,492 ,887 ,607 ,499 ,091 ,104 Asymp. Sig. 15€ to25€ ,077 ,656 ,304 ,076 ,864 ,289 Asymp. Sig. 25€ to50€ ,664 ,434 ,716 ,107 ,886 ,316 Asymp. Sig. 50€ or less ,153 ,078 ,598 ,395 ,844 ,721 Table 7.3.1.: Relationship between favourite type of wine and money spent.
27%
24% 23%
18%
4% Totally disagree
29 This hypothesis is accepted through the data analysis of all cases. Average money spent in
wine per bottle is the same regardless of favourite type of wine.
ANNEX XI - Type of wine do you prefer * About the money you spent in wine (Kruskall-Wallis: p > 0,05)
Hypothesis c) White wine is thought to be the favourite among feminine public
Distribution is normal and homogeneity of variances has been verified so we may continue
with parametric tests. To analyse if preference of wine differs in sex, we developed a t-student
test in order to compare two samples: men and women.
Though we verify some mean differences among women (38,17) and men (43,65), these are
not significant (t (78) = 1,116 p=0,268), (ANNEX XII - Type of wine do you prefer * Sex) . This means the
matter about white wine being associated to women’s favourite is not verified in our sample.
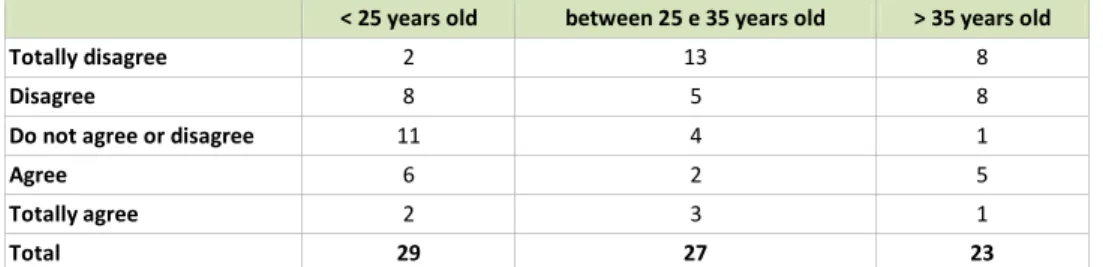
Hypothesis d) Red wine has a taste that pleases the elder consumer more
To analyse if there are mean differences among categories of ages, we developed a Kruskal
Wallis test (because all our sub samples’ dimensions are inferior to 30 elements we decided to
apply a non-parametric test).
Kruskal Wallis: H(2) = 8,109 p = 0,017, so this hypothesis is rejected. To proceed with a more
accurate analysis we present mean differences among categories of ages, i.e. our primary
claim (red wine has a taste that pleases the elder consumer more).
In the following table we can verify that youth (<25 years old) adopted scale’s middle position:
do not agree or disagree. All others respondents totally disagree or disagree that red wine has
better flavour than others.
< 25 years old between 25 e 35 years old > 35 years old Totally disagree 2 13 8
Disagree 8 5 8
Do not agree or disagree 11 4 1
Agree 6 2 5
Totally agree 2 3 1
Total 29 27 23
Table 7.3.2.: Opinion on red wines having better flavour than others according to age ANNEX XIII - Red wines have better flavour than others * Age
Hypothesis e) People whose favourite type of wine is white wine are more adventurers
To answer this hypothesis we have developed a Mann-Whitney Test (to compare independent
samples). Again we have decided to apply a non-parametric test because distribution is not
normal.
We have proceeded to dichotomization of Human Values indicators “He looks for adventures and likes to take risks. He wants to have an exciting life.”
30 (U = 538,000, p = 0,138), therefore we accept the hypothesis that preference of white wine
does not differ according to adventurer profile.
ANNEX XIV - People whose favourite type of wine is white wine are more adventurers
Hypothesis f) People whose favourite type of wine is white wine are more self-confident
To answer this hypothesis we have developed a Mann-Whitney Test (to compare independent
samples: Self-confident and Not self-confident). Again we have decided to apply a
non-parametric test because distribution is not normal.
We have proceeded to dichotomization of Human Values indicators “Being very successful is important to him. He hopes people will recognize his achievements.”
1 – Self-confident, 2 – Not self-confident
(U = 286,500, p = 0,148), therefore we accept the hypothesis that preference of white wine
does not differ according to self-confidence profile.
ANNEX XV - People whose favourite type of wine is white wine are more self-confident
Hypothesis g) Women who consume wine consider themselves as independent.
Does identification with this indicator “It is important to him to make his own decisions about
what he does. He likes to be free and not depend on others” vary according to sex? In order to
answer this question we have developed a Mann-Whitney test to compare independent
samples (men and women). According to these results (U = 727,500, p = 0,483) we are able to
verify that there are no significant differences between genders. We may conclude that the
willing of being free and the sense of independence has no relation to women who consume
wine.
31
CHAPTER 8 - CONCLUSIONS
Our objectives and hypothesis are presented in the following table:
Objectives Constructs Hypotheses
Identification of quality attributes valued by the consumer when choosing a wine
Duality Quality-Price
a)Red wine is thought to have higher quality when compared to others
b)People spend the same amount of money regardless of favourite type of wine
Understanding the differences in red and white wine reputation, i.e., identifying attributes that are recognized in each of these products
Identity & Image
c)White wine is thought to be the favourite among feminine public
d)Red wine has a taste that pleases the elder consumer more
Comparing consumers’
preferences according to their values
Human Values
e)People whose favourite type of wine is white wine are more adventurers
f) People whose favourite type of wine is white wine are more self-confident
g) Women who consume wine consider themselves as independent
Table 8.1.: Objectives, Constructs and Hypothesis
Target audience is composed by 107 individuals from Porto to Faro, but only 81 completed the
questionnaire. Respondents have from 20 to 66 years old, 58% of women and 42% of man.
Most of our respondents work in administrative/commercial or business areas, though a high
percentage is a student (31%).
This research cannot be considered to have external validity because respondents were
reached through a convenience method. Nevertheless, our conclusions on the matter of
reputation of wine, its perception and consumption habits reveal some trends of our society.
51% of our respondents claim to disagree with the fact that red wines generally offer higher
quality than others (notice that 23% do not agree or disagree). Landon and Smith (1998) claim
that reputation is an indicator on which consumers rely on to infer the quality of a product and
to make consumption decisions, so we would conclude that there are no differences on this
32 Remember that Milgrom & Roberts (1986) brought the concept of price being used by the
consumer as a reference of real and expected quality levels. Transporting it to different types
of wine we conclude that the average of money spent in wine per bottle is the same regardless
of favourite type of wine, i.e. no matter the colour of the wine. It is important to say that we
have considered green wine as a type of wine though technically it is a geographic region. Our
primary research resulting from the conversations with some professionals allowed us to
maintain this option because most people would notice Vinho Verde to miss in the list of
favourite wines.
According to Lowengart (2010), who identifies several sources of heterogeneity influencing
consumer preferences, such as personal differences (
gender), we
have tried to destroyanother myth: white wine is the ladies’ favourite. And the truth is: it is not verified in our
sample. On the other hand, considering age as another personal difference, elder people do
not prefer red wine. But it is important to notice that a high percentage of young people (under 25) answer “Do not agree or disagree” with the fact that red wine has a better taste than other wines.
About Human Values, the literature has guided us to consider pertinent to analyse the fact
that preference for white wine would be somehow related to people feeling more adventurer
and self-confident. But we have not verified that.
We have also concluded that the willing of being free and the sense of independence has no relation to respondents’ gender, i.e. being a woman (in this context of drinking wine) has no relation with the identification of this indicator “It is important to make her own decisions
about what she does. She likes to be free and not depend on others.”
To our respondents both types of wine with good reputation are considered to be “Balanced”
and “Elegant” - white wine associated to “Softness” and “Freshness” while red is supposed to
be “Embodied” and “Complex”. When it comes to bad reputation: “Rough”, “Acid” and “Cloudy” were used to describe both red and white wine. If white wine with bad reputation is “Watery”, “Bitter” and “Vinegary”, red wine with bad reputation is “Aggressive”, “Heavy” and “Rude”.
According to the Corporate Character Scale (Davies et al., 2004), respondents describe Wine
33
CHAPTER 9 – LIMITATIONS AND SUGGESTIONS FOR FUTURE RESEARCH
Some limitations of our research refer to convenience sampling implying selection bias and no
representativeness. Because we choose to develop a descriptive research, we are aware that
some may not accept it as a stand-alone piece of work. Data was collected for a short period of
time without proper disclosure of the questionnaire, confirming the fact that we cannot
assume external validity. Global Economic Crisis made more difficult people to pay attention to
this kind of activity – some organizations disappeared and communication tools (facebook) lost
its function towards our research.
We suggest this study to be updated through more recent yearbooks, to update context
analysis in order to internationalize this research, collecting data from different countries in all
continents. Information such as denominations (Annex I) would need updating due to the
recent reorganization of vines and geographic areas with communitarian purpose. But also NSI
has more recent yearbooks already launched which could adjust our context. An explanatory
study about the causal relation between respondents’ nationality and wine preferences and/or
wine consumption habits could embody a new set of objectives.
34
REFERENCES
Aaker, J. L. (1997). Dimensions of Brand Personality. Journal of Marketing Research, XXXIV (August), 347-356.
Benfratello, L., Piacenza, M., & Sachetto, S. (2009). Taste or Reputation: What Drives Market Prices in the Wine Industry? Estimation of a Hedonic Model for Italian Premium Wines. Applied Economics, 41, 2197-2209.
Brady, A. K. O. (2002). Profiling Corporate Imagery, a Sustainability Perspective. Working Paper, Judge Institute of Management, APRIL 2002, 1-38.
Bretherton, P. (2004). National Competitive Advantage as the Context for Marketing Strategy: An Empirical Study of the New Zealand Wine Industry. International Journal of Wine Business Research, 16 (1), 36-52.
Bromley, D. (2001). Relationships Between Personal and Corporate Reputation. European Journal of Marketing, 35 (3/4), 316-334.
Caruana, A. (1997). Corporate Reputation: Concept and Measurement. Journal of Product & Brand Management, 6 (2), 109-118.
Chaney, I.M. (2000). External Search Effort for Wine. International Journal of Wine Marketing, 12 (3), 5-15.
Chaney, I.M. (2002). Promoting Wine by Country. International Journal of Wine Business Research, 14 (1), 34-40.
Chun, R. (2005). Corporate Reputation: Meaning and Measurement. International Journal of Management Reviews, 7 (2), 91-109.
Cox, D. (2009). Predicting Consumption, Wine Involvement and Perceived Quality of Australian Red Wine. Journal of Wine Research, 20 (3), 209–229.
Davies, G., Chun, R., Vinhas da Silva, R., & Roper, S. (2004). A Corporate Character Scale to Assess Employee and Customer Views of Organization Reputation. Corporate Reputation Review, 7 (2), 125-146.
Devine, I., & Halpern, P. (2001). Implicit Claims: The Role of Corporate Reputation in Value Creation. Corporate Reputation Review, 4 (1), 42-49.
Fombrun, C. (1990). What’s In a Name? Reputation Building and Corporate Strategy. Academy of Management Journal, 33 (2), 233-258.
Fombrun, C. (2005). Building Corporate Reputation Through CSR Initiatives: Evolving Standards. Corporate Reputation Review, 8 (1), 7-12.
Gardberg, N. A., & Fombrun, C. (2002). For Better or Worse – The Most Visible American Corporate Reputations. Corporate Reputation Review, 4 (4), 385-391.
Gardberg, N. A., & Fombrun, C. (2002). The Global Reputation Quotient Project: First Steps Towards a Cross-Nationally Valid Measure of Corporate Reputation. Corporate Reputation Review, 4 (4), 303-307.
Gioia, D.A., Schultz, M., & Corley, K.G. (2000). Organizational Identity, Image and Adaptative Instability. Academy of Management Review, 25 (1), 63-81.
Gotsi, M., & Wilson, A. (2001). Corporate Reputation: Seeking A Definition. Corporate Communications, 6 (1), 24-30.
Grunig, J., E. (1993). Image and Substance: From Symbolic To Behavioral Relationships. Public Relations Review, 19 (2), 121-139.
Landon, S., & Smith, C. (1998). Quality Expectations, Reputation and Price. Southern Economic Journal, 64 (3), 628-647.
Lowengart, O. (2010). Heterogeneity in Consumer Sensory Evaluation As A Base For Identifying Drivers Of Product Choice. Journal of Business and Management, 16 (1), 37-50.
Melewar, T. C., & Jenkins, E. (2002). Defining the Corporate Identity Construct. Corporate Reputation Review, 5 (1), 76.
Milgrom, P., & Roberts J. (1986). Price and Advertising Signals of Product Quality. Journal of Political Economy, 94 (4), 796-821.
Panzone, L., & Simões, O. (2009). The Importance of Regional and Local Origin In The Choice Of Wine: Hedonic Models Of Portuguese Wines In Portugal. Journal of Wine Research, 20 (1), 27-44.
Pruzan, P. (2001). Corporate Reputation: Image and Identity. Corporate Reputation Review, 4 (1), 50-64.
35 Schamel, G. (2006). Geography Versus Brands in a Global Wine Market.Agribusiness, 22 (3), 363–374.
Schwartz, S. H. (1992). Universals in the Content and Structure of Values: Theory and Empirical Tests In 20 Countries. In M. Zanna (Ed.), Advances in experimental social psychology, 25, 1–65. New York: Academic Press. Spector, A. (1961). Basic Dimensions of the Corporate Image. Journal of Marketing, 25 (Oct 1961), 47-51.
Tirole, J. (1996). A Theory of Collective Reputations (With Applications to the Persistence of Corruption and to Firm Quality). The Review of Economic Studies, 63, 1–22.
Wartick, S.L. (2002). Measuring Corporate Reputation: Definition and Data. Business and Society, 41 (4), 371-392.
Sites/Blogs
Robinson J. (2007, August 16). Let's Hear it for White Wine. Retirado de www.jancisrobinson.com.
Parker, R. (2001-2011). PARKER POINTS®. Retrieved from https://www.erobertparker.com/info/legend.asp.
http://www.infovini.com/pagina.php?codNode=18012 – regiões vitivinícolas http://www.ivv.min-agricultura.pt/np4/regioes - Lista IGPs e informação económica
Books
Hughes, N. & Langton P. (2009). 500 White Wines. London, Apple Press.
Robinson, Jancis (1994). The Oxford Companion to Wine. Oxford: Oxford University Press.
Saunders, M., Thornhill, A., & Lewis, P. (2009). Research Methods for Business Students (5th ed). Harlow, England: Prentice Hall.
Fortin, M., Côté, J., & Filion F. (2006). Fundamentos e Etapas do Processo de Investigação. Montreal, Canada: Cheneliére Éducation.
Annual Statistics
Castellucci F. (2010). Annual Statistics Report on the World Vitiviniculture Situation In 2009. Retrieved from www.oiv.org
Castellucci F. (2011). Annual Statistics Report on the World Vitiviniculture Situation In 2010. Retrieved from www.oiv.org
Others
Roberts, P., & Reagans, R. (2001). Market Experience, Consumer Attention and Price-Quality Relationships for New World Wines in the US Market, 1987-1999. Academy of Management Proceedings.