Sensitivity analysis and optimization for occupant safety in
automotive frontal crash test
Abstract
Nowadays, safety is a competitive advantage for automotive products and therefore receives considerable attention by automotive research centers. In this paper, a frontal crash test of sedan product of an under development platform is simulated and occupant head injuries are investigated based on ECE R94 regulation. First, an initial evaluation of the crash behavior of the sedan car is carried out and then airbag, dummy and seat belt are added to the model to study occupant head injuries under crash test. In this study, peak head acceleration and head injury criteria (HIC36) are considered as two output parameters based on ECE R94 regulation. Considering these two output parameters, sensitivity analysis and optimization are performed using Taguchi and analysis of variance (ANOVA) methods. In this way, airbag distance to dummy, trigger time, initial inflator gas temperature and tank pressure are considered as input parameters. Obtained results show that in all computer experiments designed by Taguchi responses values satisfy the requirements of ECE R94. Two different out-of-position conditions are considered by reducing the distance between dummy and airbag relative to the optimum design obtained by Taguchi. The worst case of design and its response values are also predicted using Taguchi. Finally, re-evaluating finite element analyses are performed based on the optimum and the worst cases. The results of these simulations show the validity of approach of this paper.
Keywords
Frontal crash simulation; Head injury criterion; Optimization; Sensitivity analysis; ANOVA; Taguchi
1 INTRODUCTION
Nowadays, safety is one of the most important attributes that affects the market of automotive products. Hence, many researches have been carried out by automakers to improve the safety of their products. To provide more occupant protection, safety regulations developed for automobiles are getting stricter day by day. Vehicle safety in European Union countries is regulated mainly by international standards and regulation devised by the European Union (EU) and the United Nations Economic Commission for Europe (UN-ECE). The ECE regulations are also used in many other countries like Asian countries. ECE R94 is one of the well-known regulations which is used for frontal crash evaluation test (United Nations Economic Commission for Europe, 1998).
Actual crash testing according to the safety regulations is so expensive and time-consuming. Therefore, to evaluate the crash behavior of automobiles, before performing actual tests, computer experiments usually are carried out. According to the results of such simulations, the initial designs can be modified. There are exist previous research works in the field of automotive impact simulation. 1997 Honda Accord full and 50% offset front impact, side impact and two car impact were simulated by Cheng et al. (2001). The results demonstrated that the simulated model is compatible with these types of crash tests. Qi et al. (2006) performed front impact simulation for a commercial vehicle. They showed that by modifying material and structure of automotive front box energy absorbing capacity was improved. Deng et al. (2013) studied occupant head injuries in the car side impact test. They modeled a Dodge Neon with dummy, airbag and seat belt in LSDYNA software. After that, Deng et al. (2014) assessed human head injuries in a side impact that quantify the tensile pressures and maximum strain profiles. The crashworthiness of side doors and B pillar in a Pole Side Impact Test is evaluated by Lilehkoohi et al. (2014). The results represented that to increase the amount of absorbed energy, the part which has more influence on the
Navid Asadiniaa
Abolfazl Khalkhalia*
Mohammad Javad Saranjama
a Automotive Simulation and Optimal Design
Research Laboratory, School of Automotive Engineering, Iran University of Science and Technology, Tehran, Iran.
E-mail: [email protected], [email protected], [email protected]
*Corresponding author
http://dx.doi.org/10.1590/1679-78254666
crashworthiness of the vehicle should be taken into greater consideration. Li et al. (2015) quantitatively estimated occupant injuries in automotive crash events. They used occupant injury criteria based directly on dummy responses and compared to those based solely on vehicle responses. Shojaeefard et al. (2015) examined the validity of the extent of four different simplified models of body-in-white (BIW) from different points of views. Beik et al. (2016) assessed the effectiveness of tapering S-rails in the automotive application using finite element method. They showed the reinforcing and tapering S-rails both could improve the energy absorption and specific energy absorption in static and dynamic loading conditions. A methodological approach which uses global deformation characteristics to simplify finite element vehicle models and crash barriers is presented by Schäffer et al. (2017). Safari et al. (2017) simulated a full frontal impact, side-impact and roof crush for a Dodge Neon vehicle to assess the structural crashworthiness. They showed that Advanced High Strength Steel (AHSS) materials, due to their excellent properties, have considerable potential for assessing a vehicle's crash safety performance.
It is obvious that there are many factors affecting car safety and therefore investigating effects of each parameter separately, need so many experiences and is not actually possible. In this way, for a more precise study of different parameters and their effects, a sensitivity analysis can be used. In this regard, different approaches such as Taguchi and analysis of variance (ANOVA) are available (Shojaeefard et al., 2016; Khalkhali et al., 2017a). Using these techniques one may observe the effect of design parameters on desired or required outputs. Deng et al. (2013) used Taguchi and ANOVA methods for sensitivity analysis of two criteria including peak head acceleration and the HIC36.
In this paper, firstly the full model of the passenger car is discretized in the HyperMesh software using appropriate elements. For frontal impact simulation, the model is then imported into Pam-Crash software. All test conditions are considered according to ECE R94 regulation. After an initial evaluation, Hybrid III dummy, seat belt, and airbag are added to FE model to evaluate driver head injury in the frontal impact. Using such model, optimization and sensitivity analysis are then performed. In this analysis, four input parameters and two output parameters are considered. Airbag distance to dummy, trigger time, initial inflator gas temperature and tank pressure are considered as input parameters. Peak head acceleration and the HIC36 are also considered as output parameters. Finally, finite element re-evaluation simulation is carried out based on the optimum and the worst design obtained by Taguchi method.
2 FRONT IMPACT FINITE ELEMENT SIMULATION
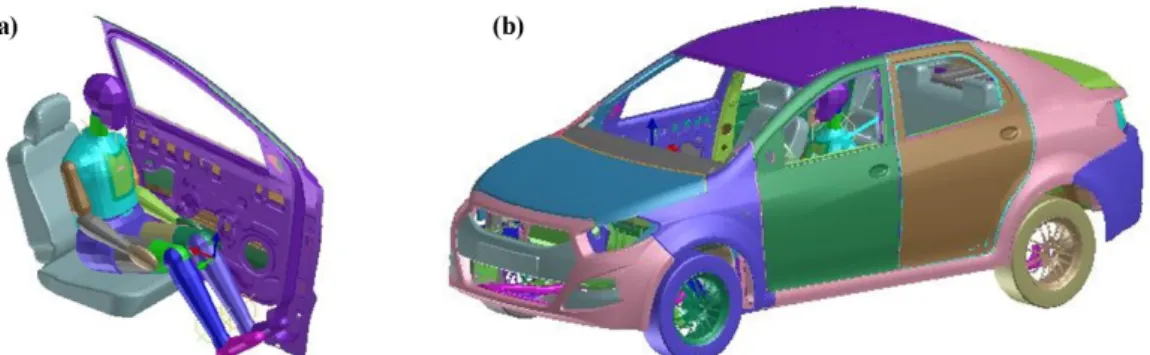
In this paper frontal impact of NP01 full vehicle model which is the main product of NP0 is simulated using Pam-Crash software. NP0 is an automotive national platform which is under development in Iran University of Science and Technology. Body in white (BIW) and the full vehicle CAD model of NP01 is shown in Figure 1.
Figure 1: NP01 CAD model: a) Body in white (BIW); b) full vehicle model
Table 1: Elements quality metrics
kind of quality failed
Skew 0.03%
Aspect 0.2%
jacobian 2.9%
warpage 3.9%
Table 2: Details of NP01 finite element model
Number of parts 246
Number of nodes 472770
Number of shells 430869
Rigid body connections 37
Spot weld connections 3114
Tied connections 91
Rigid bodies 1
Figure 2: a) NP01 full vehicle finite element model; b) Location of the spot welds on the NP01 BIW
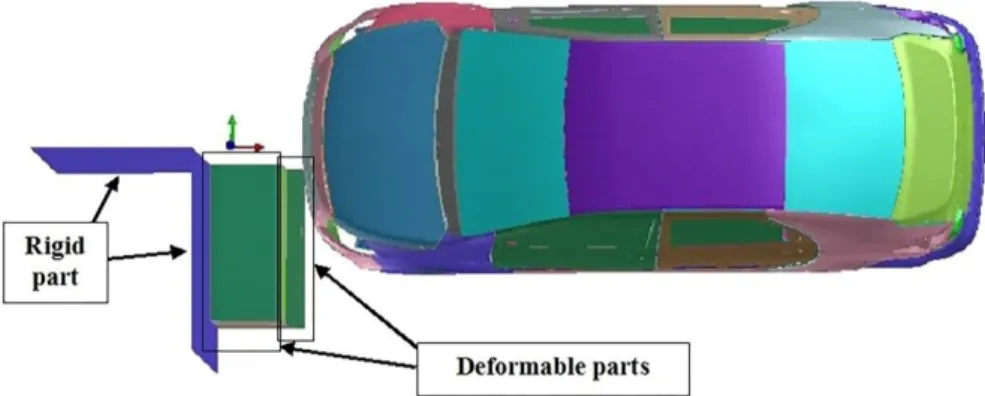
All test conditions are considered according to ECE R94 regulation. According to this regulation, test automotive velocity is considered equal to 56 km/h. The stable and deformable barrier is placed in front of the automotive with 40% offset (see Figure 3). The rigid part of barrier is fixed in three coordination. The friction coefficient between the components of the structure at impact and the friction coefficient between the structures and the barrier are considered of 0.1 and 0.3, respectively. Finite element model of the barrier includes three different parts: two front parts of the barrier are deformable made of null material and rear part of the barrier is considered rigid.
2.1 BIW constitutive materials
Three types of steel are used in NP01 body including mild steels, high strength steels (HSS) and advanced high-strength steels (AHSS). Mild steels which have low high-strength with high elongation capacity are used for closure parts where formability is more important than strength. HS steels which have high strength with low elongation capacity are used for the rails which are located around the passenger cabin. This is why low deformation is allowable in the automotive passenger cabin. AHSS steels which have high strength and high elongation capacity simultaneously have good energy absorbing capacity and are used for energy absorbing components like s-rails (mid rail), shot-guns (upper rail), bumper beam and crash boxes. The steel materials which are used in the NP01 with their location are shown in Figure 4.
Figure 4: Constitutive materials of NP01 BIW
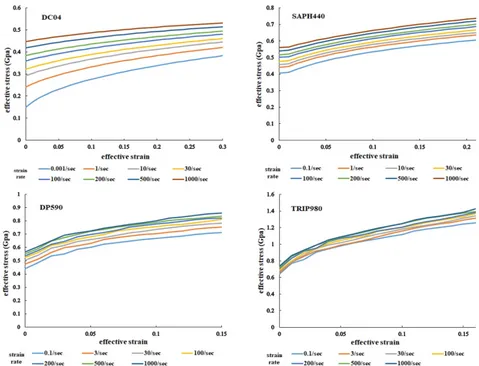
It is noteworthy that the crushing of automotive components occurs with high strain rate in a frontal impact. Therefore, constitutive materials behavior in different strain rates is needed for the simulation. Stress-strain graphs of the NP01 constitutive materials are shown in Figure 5 for different strain rates. For all steels, Young’s module 210 GPa, density 7800 kg/m3 and Poisson’s factor 0.3 are considered.
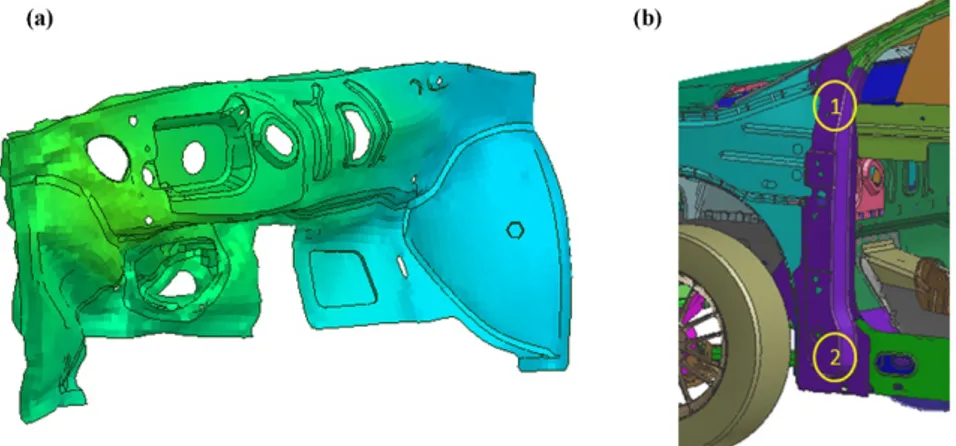
After developing the finite element model, initial simulation of NP01 crash behavior is carried out according to the ECE R94. Penetration of the firewall to the cabin (see Figure 6(a)) and deflection of the hinge pillar (lower A-pillar) are then evaluated to ensure minimal deformations in the cabin zone. Values of deformations in the firewall and the hinge pillar is represented in Table 3. Location of point 1 and 2 that their deflection is reported in Table 3 are shown in Figure 6(b). This is why that in automotive body design for crashworthiness, cabin zone deformations are considered as a criterion and must be minimum (see Figure 7). Results of this evaluation show that the body deformations are in the range of the target book and the system design specification (SDS) of NP01 product. The allowed deformation in the firewall and the hinge pillar is represented in Table 3.
Figure 6: a) Firewall deflection contour after crash test simulation and b) Locations of the point 1 and 2 on the hinge pillar which are used for calculating the deflection of the hinge pillar
Table 3: Deflection of body structure on A-pillar and firewall after crash test
position Structural Deformation
(mm) Allowed Deformation on the Target Book (mm)
Point1 of A-pillar 210 ≤200-250
point2 of A-pillar 220 ≤200-250
firewall 410 ≤380-420
Figure 7: Structure requirement for frontal impact (Malen, 2011)
2.2 Properties of dummy, airbag and seat belt
Table 4: Specifications of airbag model
universal gas constant 8.31 j.k-1.mol-1
volume correction factor 1
the molecular fraction of the gas 1
total exhaust orifice area 3000 mm2
discharge coefficient for exhaust orifices 1
the molecular weight of the gas 0.028 KN/mol
Table 5: Specifications of Hybrid III dummy’s model
Number of parts 50
Number of nodes 3698
Number of shells 3530
Number of joints 21
Table 6: Properties of seat belt model
FTOL 0.01 KN
pully ring friction coefficient 0.1
energy dissipation factor upon unloading 0.75
permanent strain factor after unloading 0.5
mass per unit length of the element 0.00013 kg/mm
strain limit for initial elastic behavior 0.01
Figure 8: The mass flow rate for airbag model
3 DESIGN OF EXPERIMENTS
In this paper design of experiments (DOE) is carried out using Taguchi method. Taguchi’s parameter design is widely recognized as an efficient asset for robust design. It provides a practical and systematic solution to achieve optimum performance, quality, and cost based on the best selection of design parameters. In recent years, due it’s high efficiency and outstanding reliability, Taguchi method has widely been recognized as a conducive optimization technique in engineering (Khalkhali et al., 2017b; Vankanti and Ganta, 2014).
According to ECE R94, the maximum head acceleration should be lower than 80 g (Liu et al., 2016). Moreover, the head performance criterion (HPC), which is also named as the head injury criterion (HIC), should not be over than 1000. The HIC36 which is used in this study as criterion can be calculated as follow (Schmitt et al., 2010):
2 1 2.5 2 1 2 12 2 2
1
tt
max
x y z
HIC
a t dt
t t
t t
a
a
a
a
(1)where a is the head acceleration and t1 to t2 is the maximum the HIC36 period time.
In this paper, the effects of four main parameters including tank pressure, trigger time, initial inflator gas temperature and airbag distance to dummy, on peak head acceleration and the HIC36 are investigated.
Airbag distance to dummy (D): The distance between steering wheel to dummy’s chest is one of the most important factors effective on injuries to the driver (Hallman et al., 2008). In fact, a driver that has less or high distance to the airbag is located out of position and it can cause significant injury to him or her. In this paper according to the body size of a human which includes short to normal men and women, three different distance level including 25 cm, 30 cm and 35 cm in considered for this factor.
Trigger time (Tt): Trigger time is the time between when the airbag sensor senses the accident and the time when the airbag starts to inflate. In this paper, according to the average of trigger time, three different times including 15, 25 and 35 ms are considered for different levels of this factor (Boran and Feltgen, 2001).
Initial inflator gas temperature (T): Airbag gas pressure and the temperature are modeled based on the ideal gas law during trigger time. According to the researches deployed on some vehicle’s airbag (Im et al., 2016), three different initial inflator gas temperatures 900 k, 1000 k and 1100 k have been considered for this factor.
Tank pressure when the bag is fully inflated (P): This parameter which is an inflator property is determined using the results from an inflator tank pressure test. In the tank test, the gas generated from an inflator is charged into a fixed volume tank. The airbag inflator is triggered within a closed volume and the change in tank pressure and temperature are recorded over time (Bathe, 2001; Wang, 1991). In this paper, three levels including 100, 150 and 200 kPa are considered for the tank pressure.
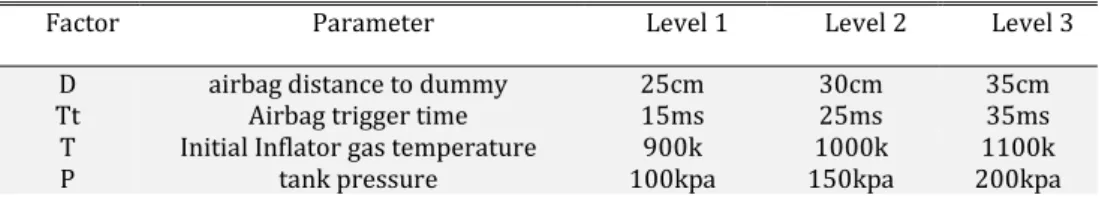
To develop DOE table using Taguchi, above mentioned variables are considered as designing factors and then three different levels including low, normal and high are assigned to them. These four factors and their levels are depicted in Table 7.
Table 7: Design factors and their levels in Taguchi analysis
Factor Parameter Level 1 Level 2 Level 3
D airbag distance to dummy 25cm 30cm 35cm
Tt Airbag trigger time 15ms 25ms 35ms
T Initial Inflator gas temperature 900k 1000k 1100k
P tank pressure 100kpa 150kpa 200kpa
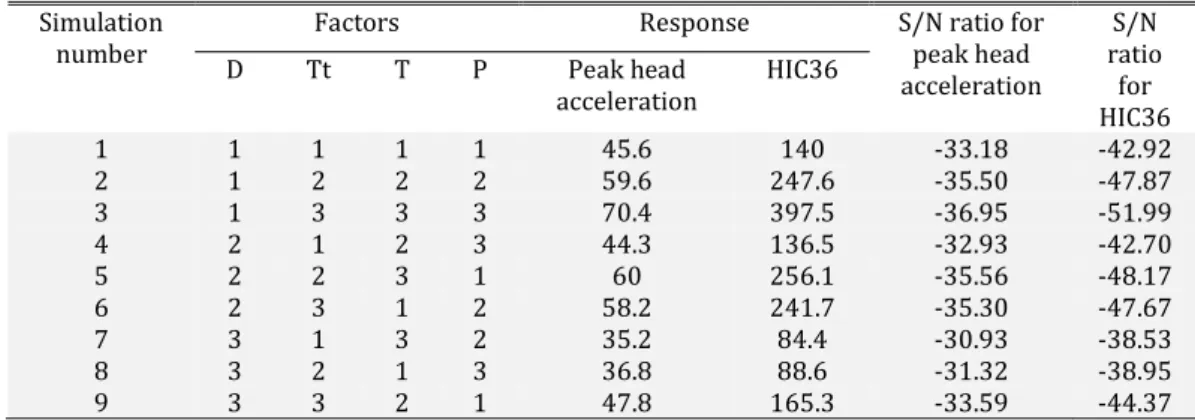
Table 8: The design of experiments by Taguchi method response value and signal to noise values for each experiment
Simulation
number Factors Response S/N ratio for peak head
acceleration
S/N ratio
for HIC36
D Tt T P Peak head
acceleration HIC36
1 1 1 1 1 45.6 140 -33.18 -42.92
2 1 2 2 2 59.6 247.6 -35.50 -47.87
3 1 3 3 3 70.4 397.5 -36.95 -51.99
4 2 1 2 3 44.3 136.5 -32.93 -42.70
5 2 2 3 1 60 256.1 -35.56 -48.17
6 2 3 1 2 58.2 241.7 -35.30 -47.67
7 3 1 3 2 35.2 84.4 -30.93 -38.53
8 3 2 1 3 36.8 88.6 -31.32 -38.95
9 3 3 2 1 47.8 165.3 -33.59 -44.37
4 RESULTS AND DISCUSSION
According to the Table 8, response value for peak head acceleration and the HIC36 for all computer experiments satisfy the criteria of 80 g and 1000 based on ECE R94 regulation. Maximum and minimum response for peak head acceleration and the HIC36 are related to the simulations 3 and 7. Side view of NP01 frontal impact simulation results at 5, 30, 55 and 75 ms for simulation 3 and 7 are shown in Figure 10. Simulation 3 has a lower airbag distance to dummy, more trigger time and tank pressure than simulation 7, but the same initial inflator gas temperature as simulation 7.
Figure 10: Side view of NP01 frontal impact simulation results at 5, 30, 55 and 75 ms for simulation 3 and 7
the average of peak head acceleration increases by increasing the trigger time. Moreover, peak head acceleration and the HIC36 in each decreases by increasing airbag distance to the dummy.
Table 9: peak head acceleration values and the corresponding time for each simulation
simulation number peak head acceleration (mm/ms2) Time (ms)
1 0.456496686 45
2 0.596122921 51
3 0.704163671 57
4 0.443487465 45
5 0.59940362 54
6 0.581631422 63
7 0.352236658 45
8 0.367575675 57
9 0.477917075 63
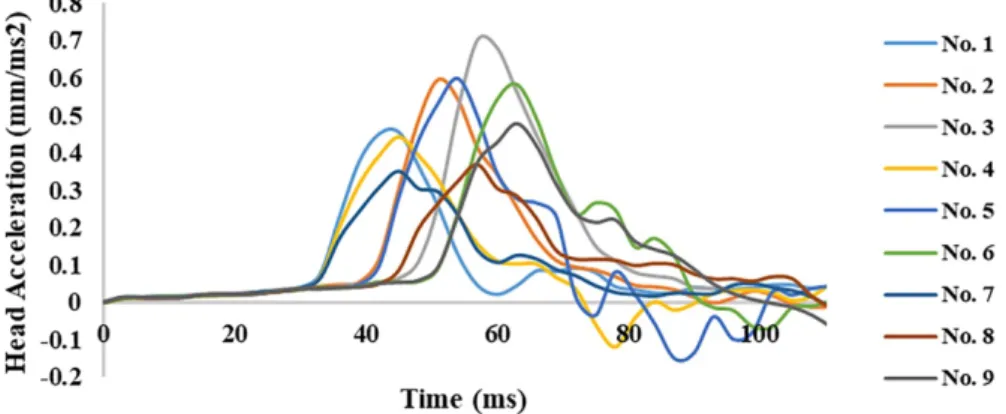
The Effect of trigger time and airbag distance approximately was analyzed here considering results represented in Figure 12. However, comprehensive analysis of the effects of effective parameters is not possible using such simple method. Therefore, Taguchi and ANOVA methods are used in continue.
Figure 11: Head acceleration variation versus time obtained from the simulations
Figure 12: a) The categories response of peak head acceleration obtained from the simulation; b) The categorized response of the HIC36 obtained from the simulation
4.1 Taguchi analysis
process designed with this goal will produce more consistent output regardless of the effects of uncontrollable factors.
In recent years, due to its high efficiency and outstanding reliability, Taguchi method has widely been recognized as a conductive optimization technique in engineering (Khalkhali et al., 2017b). For this purpose, the levels of each quality factor should first be determined so can be used in designing an orthogonal array. The orthogonal array, which indicates the balance of the design, estimates the effects of factors on the response mean and variation. So each factor can be assessed independently of all the other factors. Therefore, the effect of one factor does not affect the estimation of another factors. Later, experimental results, resulted from conducting the matrix experiment, are analyzed using S/N and ANOVA analyses.
The mean value and S/N ratio play a major role in Taguchi based sensitivity analysis and optimization. The S/N ratio characteristics can be classified into three categories: the nominal- the better, the smaller-the better, and the higher-the better in a case of continuity of the quality characteristics for engineering purposes. The lower the better is used where it is desirable to minimize the output parameter, also the higher the better is employed where the higher value of the output parameter is desirable. The nominal the better is used where the nominal or target value and variation about that value are minimum. These categories correspond to different formulations for calculation of S/N ratio.
In the present investigation, the peak head acceleration and the HIC36 as two output parameters are to be minimized, thus the smaller-the better approach has been used for both based on the following formulation for calculating S/N ratio (Khalkhali et al., 2017a):
2 11
10log
n ii
S
y
N
N
(2)Where yi denotes the value of each objective function, and n represents the number of repetition of each experiment.
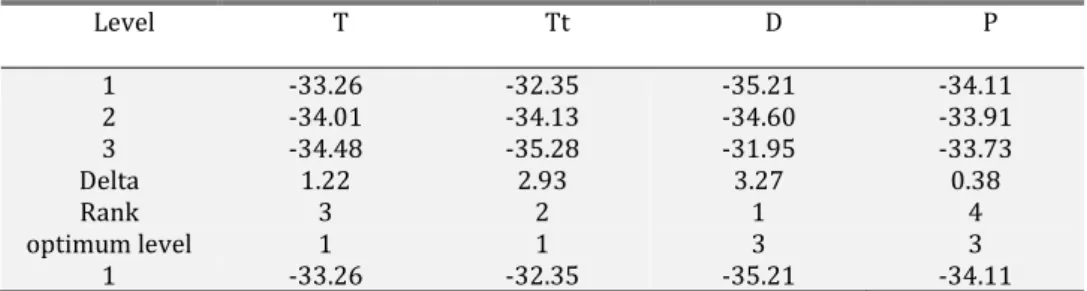
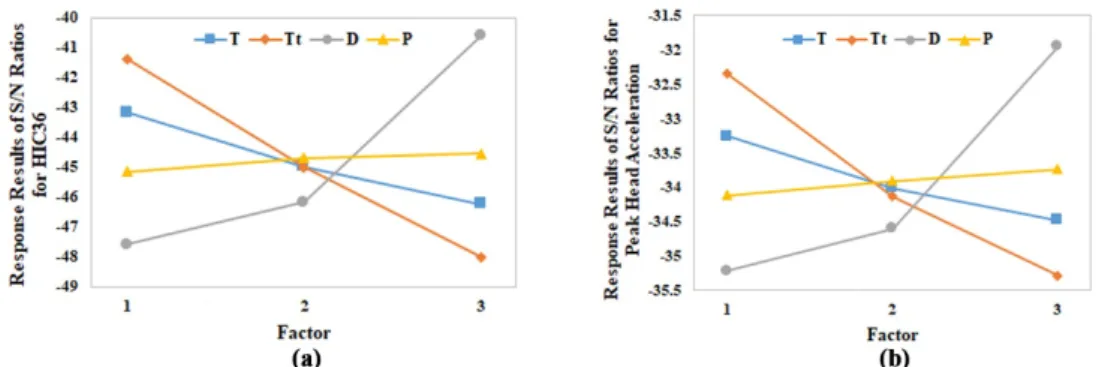
The goal of Taguchi methods is to determine factor settings that will minimize the variability of the response about some ideal target. Taguchi methods do this by concentrates on minimizing variability. So Taguchi methods set all factors that have a significant effect on the S/N ratio at the level where the S/N is maximized. Values of S/N ratio for each computer experiment is reported in Table 8 and also Figure 13. Mean value of S/N ratio for the HIC36 and peak head acceleration are tabulated in Tables 10 and 11. Each level providing the largest S/N ratio would be considered as the optimum one.
Table 10: Signal to noise ratio for the HIC36
Level T Tt D P
1 -43.18 -41.38 -47.59 -45.15
2 -44.98 -45.00 -46.18 -44.69
3 -46.23 -48.01 -40.61 -44.55
Delta 3.05 6.62 6.98 0.61
Rank 3 2 1 4
optimum level 1 1 3 3
1 -43.18 -41.38 -47.59 -45.15
Table 11: Signal to noise ratio for peak head acceleration
Level T Tt D P
1 -33.26 -32.35 -35.21 -34.11
2 -34.01 -34.13 -34.60 -33.91
3 -34.48 -35.28 -31.95 -33.73
Delta 1.22 2.93 3.27 0.38
Rank 3 2 1 4
optimum level 1 1 3 3
Figure 13: a) S/N graph variation of the HIC36; b) S/N graph variation of peak head acceleration
Mean values for the HIC36 and peak head acceleration are shown in Figure 14. It must be pointed out that in these curves, the sharper the slope of the line, the more effective that particular design parameter on output parameters. Mean values for the HIC36 and peak head acceleration are also reported in Tables 12 and 13. In these tables, the value of delta which is a difference between the maximum value and the minimum value of output, is used for sensitivity analysis. Based on the obtained results, it is evident that airbag distance to the dummy (D), trigger time (Tt), initial inflator gas temperature (T) and tank pressure (P) are ranked as the 1st to 4th dominant factor in determining peak head acceleration and the HIC36, respectively.
Table 12: Mean response of the HIC36 Mean
level T Tt D P
1 156.8 120.3 261.7 187.1
2 183.1 197.4 211.4 191.2
3 246.0 268.2 112.8 207.5
Delta 89.2 147.9 148.9 20.4
Rank 3 2 1 4
optimum level 1 1 3 1
Table 13: Mean response of peak head acceleration Mean
level T Tt D P
1 46.87 41.70 58.53 51.13
2 50.57 52.13 54.17 51.00
3 55.20 58.80 39.93 50.50
Delta 8.33 17.10 18.60 0.63
Rank 3 2 1 4
optimum level 1 1 3 3
Figure 14: a) Mean response graph variation of the HIC36; b) Mean response graph variation of peak head acceleration
Additionally, the optimum design considering this quality becomes D3Tt1T1P3, meaning that from the standpoint of peak head acceleration and the HIC36 from Tables 10 and 11, the best setting is predicted provided that parameter D (airbag distance to dummy) is in the third level or 35 cm (D3), parameter Tt (trigger time) is in the first level or 15 ms (Tt1), parameter T (initial inflator gas temperature) is in the first level or 900 K (T1), and finally parameter P (tank pressure) is selected in the third level or 200 KPa (P3).
4.2 ANOVA analysis
In this study, the aim of ANOVA is an evaluation of the significance of each design parameter on peak head acceleration and the HIC36. In fact, by calculating the contribution percentage of each design parameter, this analysis can shed light on the importance of each design parameter with respect to objective functions (Khalkhali et al., 2017a). ANOVA analysis for the HIC36 and peak head acceleration are shown in Tables 14 and 15. As seen in tables, there is a statistical tool called an F test to see which design parameters have a significant effect on the quality characteristic. Usually, when F > 4, it means that the change of the design parameter has a significant effect on the quality characteristic. The contribution of each factor is calculated according to the sum of squares to the total sum of squares ratio. The most amount of contribution on peak head acceleration and the HIC36 is related to airbag distance to dummy with 50.7% and 42.7%, respectively. Tank pressure has very low contribution with 0.9% and 0.06%.
Table 14: Results of ANOVA of output for the HIC36
Factor Sum of squares % contribution Degrees of
freedom Mean square
D 34443.0 42.7 2 17221.5
Tt 32817.3 40.7 2 16408.7
T 12610.0 15.6 2 6305.0
P 698.7 0.9 2 349.3
Error 0
Total 80569.0 100 8
Table 15: Results of ANOVA of output for peak head acceleration
Factor Sum of squares % contribution Degrees of
freedom Mean square
D 567.62 50.7 2 283.81
Tt 445.71 39.8 2 222.85
T 104.60 9.3 2 52.30
P 0.67 0.06 2 0.33
Error 0
4.3 Optimum levels, out-of-position, and the worst case analysis
Based on the results obtained from Taguchi optimization process, the optimum level settings for peak head acceleration is D3Tt1T1P3. As a result, concerning the values listed in Table 13, the optimum peak head acceleration is predicted as follows (Tansel et al., 2011):
Predicted minimum peak head acceleration: D3+ Tt1+ T1+ P3-3 × (¯R) = 39.93+41.70+46.87+50.50-3 ×50.88=26.36g
where ¯R is an average of total responses for peak head acceleration.
Once the optimum level of the design parameters is selected, it is needed to verify the improvement of the output parameters using these optimum values. To this aim, a frontal impact simulation is performed in which peak head acceleration is calculated. The optimum value of peak head acceleration corresponding to the optimum setting of D3Tt1T1P3 is obtained 28.8g, which in comparison to predicted value, it is approximately equal to predicted value. To evaluate the optimum design in out-of-position conditions some additional analysis are performed. As mentioned earlier, according to the results coming from Taguchi and ANOVA analysis, airbag distance to dummy has the most effect on the peak head acceleration. It is also obtained that the peak head acceleration is increasing by decreasing airbag distance to the dummy. Therefore, two different airbag distance to dummy is considered as out-of-position conditions. It can model simply changing in driver’s seat position, according to its ability for going to front and back. Peak Head acceleration value according to changes of airbag distance to dummy while the other design factors are at the optimum point, are shown in Figure 15. It is clear from this figure that in two out-of-position points, head acceleration is in standard range and has a good sentiment.
Figure 15: Peak Head acceleration values according to changes of airbag distance to dummy while the other design factors are at optimum levels
Obtained results show that for all 9 experiments designed by Taguchi and also two out-of-position conditions ECE R94 requirement are satisfied. In this section, the worst case of the design which is not considered in those 9 experiments is also predicted using Taguchi and re-evaluated using finite element simulation. Based on the results obtained from Taguchi, the worst level settings for peak head acceleration is D1Tt3T3P1. Concerning the values listed in Table 13, the worst peak head acceleration is predicted as follows:
Predicted maximum peak head acceleration: D1+ Tt3+ T3+ P1-3 × (¯R) = 58.53+58.80+55.20+51.13-3 ×50.88=71.02
5 CONCLUSIONS
In this paper, an automotive frontal impact was simulated and occupant head injury investigated based on ECE R94 regulation. In this way, Taguchi and ANOVA were used for sensitivity analysis and optimization process. The following conclusions can be drawn from this study:
• Each one of nine different designs of Taguchi array represented in this paper meets the requirements of ECE R94.
• Airbag distance to the dummy (D), trigger time (Tt), initial inflator gas temperature (T) and tank pressure (P) are ranked as the 1st to 4th dominant factor in determining peak head acceleration and the HIC36, respectively.
• Response values of Peak head acceleration and the HIC36 decrease by increasing of airbag distance to the dummy. Those response values increase by increasing in trigger time and initial inflator gas temperature. However, there is a negligible change in the response values by changing in tank pressure comparing to the other input parameters.
• Best setting provided that parameter D (airbag distance to dummy) is in the third level or 35 cm (D3), parameter Tt (trigger time) is in the
first level or 15 ms (Tt1), parameter T (initial inflator gas temperature) is in the first level or 900 K (T1), and finally parameter P
(tank pressure) is selected in the third level or 200 KPa (P3).
• In the case of optimum design, the driver can reduce his (or her) distance to the airbag around 10 cm without failing the ECE R94 requirements.
• The worst design was also obtained by Taguchi method. Results showed that considering values represented in this paper, ECE R94 requirements are satisfied in the worst case.
References
Bathe, K.J. (2001) ‘computational fluid and solid mechanics Proceedings’, Amsterdam: Elsevier.
Beik, V., Fard, M., & Jazar, R. N. (2016) ‘Crashworthiness of tapered beams in automotive application’, In R. N. Jazar & L. Dai (Eds.), ‘Nonlinear approaches in engineering applications: advanced analysis of vehicle related technologies’, pp. 3-62, Springer International Publishing.
Boran, C., & Feltgen, C. (2001) ‘Crash sensors for the dosed deployment of multi-stage restraint systems’, ATZ worldwide, Vol.103(1), pp.9 - 11.
Cheng, Z. Q., Thacker, J. G., Pilkey, W. D., Hollowell, W. T., Reagan, S. W., and Sieveka, E. M. (2001) ‘Experiences in reverse-engineering of a finite element automobile crash model’, Finite elements in analysis and design, Vol. 37, pp.843-860.
Deng, X., Potula, S., Grewal, H., Solanki, K. N., Tschopp, M. A., and Horstemeyer, M. F. (2013) ‘Finite element analysis of occupant head injuries: Parametric effects of the side curtain airbag deployment interaction with a dummy head in a side impact crash’, Accident Analysis & Prevention, Vol. 55, pp.232-241.
Deng, X., Chen, S. A., Prabhu, R., Jiang, Y., Mao, Y., & Horstemeyer, M. F. (2014) ‘Finite element analysis of the human head under side car crash impacts at different speeds’, Journal of Mechanics in Medicine and Biology, Vol. 14(06).
Eppler, T., & Schatz, R. (2007) ‘Modelling of spot welds for NVH simulations in view of refined panel meshes’, Master’s Thesis, Department of Civil and Environmental Engineering, Chalmers University of Technology, Göteborg, Sweden.
Hallman, J. J., Yoganandan, N., & Pintar, F. A. (2008) ‘Torso side airbag out-of-position evaluation using stationary and dynamic occupants’, Biomedical sciences instrumentation, Vol. 44, pp.123.
Im, K-S., Zhang, Z-C. and Cook, Jr., G.O. (2016) ‘Airbag Inflator Models in LS-DYNA’ in 14th International LS-DYNA Users Conference, Livermore Software Technology Corp., Livermore, CA 94551, USA
Khalkhali, A., Noraie, H., and Sarmadi, M. (2017b) ‘Sensitivity analysis and optimization of hot-stamping process of automotive components using analysis of variance and Taguchi technique’, Proceedings of the Institution of Mechanical Engineers, Part E: Journal of Process Mechanical Engineering, Vol. 231(4), pp.732-746.
Li, N., Fang, H., Zhang, C., Gutowski, M., Palta, E., & Wang, Q. (2015) ‘A numerical study of occupant responses and injuries in vehicular crashes into roadside barriers based on finite element simulations’, Advances in Engineering Software, Vol. 90, pp.22-40.
Liu, C. H., Lai, Y. C., Chiu, C. H., & Lin, M. H. (2016) ‘Interior head impact analysis of automotive instrument panel for unrestrained front seat passengers’, Key Engineering Materials, Vol. 715, pp.186-191.
Lilehkoohi, A. H., Faieza, A. A., Sahari, B. B., Nuraini, A. A., & Halali, M. (2014) ‘Crashworthiness determination of side doors and b pillar of a vehicle subjected to pole side impact’, Applied Mechanics and Materials, Applied Mechanics and Materials, Vol. 663, pp. 552-556.
Malen, D.E. (2011) Fundamentals of Automobile Body Structure Design, SAE International.
Pesco. (2017) [online] http://www.posco.com/homepage/docs/ (Accessed 4 September 2017)
Qi, W., Jin, X. L., and Zhang, X. Y. (2006) ‘Improvement of energy-absorbing structures of a commercial vehicle for crashworthiness using finite element method’, The International Journal of Advanced Manufacturing Technology, Vol. 30, pp.1001-1009.
Safari, H., Nahvi, H., & Esfahanian, M. (2017) ‘Improving automotive crashworthiness using advanced high strength steels’, International Journal of Crashworthiness, pp.1-15.
Schäffer, M., Sturm, R., & Friedrich, H. E. (2017) ‘Methodological approach for reducing computational costs of vehicle frontal crashworthiness analysis by using simplified structural modelling’, International Journal of Crashworthiness, pp.1-15.
Schmitt, K. U., Niederer, P., Muser, M., and Walz, F. (2010) Trauma biomechanics., Springer, Berlin.
Shojaeefard, M. H., Khalkhali, A., Sarmadi, M., & Hamzehi, N. (2015) ‘Investigation on the optimal simplified model of BIW structure using FEM’, Latin American Journal of Solids and Structures, Vol. 12(10), pp.1972-1990.
Shojaeefard, M. H., Khalkhali, A., and Lahijani, A. T. (2016) ‘Parametric Modal Study and Optimization of the Floor Pan of a B-Segment Automotive Using a Hybrid Method of Taguchi and a Newly Developed MCDM Model’, Latin American Journal of Solids and Structures, Vol. 13, pp.3039-3061.
Tansel, I. N., Gülmez, S., Demetgul, M., & Aykut, Ş. (2011) ‘Taguchi method–GONNS integration: complete procedure covering from experimental design to complex optimization’, Expert Systems with Applications, Vol.38(5), pp.4780 - 4789.
United Nations Economic Commission for Europe (1998) ECE R94: Uniform provisions concerning the approval of vehicles with regard to the protection of the occupants in the event of a frontal collision. http://www.unece.org/fileadmin/DAM/trans/doc/.../ELSAsg-1-04e.pdf (Accessed 4 September 2017)
Vankanti, V. K., and Ganta, V. (2014) ‘Optimization of process parameters in drilling of GFRP composite using Taguchi method’, Journal of Materials Research and Technology, Vol. 3(1), pp.35-41.